channel control room measurement and
perception
Fazenda, BM and Angus, JAS
Title
Internal acoustic design for a multichannel control room measurement
and perception
Authors
Fazenda, BM and Angus, JAS
Type
Conference or Workshop Item
URL
This version is available at: http://usir.salford.ac.uk/9454/
Published Date
2002
USIR is a digital collection of the research output of the University of Salford. Where copyright
permits, full text material held in the repository is made freely available online and can be read,
downloaded and copied for noncommercial private study or research purposes. Please check the
manuscript for any further copyright restrictions.
INTERNAL ACOUSTIC DESIGN FOR A MULTI-CHANNEL
CONTROL ROOM - MEASUREMENT AND PERCEPTION
B.M.Fazenda University of Salford, School of Acoustics and Electronic Engineering, UK J.A.S. Angus University of Salford, School of Acoustics and Electronic Engineering, UK
0. ABSTRACT
As an extension to their academic teaching facilities, the School of Acoustics and Electronic Engineering at the University of Salford commissioned a set of studios to be used for various audio technology modules.
In the main control room, facilities were required to enable monitoring both in surround sound format as well as conventional stereo. The control room would have a dual purpose in terms of monitoring format and the acoustic design would have to accommodate for this.
This paper sets out a presentation of the design theory and techniques utilised. The design approach was to address issues like reflection free zone and suitable reverberation times for critical listening. This was attempted using a combination of commercially available material and purpose built units for acoustic control. Various sets of measurements showing the results at the various construction stages are presented. A subjective test is carried out using binaural recordings taken at beginning and end of the internal acoustic design in order to identify preferences and perceptible improvements.
1.
INTRODUCTION
For the design of audio control rooms a number of philosophies have been adopted, developed and implemented [1,2,3,4]. A few are based not only on physical parameters for sound reproduction, but also, and perhaps most importantly on the subjective perception of who is going to be using these rooms.
Applying some of these widely accepted prerequisites for the correct perception of reproduced sound, the internal acoustic control of a room was devised in order for it to be used not only as a standard stereo control room, but also as a surround control room.
It seems reasonable to argue that no matter what different types of design philosophies there are, all should concentrate on enabling the user to feel confident that what he/she is monitoring corresponds to a faithful reproduction of what is being recorded or processed. For this to happen it is necessary to ensure that all the links in the chain between source and listener do not distort the sound in any way. Nowadays, with such advanced technology it is reasonable to expect that while passing through mixing desks, amplifiers, processors, etc the signal quality is quite well preserved. However, it is on the electro-acoustic transduction that problems still exist. Indeed, it is apparent that speaker design has not developed at the same rate as other audio products. When considering the design of a control room it is the interaction between speakers and room that still presents the main problem. The task of the acoustician is to design a room that enables the best possible system to deliver a problem free sound to the user. If the frequency, step and phase responses of the speaker are accurate, then the room in which they will be used should correspond providing an accurate yet comfortable working environment. Indeed it is trying to satisfy both these requirements – accurate and comfortable – that philosophies may differ.
In this way it is arguable that the design should concentrate on providing the best possible environment to allow the listener to perceive what the speakers, are reproducing, without any evident effects from the room or set-up, but still allowing the environment to sound pleasant.
In order to use 5 similar speaker units, it was decided on very high quality active monitors, which could be mounted on stands. These are a smaller type of monitor, which share some of the characteristics of near field monitors. The directionality of the speakers represents an advantage given that there is less energy off axis to be controlled. The frequency control extends down to around 40 Hz, which was considered acceptable for the purpose, without the need of an additional low frequency unit. The disadvantages of introducing an extra channel for the low frequencies, with associated phase differences and cross over problems are too great to justify an extension of 10Hz in the frequency response. The capability of reproducing the large SPL often thought necessary in a control room is not a problem with these units.
Apart from the right set-up of speaker/listening position for both stereo and surround systems, the project concentrates on three main sections.
a. Reflection control; Avoid comb-filtering effects from very near surfaces and achieve a time gap free of early reflections.
b. Reverberation time; Aim to achieve recommended Reverberation time values for this type of room.
c. Frequency response; Control of problematic modes that may affect the correct perception of the low frequencies.
Measurements were taken during the construction and installation stages. These are presented with the aim of identifying the success and relevance of acoustic control procedures.
Binaural recordings of commercial music were also taken at different stages of the construction. The results for a short preference test are presented in order to identify the success of the project.
2.
DESIGN STAGES
2.1
Layout and Listening position
The dimensions of the control room were calculated in order to achieve an optimum modal distribution at low frequencies. The final internal dimensions for the structural shell are 4.98m wide, 3.94m long and 2.7m high.
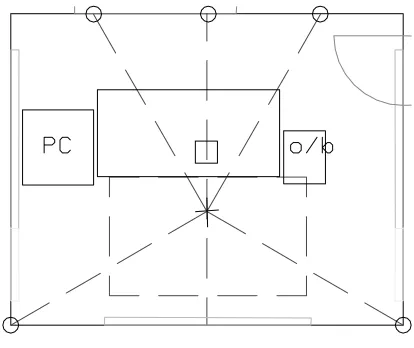
The speakers were placed along a 2.88m radius, with the front speakers at 30º and the back speakers at 120º. The unorthodox (but accepted for 5.1 surround recommendations [5]) angle for the back speakers was such that these would be placed in the back corners of the room and subsequently the front speakers along the front wall (Fig. 1). This was decided in order to achieve a better radiation from the speakers into the room avoiding potential colouration effects associated with reflections from nearby walls. The centre speaker had to be delayed by 1ms, which corresponds to the physical displacement from the equidistant circle.
Acoustic design for a control room – Fazenda and Angus
Figure 1 - Plan of Control Room
a) Absorbent material on left, right, ceiling and back walls. b) Speakers represented by circles. c) Dashed rectangular area represents reflection free zone.
2.2 Reflection
control
Studies by Haas and subsequently applied by others [6,7,8] concentrate on the effects of reflections arriving at the listening position within a certain interval of the direct sound. The general effects are associated with image shift, which can affect the stereo image. For music studios it is generally accepted to design for an initial time delay gap of at least 15ms after the arrival of direct sound. The level of first reflections should be at least 10dB lower than the direct sound [5]. The objective is therefore to either redirect or absorb the first order reflections and all those that may lie in the cases stated above. The absorption was implemented by placing a commercially available unit on all surfaces where first order reflections originate. This was determined using the image-source method with the help of a CAD package. Figure 1 shows the areas on the wall where the absorption was installed. A reflection free area of 2.5m wide by 1.5m deep is shown. A large area of the ceiling is also covered to control reflections from that surface.
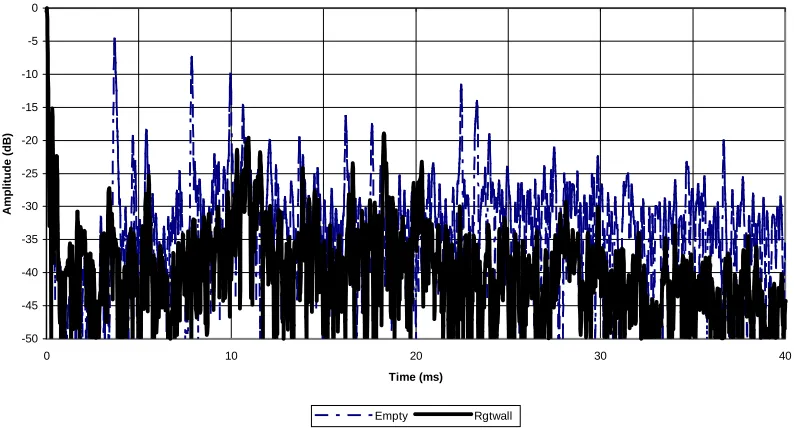
ETC for Left Speaker and listener at pos 1
-50 -45 -40 -35 -30 -25 -20 -15 -10 -5 0
0 10 20 30 40
Time (ms)
Amplitude (dB)
[image:5.595.100.497.193.408.2]Empty Rgtwall
Figure 2 - ERC for Left Speaker measured at Position 1
Observation of the above graph reveals the effects of controlling the first reflections at the listening position. All reflections are effectively reduced much below the –10dB threshold. The first clear reflection emerging from the diffuse sound happens at about 18ms with a peak level of –19dB relative to direct sound.
The following graphs show ETCs for the left surround speaker measured at the optimum listening position and also at another position inside the reflection free zone.
ETC for Left Surround speaker at listener pos 1
-50 -40 -30 -20 -10 0 10
0 10 20 30 40
Time (ms)
Amplitude (dB
)
[image:5.595.95.504.542.738.2]Acoustic design for a control room – Fazenda and Angus
The very early reflections arriving at the listener position at 1, 3 and 4ms from the direct sound are caused by the only large surface in the room, which is not treated with absorbent – the front wall. This surface was left untreated to prevent a very low RT caused by excessive absorption in the room. It also accommodates a window into the recording area. These reflections are not considered a major problem given that the sound generated by the surround speakers is usually not as loud as the front speakers. The use of diffusers could provide a diffuse return of the sound from this surface and improve unwanted specular reflections. However, preliminary listening tests have shown that the reflections arriving from the front wall do not hinder the critical monitoring for surround sound. Nevertheless, when present, these reflections are still below the –10dB threshold, and therefore within the recommendation guidelines.
ETC for Left Surround speaker with listener at pos 7
-50 -45 -40 -35 -30 -25 -20 -15 -10 -5 0
0 5 10 15 20 25 30 35 40
Time (ms)
[image:6.595.91.513.297.514.2]Amplitude (dB)
Figure 4 - ETC for Left Surround Speaker measured at Position 7
Listener position 7 is placed right near the mixing desk at a symmetric distance to both stereo speakers. Figure 4 shows the ETC measured at this position when using the Left Surround speaker. As was the case for listener position 1, there are some clear reflections, mainly due to the front wall, but all below the –10dB threshold.
2.3 Reverberation
Time
Some of the requirements derived from various international standards indicate the optimum RT according to the room’s dimensions [5]. For this project, the volume of the room is 53m3 , which results in a recommended average RT of 0.2s in the region of 200 Hz to 4 KHz.
The following graph represents RT results for three stages during the acoustic treatment of the room. 1. The first stage is an empty room consisting of bare painted brick walls, with carpeted floor, the
mixing desk and outboard equipment.
2. The second stage brings in the mid range acoustic absorption provided by the absorbing panels mounted at mid height on the walls and on the ceiling.
Reverberation Time
0 0.5 1 1.5 2
63 125 250 500 1000 2000 4000
Frequency Band (Hz)
RT (s)
[image:7.595.136.461.160.325.2]Empty Mid Final
Figure 5 - Reverberation Time of Control Room
The initial stage is obviously very reverberant, with values much above any of the permitted standards. The only absorption in the room is caused by the carpet and upholstery on chairs.
After the introduction of the mid range absorption material, the reverberation time is reduced dramatically to values around 0.2s above 500Hz. This is the operating range of the absorption material used. Hence, this result represents good agreement with the predicted values during the design stage, which were based on the absorption coefficients provided by the manufacturers.
Because these absorption panels have residual absorption below the design frequencies, there is also a reduction at lower frequencies. However, some of the low frequency absorption provided at this stage could also be due to resonant behaviour of these structures, which are mounted on battens and slightly displaced from the wall.
The final result represents a further reduction of RT’s under the 500Hz frequency band. This was achieved with the use of modular membrane absorbers, designed and built to match centre frequencies of two problematic frequency bands. The modules were placed on a 50cm high strip near the floor and covering the entire perimeter of the room. Details for the design and construction of the modules are given in the next section.
The effects on the RT of the room are acceptable, bringing the value at 250Hz to within 50% of the average RT. However, and because the mid range RT is so well controlled it would be desirable to achieve a smaller figure for the lower octaves. A large difference in RT between mid and lower frequencies may give a perception of a “bass heavy” room, which will originate in wrong decisions when monitoring.
A further reduction of RT can be achieved by placing more resonant absorbers in the upper corners of the room, at pressure maxima points. This is something that can and hopefully will be easily implemented.
2.5 Frequency
Response
In this particular case, the speakers are placed near the walls to prevent very early reflections from causing comb-filtering effects. On the other hand, placing the sources very close to a boundary increases their radiation efficiency, especially at lower frequencies. To address this problem various tests and measurements were conducted in order to identify how much of a correction was needed for this. The correction could be applied by means of dipswitches on the speakers, which alter its low frequency response.
Acoustic design for a control room – Fazenda and Angus
dependent on the modal distribution of the particular space.
For this room, the dimensions were determined using a methodology based on a numerical optimisation that attempts to achieve the flattest possible frequency response [9].
Although optimal for the final dimensions it was found that some frequency bands still represented a problem and would need some additional control. This was implemented in the form of resonant absorbers that were placed along the perimeter of the room, near the floor, hence near pressure maxima zones.
The design of resonant absorbers is related to the concept of a mass on a spring and can be determined using relevant formulae.
A more general formula is given in [10], which derives from the concepts mentioned above.
Md
f
res=
60
(Eqn. 1), where M is the moving mass and d the depth of the gap behind the membranein m. A correction factor should be added, which is related to the stiffness of the membrane used. This factor slightly increases the frequency of resonance.
The requirement for the project was to build modules that could be removable. A modular dimension of 500X600Xthickness (mm) was chosen. The modules were designed for 45Hz and 89Hz, made of MDF boxes with 4mm plywood membranes. This resulted in two module thickness – 9cm and 20cm – that were considered acceptable for installation. The cavity was filled with rockwool to avoid audible resonances and to widen the operational bandwidth. Additionally, the membranes were highly damped and their mass increased using self-adhesive bitumen based material to achieve a wide bandwidth. The placement of the modules was arranged in a non-repetitive Barker sequence along each wall all around the room.
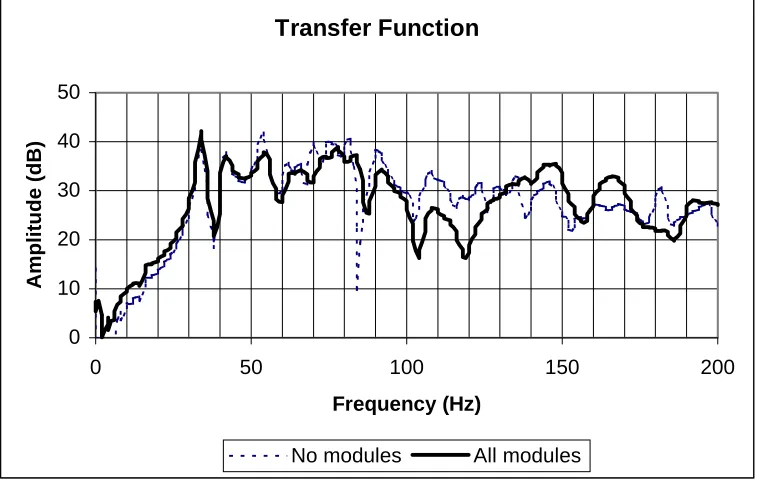
From the results on Figure 5 it is already clear that the introduction of the membrane absorbers provides some control of the lower frequencies.
Figure 6 shows results measured using a dual FFT analyser reproducing pink noise, a large speaker placed in one corner and the microphone placed in the opposite corner. For the measurement of such low frequencies the speaker may be considered omni-directional. The purpose was to find out how the presence of the modules affected the excitation of the resonant modes.
Transfer Function
0 10 20 30 40 50
0 50 100 150 200
Frequency (Hz)
Amplitude (dB)
[image:8.595.109.488.491.732.2]No modules All modules
Figure 6 - Frequency Response up to 200Hz measured at one corner of the room
have also been affected, like the region between 60 and 90Hz and the peak at 110Hz.
Although presenting small changes, the results show some improvement in the control of the low frequencies and these were translated to a better listening experience in the room.
Comparing these results with the reduction in RT explained in section 2.4 shows that the use of membrane absorbers can help to reduce the undesirable effects of very strong modal resonances.
3. PERCEPTION
TESTS
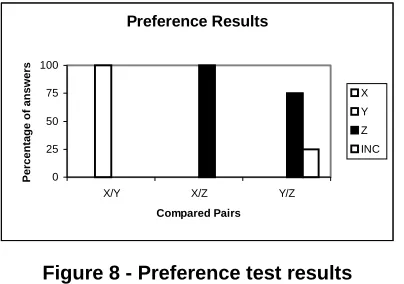
A preference test was set up that used binaural recordings taken in the room at the three stages mentioned previously. The purpose of the test was to identify which stage presents the best acoustic environment for critical listening and if the acoustic design had any success in effectively creating a good critical listening environment.
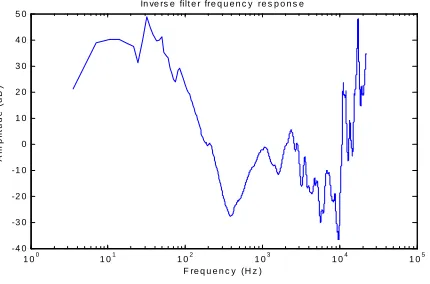
The binaural test signals were recorded using a dummy head placed at the optimum listening position. A sample of commercially available pop music was reproduced via the existing stereo set-up. The binaural signal should then be presented to each subject via a pair of high quality closed headphones, capable of reproducing frequencies in the range 30-20000Hz. The headphone/dummy head closed loop as a system has itself a certain frequency response. When presenting any signal via the headphones the frequency response of this loop will be superimposed on the test samples. In order to account for this effect an inverse filter can be determined from the impulse response of the loop. The frequency response of this filter is shown on the following charts.
1 00 1 01 1 02 1 03 1 04 1 05 -4 0
-3 0 -2 0 -1 0 0 1 0 2 0 3 0 4 0 5 0
F re q u e n c y (H z )
A
m
pl
it
ude (
d
B
)
[image:9.595.190.405.404.546.2]In ve rs e filt e r fre q u e n c y re s p o n s e
Figure 7 - Frequency response for inverse filter
When convolved with this filter, the sample binaural signals represent a close approximation of what the subject would hear if sitting in the control room at the position where the binaural recordings were taken. The presentation through headphones has a limitation associated with the fact that listening through them does not properly recreate the perceived acoustic environment or the sensation of being surrounded by sound. The effect of “in head localisation” will inevitably make it harder for the subject to imagine that he/she is in the real control room. In order to overcome this problem it is necessary to design cross talk cancellation filters and to present the test program via two loudspeakers in an anechoic room. However, it was identified that great part of the acoustic environment is effectively recreated by the headphone presentation. Additionally, the differences between samples representing different stages still show a good correlation to the perceptible differences in the room. Therefore, it was decided that carrying out the test in a quiet normal room using a CD player and headphones presented a great advantage over the set-up of two loudspeakers in an anechoic room.
Acoustic design for a control room – Fazenda and Angus
quality of sound being reproduced. It was stressed that it was the same original piece of music that was being reproduced and that any noticeable changes were due to changes in the acoustical environment rather that on the original signal. Subjects were asked to concentrate on factors like localization, stereo image, RT, clarity and frequency balance.
The test presents A/B pair comparisons relative to three different acoustic conditions. The subject is required to state a preference after presentation of each pair. Options available are sample A, sample B or Repeat. The comparison can be repeated until the subject is satisfied and wishes to move on to the next pair. Each condition is compared to all the others in both permutations. Therefore, there are a total of 6 possible permutations, for example X/Y, X/Z, Y/Z, Z/X, Z/Y and Y/X. This way every sample is compared to each other and in random order of appearance. Invalid answers will be identified if the subject selects both cases out of the two permutations giving an inconclusive result.
Preference Results
0 25 50 75 100
X/Y X/Z Y/Z
Compared Pairs
Percentage of answers
X
Y
Z
[image:10.595.199.401.284.426.2]INC
Figure 8 - Preference test results
X – Empty room; Y – With wideband absorption (>500Hz); Z – With all absorption and low frequency control membranes
Analysis of results shows that the room with wideband absorption is always preferred to the empty room case. All subjects have selected the Y option when compared to the X option. This is an obvious result, given that the introduction of wideband absorption has provided a control of all first order reflections and dramatically reduced the reverberation time above 500Hz.
When comparing between an empty room and the full bandwidth acoustic treatment, including low frequency control (X and Z cases), the preference also goes to the 2nd case as expected. For this pair there was consensus across the panel.
It was in the comparison between the 2nd and 3rd cases, Y and Z, that the subjects revealed more difficulty in choosing. One of the answers was inconclusive given that the subject has stated preference for one sample on the first permutation and chose the other sample on the second permutation. All the other subjects have successfully elected the fully controlled room as their preferred.
Overall, the most preferred case is the one where all the acoustic control is installed.
It is arguable that this test does not prove that the subjects find the final room as the optimum environment for a control room. It proves however that the changes in the acoustic environment are perceived as positive and conducive for the creation of a critical listening environment.
4. CONCLUSION
A control room was designed to support both stereo and multi-channel monitoring formats. The design objectives followed previously published guidelines for the correct sound in audio control rooms for stereo as well as multi-channel listening rooms.
reverberation time of 0.2s above 500Hz, which corresponds to the guidelines set out by the multi-channel for a room with this volume. However, below the operational frequency of the absorption material the RT was still considered to high.
Further control of the lower frequencies was achieved by using modular membrane absorbers, designed to resonate at specific frequencies but with a large operating bandwidth. After installation, it was found that these units effectively reduced the frequency bands in question bringing the reverberation time down to 0.4s at 250Hz. The reproduction of lower frequencies sounded more controlled and precise. However, it was also found that a further reduction of RT at the lower
frequencies would still be necessary. This could be further implemented by the use of other resonant absorbers to increase the absorption area available.
A subjective test was carried out in order to identify the effects of the acoustic control used. This used binaural recordings taken at various stages of the construction. The results effectively showed that the introduction of mid band absorption resulted in a strong preference over the more
reverberant room. The introduction of low frequency control was successfully perceived and preferred by most subjects over the two previous cases.
The overall results of the subjective test revealed that the control procedures have resulted in a good environment for the critical listening of audio.
Further use of the room and the critical analysis of final products when listened to in other systems and environments will give a further indication of the success of the design and suitability of the room.
With the support of:
Programa Praxis XXI, Fundação Para a Ciência e a Tecnologia, Ministério da Ciência, Portugal.
5.
REFERENCES
[1] Davis, D,Davis, C. “The LEDE concept for the control of acoustic and psychoacoustic parameters in recording control rooms”, Journal of the Audio Engineering Society, Vol 28, Number 9, 1980 [2] D’Antonio, P, Konnert, J. “The RFZ/RPG approach to control room monitoring”, Audio Engineering Society preprint, 2157 (I-6), Presented at the 76th convention, 1984
[3] Toyoshima, S, Suzuki, H. “Control room acoustic design”, Audio Engineering Society preprint, 2325 (C3), presented at the 80thConvention, 1986
[4] Newell, P. “A proposal for a more perceptually uniform control room for stereophonic music recording studios”, Audio Engineering Society preprint, 4580 (K-9), Presented at the 103rd Convention, 1997 [5] Rumsey, F, Spatial Audio,Focal Press, Oxford, UK, 2001, Chapter 5, pp119-149
[6] Haas, H. “The influence of a single echo on the audibility of speech”, Acustica 1(2), p49, 1951. [7] Walker, R. “High frequency room responses: acoustic design and the control of stereophonic image quality” BBC Research and Development Department, 1994/11.
[8] Voelker, E.J. “The V-criterion for good listening conditions in control rooms – on the importance of the first 15ms” Proceedings of the Institute of Acoustics, vol. 20 Part 5, 1998.
[9] Cox, T, D’Antonio, P. “Determining optimum room dimensions for critical listening environments: A new methodology” Audio Eng. Society Convention paper, presented at the 110th Convention, 2001. [10] Howard, D M, Angus, J A S, "Introduction to Acoustics, and Psychoacoustics", Second Edition, Music Technology Series, Series Editor, Francis Rumsey, Focal Press, an imprint of Butterworth-Heinemann, ISBN 0-240-51428-9, November 2000