Synthesis of carbon nanostructures from high
density polyethylene (HDPE) and polyethylene
terephthalate (PET) waste by chemical vapour
deposition
To cite this article: M N M Hatta et al 2017 J. Phys.: Conf. Ser. 914 012029
View the article online for updates and enhancements.
iron nanopowders
A Koshanova, G Partizan, B ansurov et al.
Utilization of polyethylene terephthalate (PET) in asphalt pavement: A review
A. F. Ahmad, A. R. Razali and I. S. M. Razelan
-Electroluminescence in Polyethylene Terephthalate
Keiichi Kaneto, Katsumi Yoshino, Kwan-chi Kao et al.
Synthesis of carbon nanostructures from high density
polyethylene (HDPE) and polyethylene terephthalate (PET)
waste by chemical vapour deposition
M N M Hatta, M S Hashim, R Hussin, S Aida, Z Kamdi, AR Ainuddin and MZ Yunos
Nano and Surface Modification Research Group, Faculty of Mechanical and Manufacturing Engineering, Universiti Tun Hussein Onn Malaysia, Parit Raja 86400 Batu Pahat Johor.
Faculty of Engineering Technology, Universiti Tun Hussein Onn Malaysia, Parit Raja 86400 Batu Pahat, Johor
Email: mnasrul@uthm.edu.my
Abstract. In this study, carbon nanostructures were synthesized from High Density
Polyethylene (HDPE) and Polyethylene terephthalate (PET) waste by single-stage chemical vapour deposition (CVD) method. In CVD, iron was used as catalyst and pyrolitic of carbon source was conducted at temperature 700, 800 and 900ºC for 30 minutes. Argon gas was used as carrier gas with flow at 90 sccm. The synthesized carbon nanostructures were characterized by FESEM, EDS and calculation of carbon yield (%). FESEM micrograph shows that the carbon nanostructures were only grown as nanofilament when synthesized from PET waste. The synthesization of carbon nanostructure at 700ºC was produced smooth and the smallest diameter nanofilament compared to others. The carbon yield of synthesized carbon nanostructures from PET was lower from HDPE. Furthermore, the carbon yield is recorded to increase with increasing of reaction temperature for all samples. Elemental study by EDS analysis were carried out and the formation of carbon nanostructures was confirmed after CVD process. Utilization of polymer waste to produce carbon nanostructures is beneficial to ensure that the carbon nanotechnology will be sustained in future.
1. Introduction
2
There are currently three main synthesis methods used to produce graphitic nanofibres GNFs and/or carbon nanotubes CNTs. The methods are electric arc discharge (EAD) [4], laser ablation technique (LA) [5] and chemical vapour deposition technique (CVD) [6]. Among these techniques, the CVD is a common method used to produce GNFs and CNTs because of providing a good carbon yields and low amount of unwanted soot [7]. In CVD method, the carbon nanotubes are generated from carbon source whereas the main carbon sources are from petrochemical based such as styrene and methane [6,8 ]. In future, the petroleum source will cease and implicate to nanotechnology as well. Therefore to sustain this technology, it is needed to find other source materials to replace current petrochemical based source.
Plastics are among the materials that are used widely in industry such as in packaging, textiles, medicine and others. The difficulty to recycle this material and bad waste management resulting plastic is one of the largest contributions in solid waste disposal sector in Malaysia. The plastic will take longer time to decompose. Thus, to utilize this material will be helpful to reduce this problem. The main source of plastic production is petroleum, known as petrochemical based material. Since plastic material is petrochemical based, it is believed that this material has potential to be a carbon source for development of carbon nanostructure materials [9,10].
Thus, this study was carried out to explore the capability of polymer waste to be used in production of carbon nanostructures. Carbon nanostructures were synthesized by CVD method with two major polymer wastes; HDPE and PET were selected to replace current carbon source. The effect of different polymer waste and CVD temperature on synthesized carbon nanostructures was characterized.
2. Experimental
2.1. Sample Preparation
[image:3.595.171.444.550.653.2]The chemical vapour deposition (CVD) system was set up by using tube furnace (Elite furnace model TSH/16/50/180) as schematic shown in figure 1. The synthesis process of carbon nanostructures consist of two step, catalyst preparation and CNT deposition. For catalyst preparation, the 5g of Iron (III) Nitrate Nanohydrate dissolved in 100ml of distilled water and mixed with 2 mol of ammonia solution. Then, the sediment form in solution was dried and calcined at temperature of 400ºC for 4 hours to form of Iron hydroxide (FeOH) catalyst precursor.
Figure 1: Schematic of single-stage chemical vapour deposition (CVD) system.
2.2. Characterization
The morphology and structure of synthesized carbon nanostructure was characterized by using Field Emission Scanning Electron Microscope (FESEM) model JEOL-JGM 7600F. The sample was not coated with metal prior characterization because of carbon nanostructure was conductive material. Energy Dispersive X-ray spectroscopy (EDS) attached with FESEM was used to determine the element present in catalyst and after CVD reaction. Carbon yields were calculated based on equation 1 in order to measure the amount of carbon has been deposited on catalyst.
Carbon yields % Weight after CVD-Weight of catalyst Weight of catalyst 100 [1]
3. Results and Discussion
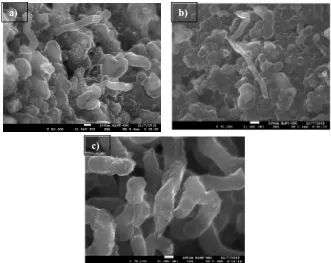
The formation of carbon nanostructures on catalyst were observed by FESEM analysis. Figure 2 shows the samples synthesized from HDPE waste at 700, 800 and 900ºC, while figure 3 shows the samples synthesized from PET waste at 700, 800 and 900ºC respectively. It is observed that the deposited carbon nanostructures on catalyst were not in filament form as expected. The carbon tends to agglomerate and form lookalike carbon ball with variant shape on the catalyst. At higher temperature 900ºC, the carbon started to deposit in filament form. However the diameter of filaments was too big. The diameter was measured around more than 100 nm.
[image:4.595.146.477.387.650.2]
Figure 2: SEM micrograph of carbon structures synthesized from HDPE at different CVD temperature a) 700ºC, b) 800ºC and c) 900ºC.
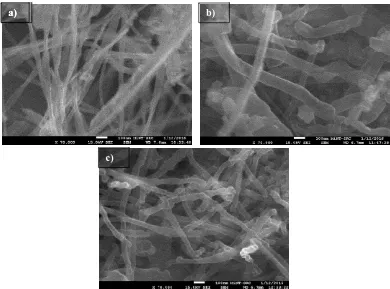
For the sample synthesized from PET, it is observed in figure 3 that the carbon nanostructures were grown as nanofilament at all temperatures. At 700ºC, the nanofilaments were grown with smooth surface and morphology. The diameter was measured around 20 to 30 nm. When the temperature was increased to 800ºC, the carbon was still grown as nanofilament. However the diameter of carbon nanofilament was bigger compared to the sample at 700 ºC. The diameter of nanofilament was around 80 to 100nm. Meanwhile, when observed the sample synthesized at 900ºC, it can be seen that the
a) b)
4
[image:5.595.129.519.291.580.2]carbon nanofilaments were grown with rougher and crook morphology. The diameter of the samples was slightly lower than sample synthesized at 800ºC. The measured diameter was around 70 to 80 nm respectively. The formation of carbon nanofilament on the catalyst is involved with diffusion process of carbon in pure metal catalyst and grows to form filament wall at the edge of catalyst [6,11-12]. However, the prior catalyst placed in tube furnace was iron hydroxide (FeOH). This iron hydroxide is needed to reduce to pure catalyst by react with hydrogen [14]. No hydrogen gas was supplied means the hydrogen is mainly obtained from decomposition of PET and HDPE. Based on chemical structure PET ((C10H8O4)n) and HDPE ((C2H4)n), it is believed that the hydrogen supplied by PET is more than HDPE. The catalyst in PET more active compared to the catalyst in HDPE. Thus carbon from PET tends to deposit on catalyst by grow as nanofilament form.
Figure 3: SEM micrograph of carbon nanostructures synthesized from PET at different CVD temperature a) 700ºC, b) 800ºC and c) 900ºC.
The experiment was further carried out to obtain the carbon yield corresponded to the amount of carbon structures deposited on the catalyst. It is observed in figure 4 that the carbon yield of carbon nanostructures synthesized from PET were increased with increasing of reaction temperature from 700 to 900ºC. It is agree with SEM micrograph whereas the diameter of carbon nanofilaments at 800ºC and 900ºC are higher than 700ºC indicating more carbons were deposited to form a thicker filament wall. Furthermore, it is also can be seen in the figure that the carbon yields of samples synthesized from HDPE were drastically higher compared to the samples synthesized from PET. It can be noticed from the SEM micrograph where the carbons were deposited densely on the catalyst and cover up entirely all the catalyst surface. Therefore the amount of carbon deposited from HDPE is as expected excessively higher compare than PET.
a) b)
Figure 4: Carbon yield of carbon structures synthesized from PET and HDPE waste at different CVD temperature.
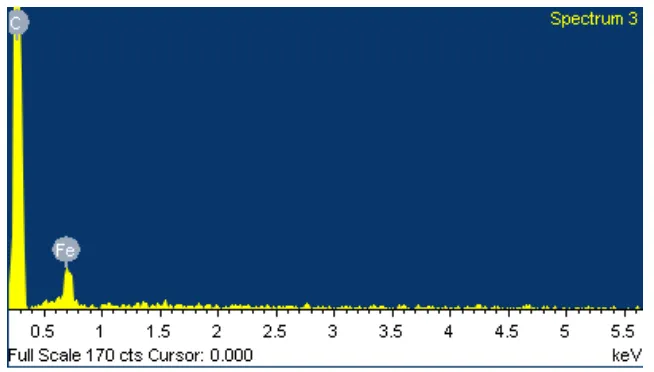
[image:6.595.194.418.563.646.2]Beside the morphological observation, Energy Dispersive X-ray Spectroscopy (EDS) analysis also was carried out on the carbon nanostructure synthesized from PET at 700ºC to trace the existence of carbon element after CVD process. Table 1 shows the EDS results of catalyst. There were 2 main elements were studied; iron and oxygen. The average value of Fe is 76.07%, while the average for Oxides (O) is 23.93%. The existence of oxygen in the catalyst indicated that the catalyst is exists as metal hydroxide (iron catalyst). This metal hydroxide name as catalyst precursor. No carbon element was observed at this stage. However after the CVD process as shown in figure 5, the carbon element is detected in EDS analysis indicating that carbon was synthesized after went through the CVD reaction. The element of iron is still detected representative that the formation of carbon nanostructure was occurred at the catalyst surface. In addition, no oxygen element is detected after CVD process. This is shows that catalyst precursor was converted to pure catalyst before the carbon can diffuse and deposit on top of the catalyst.
Table 1: EDS analysis of iron precursor No of
testing
Percentage Iron (Fe)%
Percentage Oxide (O)%
1 73.69 26.31
2 79.04 20.96
Average 76.07 23.93
0 200 400 600 800 1000 1200 1400
650 750 850 950
Carbon
Yi
el
d
(%)
Temperature
6
Figure 5: EDS analysis of carbon nanostructures synthesized from PET at 700ºC.
4. Conclussion
Carbon structures in nano and micron size were successful produced from HDPE and PET waste by CVD method. The different type of polymer waste was produced different structures whereas the PET tends to produce carbon nanofilaments while HDPE source tends to produce agglomerate carbon ball. The formation of carbon structures also were influenced by temperature reaction. For PET, carbon nanofilament with higher diameter was produced at higher reaction temperature of 900ºC. The carbon yield of carbon nanostructure synthesized from PET was lower than HDPE due to different morphology and formed structures. Finally, EDS analysis was carried out in order to confirm the formation of carbon nanostructures after CVD reaction.
Acknowledgement
I acknowledge Universiti Tun Hussein Onn Malaysia (UTHM) for the short-term grant of this related project.
References
[1] Iijima, S. 1991 Nature. 354(6348) L56
[2] Musatov A, Kiselev NA, Zakharov DN, Kukovitskii EF, Zhbanov AI, Izrael’yants KA and Chirkova EG, 2001 Applied Surface Science. 183(1-2) L111
[3] Zhao X, Ohkohchi M, Wang M, Iijima S, 1997 Carbon. 35(6) L775
[4] Shi Z, Lian Y, HuiLiao F, Zhou X, Gu Z, Zhang Y, Iijima S, Li H, ToYue K, Zhang S, 2000
Journal of Physics and Chemistry of Solids. 61(7) L1031
[5] Iijima S and Ichihashi T, 1993 Nature. 363(6430) L603
[6] Hatta MNM, Xu F. Xia Y and Zhu Y, 2014 Applied Mechanics and Materials. 465 L927 [7] Lee CJ, Lyu SC, Cho YR, Lee JH and Cho KI, 2001 Chemical Physics Letters. 343(1-2) L33 [8] Li WZ, Wen JG and Ren ZF, 2002 Applied Physics A: Materials Science & Processing. 74(3)
L397
[9] Harding KG, Dennis JS, Von Blottnitz H and Harrison STL, 2007 Biotechnology 130(1) L57 [10] Mishra N, Das G, Ansaldo A, Genovese A, Malerba M, Povia M and Sharon M, 2012. Journal
of Analytical and Applied Pyrolysis. 94 L91
[11] Chen J, Xiong X , and Xiao P, 2009 Materials Chemistry and Physics. 116(1) L57