System Dynamics Perspective of the Apps-based
Transportation Ecosystem
Iqbal Yulizar Mukti*, Yudha Prambudia
Department of Industrial Engineering, Widyatama University, Indonesia
Copyright©2019 by authors, all rights reserved. Authors agree that this article remains permanently open access under the terms of the Creative Commons Attribution License 4.0 International License
Abstract Along with the development of ICT,
transportation domain in Jakarta is evolving. The blooming of apps-based transportation has become an interesting alternative transportation mode for the citizens. This mode of transportation is diverting the usage of single occupancy travel to a more occupancy travel, such that it is expected to give positive contributions in reducing the traffic congestion. In this regard, policy intervention to the apps-based transportation ecosystem is being implemented by the government to ensure the conducive situation with the other transportation mode. This study provides an analysis of the policy intervention impact to the traffic congestion in Jakarta. A simulation model capturing the dynamic of the apps-based transportation ecosystem is developed using system dynamic approach. The main aspects considered in the model are including the usage of apps-based transportation, the traffic congestion, and the number of vehicles on the road. The simulation of the model is conducted based on four scenarios of policy intervention, namely, empowering, control, limited, and block. By using the data that are relevant to the situation in Jakarta, the simulation result shows that the traffic congestion level will significantly decline when the policy related to the apps-based transportation is supportive.Keywords
Apps-based Transportation, Traffic Congestion, Simulation, System Dynamics1. Introduction
Traffic congestion is one of the major transportation problems in most of the large cities in the world. According to the research, traffic congestion has significant negative influences on the world’s economy and energy. It calculated that the economical lost due to the traffic congestion is reached $160 billion in the US and €200 billion in Europe. In energy perspective, 0.4747 gallons of fuel were wasted in every hour of the traffic congestion.
Further, the traffic congestion impacts to the loss of 1.9 billion gallons of fuel worldwide.
In particular, INRIX Research ranked Indonesia as the second most congested country in the world. Specifically, as the capital of Indonesia, Jakarta is in the third position in the world ranking of the most congested city. In Jakarta, traffic congestion is negatively affecting the productivity and overall living quality of the citizens. In economical perspective, in 2002, it was estimated that $550 million was wasted because of the traffic congestion in Jakarta.
Aligned with the development of ICT, transportation service in Jakarta is in evolving. It is significantly shown by the blooming of application-based (apps-based) transportation, like Go-Jek, Uber, and Grab. These apps-based transportations, facilitates vehicle owner to become a driver and facilitate people to request a ride as a passenger through the mobile apps. Using the mobile apps, a passenger pointed the origin and the destination of the trip. On the other hand, a driver can decide to pick up and deliver the passenger. Based on the travel distance and the traffic condition, the travel fee will be calculated automatically by the apps.
In 2016, the total number of users of apps-based transportation in Indonesia reached 5.28 million. The number is expected continue to rise with 16% annual growth rate and reach 12.4 million users in 2022 (Statista, 2017). The users prefer to use these apps-based services dues to its convenient and less expensive compare to the traditional taxis. Based on published data, in average the travel cost using apps-based transportation services is around 70% of the travel cost using traditional taxis or private cars.
average, occupancy level of apps-based transportation services is 2 passengers in comparison to only 1 passenger for regular taxis (Ahmadi, et.al. 2017).
Along with the growth of the apps-based transportation users, the trips made by the regular taxis are decreasing. This situation causes resistance from the taxi drivers in the form of strikes, demonstration, and even violence to the apps-based transportation drivers. In order to control the situation, the government set up several policies, in which mainly regulates the price, the coverage area, and the number of vehicle units of the apps-based transportation. These policies have consequences to the usage of apps-based transportation by the users, also to the number of apps-based transportation vehicle on the road, that in the end may impact to the traffic situation. In this regard, this study evaluates the impact of policy intervention on the apps-based transportation ecosystem to the traffic congestion in Jakarta.
Since the apps-based transportation ecosystem is involving wide range of stakeholders and impacting to
several factors that require feedback loops, this study adopts system dynamics approach. The model developed using this approach is to simulate the impact of several policy scenarios related with the apps-based transportation to the traffic congestion level in Jakarta.
2. Model Development
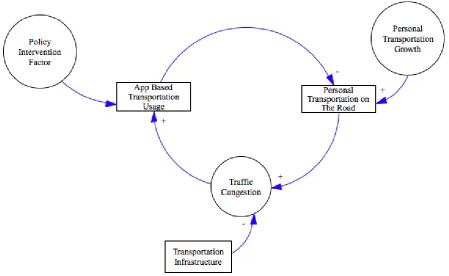
[image:2.595.73.523.337.613.2]As explained in the previous section, apps-based transportation ecosystem can divert the trips made in private single occupancy cars or taxis with more occupancy (Li, Hong, & Zhang, An empirical analysis of on-demand ride-sharing and traffic congestion, 2017). Based on this situation, it is expected that the growth of apps-based transportation usage can reduce the number of personal transportation vehicle on the road, such that, in the end, can contribute to reduce the traffic congestion. In high level, the dynamic of this ecosystem can be summarized in a conceptual model shown in Figure 1.
In the above conceptual model, the usage of apps-based transportation is affected by related policies defined by the government, in which, in this study defined as policy intervention factor (PIF). PIF can increase the usage of apps-based transportation when the policies encourage competitive price compared to regular transportation cost using taxis or private cars, permit sufficient vehicle units, and expand the coverage area of the apps-based transportation vehicles.
2.1. Sub-models
To be able to get more understanding of the apps-based transportation ecosystem in its relationship with the traffic congestion, this study identifies several variables and defines the relevant equations to form a simulation model
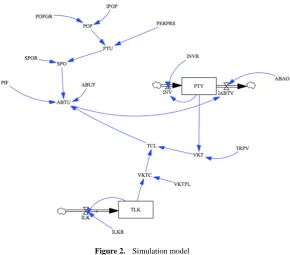
as shown in Figure 2.
[image:3.595.155.446.280.535.2]2.1.1. Apps-based Transportation Usage Sub-model This sub-model reflects the dynamic of the apps-based transportation user growth. This growth is affected by the PIF implemented by the government and smartphone ownership from personal transportation users. In this study, we define four scenarios of the PIF, namely, empowering, control, limited, and block. These scenarios represent the support level of the government in encouraging the apps-based transportation ecosystem to grow. On the other hand, smartphone ownership from personal transportation users is affected by the smartphone ownership growth rate and the number of people who travel by personal transportation. Table 1 listed the variables used in this sub-model.
Figure 2. Simulation model
Table 1. Variables for apps-based transportation usage sub-model
Variables Type Description
Apps-based transportation users (ABTU) Auxiliary Number of app-based transportation users
Policy intervention factor (PIF) Auxiliary Support level from the policies related to the growth of the apps-based transportation ecosystem
Smartphone owner from personal transportation user (SPO)
Auxiliary Number of people who prefer to use a personal vehicle that has a smartphone
Smartphone ownership rate (SPOR) Auxiliary Growth rate of smartphone ownership
Personal transportation users (PTU) Auxiliary Number of people who prefer to use a personal vehicle Percentage of people traveled by personal
transportation (PERPS)
Auxiliary Percentage of people traveled by personal transportation, in which, in the case of this study is a car
[image:3.595.69.523.557.748.2]To be able to execute the simulation, the following are the equations applied in this sub-model.
POP = POPGR * IPOP (1) PTU = PERPS * POP (2) SPO = SPOR * PTU (3) ABTU = PIF * ABUP * SPO * TCL (4) All variables used in the above equations are explained in this sub-model. However, TCL which is traffic congestion level will be explained in traffic congestion sub-model.
2.1.2. Personal Transportation on the Road Sub-model This sub-model illustrates the dynamic of the number of transportation vehicle on the road, related to the apps-based transportation vehicle. As the research limitation, in this study, the transportation vehicle included in the simulation model is a car.
Previous studies related to the apps-based transportation evidenced the decrease of the traffic congestion in urban area. In this regard, several assumptions are used to translate this phenomenon into a simulation model. First, apps-based transportation vehicle will reduce the number of vehicle on the road by having more occupancy. Second, empirical study in the US evidenced that the apps-based transportation vehicle can reduce the car ownership since it has a lower transportation cost. Third, the apps-based transportation is considered to be effective in shifting the
usage of single occupancy private car to a more occupancy vehicle. Lastly, it is evidenced that people tend to drove significantly less after using the apps-based transportation services. Based on the above assumptions, the Table 2 listed the variables used in this sub-model.
To be able to perform the simulation, considering the assumptions for this sub-model, the following are the equations applied in this sub-model.
INV = INVR*PTV (1) IABTV = ABTU / ABAO (2) PTV = PTV + INV – IABTV (3) All variables used in the above equations are explained in this sub-model. However, ABTU, which is apps-based transportation users, explained in apps-based transportation usage sub-model.
2.1.3. Traffic Congestion Sub-model
[image:4.595.68.522.460.592.2]This sub-model depicts the dynamic of the traffic congestion level. In this study, the traffic congestion level is defined as the ratio between the total number of all the trips made by the vehicle in kilometers, to the capacity of the available roads. Further, the measurement unit in calculating this ratio is vehicle kilometers travelled (VKT). VKT is used as the unit of the vehicle trip since it is the standard that can indicate the road density. VKT calculated as the multiplication between the number of all personal transportation on the roads and the average trips of each vehicle. Table 3 listed the variables used in this sub-model.
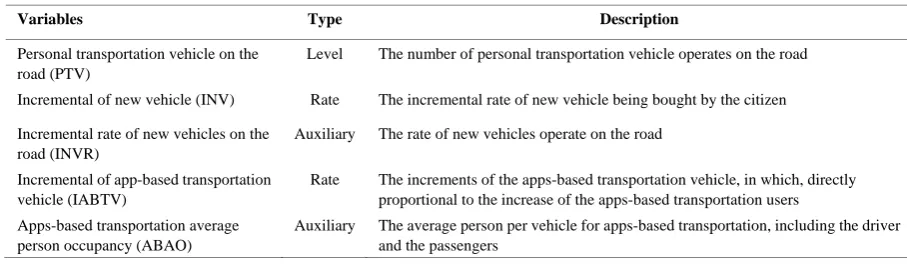
Table 2. Variables for personal transportation on the road sub-model
Variables Type Description
Personal transportation vehicle on the road (PTV)
Level The number of personal transportation vehicle operates on the road Incremental of new vehicle (INV) Rate The incremental rate of new vehicle being bought by the citizen Incremental rate of new vehicles on the
road (INVR)
Auxiliary The rate of new vehicles operate on the road Incremental of app-based transportation
vehicle (IABTV)
Rate The increments of the apps-based transportation vehicle, in which, directly proportional to the increase of the apps-based transportation users Apps-based transportation average
person occupancy (ABAO)
Table 3. Variables for traffic congestion sub-model
Variables Type Description
Traffic congestion level (TCL) Auxiliary The level of traffic congestion on the road caused by personal transportation vehicle Vehicle kilometers travelled (VKT) Auxiliary Total number of kilometers travelled by personal transportation
Average trips per vehicle (TRPV) Auxiliary Average trips per vehicle in kilometers VKT capacity (VKTC) Auxiliary Capacity of all lane in the available roads VKT per lane (VKTPL) Auxiliary VKT of all lane in the available roads
Total lane-kilometers (TLK) Level Total length of all lane of the available roads, measured in kilometers Incremental of lane-kilometers (ILK) Rate The increments of the lane-kilometers of the available roads Incremental lane-kilometers rate
(ILKR)
Auxiliary The rate of the increments of lane-kilometers
To be able to execute the simulation, the following are the equations applied in this sub-model.
TCL = VKT / VKTC (1)
VKT = PTV * TRPV (2)
VKTC = TLK * VKTPL * a (3)
TLK = TLK + ILK (4)
ILK = ILKR * TLK (5) In equation (3), a is the constant representing the average number of lane per road, in which, in this study, it is assumed that in Jakarta the average number of lane per road is two. Further, the traffic congestion level can affect the usage of apps-based transportation. It is indicated that when the traffic congestion level is high, the usage of the apps-based transportation is increasing. Such that, in equation perspective, the traffic congestion has a direct proportion to the apps-based transportation users.
3. Model Simulation
3.1. Parameter Estimation
The system dynamics model proposed in this study, as shown in Figure 2, is simulated using Vensim PLE. By
using the data that are relevant to the situation in Jakarta, the model is executed. Based on the published data, Table 4 listed the values of the parameters needed for the simulation.
3.2. Simulation Scenario
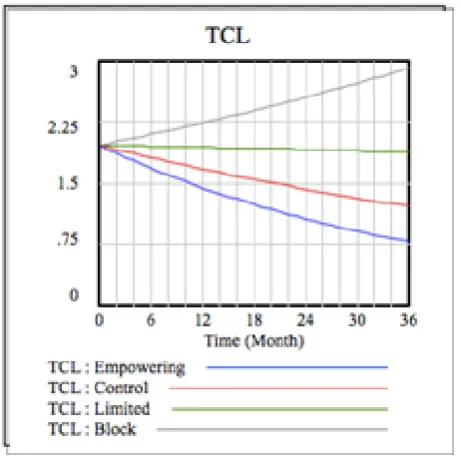
As mentioned in the introduction section, the goal of this study is to simulate the impact of several policies scenarios to the traffic congestion level in Jakarta. To this end, the policy intervention factor (PIF), is used as the control variables. There are four PIF scenarios applied in this simulation, namely, empowering, control, limited, block. The values of each scenarios, respectively are 1.5, 1.0, 0.5, and 0.0. In equations perspective, since the PIF has a direct proportion to the apps-based transportation users, PIF value greater than 1 will increase the apps-based transportation users. However, the opposite happens when the PIF value is less than 1. The simulation model is running for 36 months with monthly time step.
3.3. Simulation Result
Table 4. Parameters values
Parameters Value Unit
Initial population (IPOP) 10,386,613 People Population growth rate (POPGR) – per month 1.00085 - Percentage of people traveled by personal transportation
(PERPS)
0.76 -
Smartphone ownership rate (SPOR) 0.3 - Incremental rate of new vehicles on the road (INVR) –
monthly
0.011 -
Personal transportation vehicle on the road (PTV) – initial value
3,200,000 Vehicles Apps-based transportation average passenger occupancy
(ABAO)
3 Person Average trips per vehicle (TRPV) 55 Km VKT per lane (VKTPL) 3200 VKT Incremental lane-kilometers rate (ILKR) – monthly 0.0000083 -
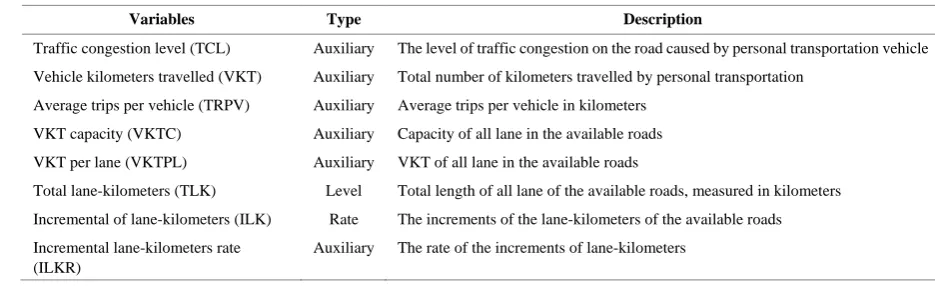
Figure 3. Effect of policy intervention factor to traffic congestion
As illustrated in Figure 3, during the time period, the policy intervention factor shows an effect to the traffic congestion level. The traffic congestion level shows significant decline when the policy intervention factor supportive to the usage of the apps-based transportation. The opposite situation happened in the traffic congestion level when the policy intervention factor is less supportive.
According to the regulation for the apps-based transportation in Indonesia, there are at least three main aspects regulated, namely price, the number of vehicles permitted, and coverage area (Kemenhub RI, 2017). Therefore, supportive policies for the apps-based transportation in these related aspects are expected. However, in setting up the policies, the government should
also consider another mode of transportation that targeting the same market, like the regular taxi, such that the transportation ecosystem as a whole still conducive.
4. Conclusions
This study is attempt to simulate the impact of several policy scenarios related with the apps-based transportation to the traffic congestion level in Jakarta. System dynamics approach is adopted to simulate the scenarios. By using the data that are relevant to the situation in Jakarta, it is found that the traffic congestion level will significantly decline when the policy related to the apps-based transportation is supportive.
However, considering the real case situation, where another mode of transportation is playing a role, like the regular taxi, it is advisable for the government to nurture the apps-based transportation ecosystem by setting up the supportive policies that are also considering the other mode of transportation. This consideration is important to ensure the transportation ecosystem as a whole remains conducive.
[image:6.595.60.291.332.563.2]REFERENCES
[1] Agatz, N., Erera, A. L., Savelsbergh, W. & Wang, X., 2011. Dynamic Ride-Sharing: a Simulation Study in Metro Atlanta. s.l., Elsevier.
[2] Ahmadi, S., Vaziri, S. H., Khaksar, K., Jahani, D., & Ali, M. A. (2017). Microbiostratigraphy and Sedimentary Environment of the Sarvak and Kazhdumi Formations in Bahregansar Oil Field. International Journal of Geography and Geology, 6(5), 113-122.
[3] Anthopoulos, L., 2015. Defining Smart City Architecture for Sustainability. Electronic Government and Electronic Participation, pp. 140-147.
[4] Cookson, G., 2017. INRIX Global Traffic Scorecard, s.l.: INRIX Research.
[5] Djahel, S., Doolan, R. & Muntean, G.-M., 2015. A Communications-Oriented Perspective on Traffic Management Systems for Smart Cities: Challenges and Innovative Approaches. IEEE Communication Surveys & Tutorials, 17(1).
[6] Gaur, A., Scotney, B., Parr, G. & McClean, S., 2015. Smart City Architecture and its Applications based on IoT. s.l., Elsevier, pp. 1089 - 1094.
[7] Ghanbari, A., Alvarez, O. & Markendahl, J., 2016. MTC Value Network for Smart City Ecosystems. Doha, Qatar, IEEE.
[8] Gretzel, U., Werthner, H., Koo, C. & Lamsfus, C., 2015. Conceptual foundations for understanding smart tourism ecosystems. Computers in Human Behavior, Volume 50, pp. 558-563.
[9] Jalali, R., El-khatib, K. & McGregor, C., 2015. Smart City Architecture for Community Level Services Through the Internet of Things. s.l., IEEE, pp. 108-113.
[10]JICA, 2004. The Study on Integrated Transportation Master Plan for Jabodetabek, s.l.: JICA.
[11]Jifeng, W., Huapu, L. & Hu, P., 2008. System Dynamics Model of Urban Transportation System and Its Application. Journal of Transporation Systems Engineering and Information Technology, 8(3).
[12]Lee, D., 2015. Absolute Traffic: Infrastructural Aptitude in Urban Indonesia. International Journal of Urban and Regional Research, 39(2), pp. 234-250.
[13]Li, Z., Hong, Y. & Zhang, Z., 2016. Do On-demand Ride-sharing Services Affect Traffic Congestion? Evidence from Uber Entry. Social Science Research Network. [14]Li, Z., Hong, Y. & Zhang, Z., 2017. An empirical analysis of
on-demand ride-sharing and traffic congestion. s.l., SSRN. [15]Ministry of Transportation RI, 2017. The decree of the
minister transportation of the Republic of Indonesia Number PM 26 Year 2017, s.l.: Ministry of Transportation of The Republic of Indonesia.
[16]Petrolo, R., Loscri, V. & Mitton, N., 2015. Towards a smart
city based on cloud of things, a survey on the smart city vision and paradigms. Transactions on Emerging Telecommunications Technologies, March.pp. 1-11.
[17]Republika, 2017. Republika News. [Online] Available at: http://nasional.republika.co.id/berita/nasional/umum/17/10 /19/oy2tkj409-ini-9-poin-revisi-permenhub-untuk-taks i-daring [Accessed 17 February 2018].
[18]Schrank, D., Eisele, B., Lomax, T. & Bak, J., 2015. 2015 Urban Mobility Scorecard, s.l.: The Texas A&M Transportation Institute and INRIX.
[19]Statista, 2017. statista.com. [Online] Available at: https://www.statista.com/outlook/368/120/ride-sharing/ind onesia#market-users [Accessed 16 2 2018].
[20]TomTom, 2017. TomTom Traffic Index. [Online] Available at: https://www.tomtom.com/en_gb/trafficindex/ [Accessed 1 July 2017].
[21]Vilajosana, I. et al., 2013. Bootstrapping Smart Cities through a Self-Sustainable Model Based on Big Data Flows. IEEE Communications Magazine, 10 June, 51(6), pp. 128-134.
[22]Wandani, F. P., Siti, M., Yamamoto, M. & Yoshida, Y., 2017. Spatial econometric analysis of automobile and motorcycle traffic on Indonesian national roads and its socio-economic determinants: Is it local or beyond city boundaries?. International Association of Traffic and Safety Sciences Research.