Journal of Chemical and Pharmaceutical Research, 2015, 7(4):927-932
Research Article
CODEN(USA) : JCPRC5
ISSN : 0975-7384
Validation of Kayzero/Solcoi software by analysis of reference materials at
Kartini research reactor Yogyakarta-Indonesia
Sri Murniasih
1, Agus Taftazani
1and Roto
21Center for Accelerator Science and Technology-National Nuclear Energy Agency, Jl. Babarsari No. 21 P.O. Box
6101 Yogyakarta, Indonesia
2Department of Chemistry, Faculty of Mathematics and Natural Sciences, Gadjah Mada University, Jl. Sekip Utara
P.O. Box BLS 21 Yogyakarta, Indonesia
_____________________________________________________________________________________________
ABSTRACT
The k0-NAA method is known as one of developing Neutron Activation Analysis (NAA) methods that has many advantages. The aim of this work was to validate the k0-NAA method for neutron activation analysis using the Kayzero run under Windows software package at the CAST – NNEA neutron activation analysis laboratory. Three types of reference material from the US National Institute of Standards and Technology were used to determine the precision and accuracy of the k0-NAA method. The samples were irradiated in Kartini reactor at 100 kW of power level. The element content in Standard Reference Materials (SRM) and the statistical evaluation of the experimental
results were tested by Utest. The analytical results of the reference materials determined by the k0-NAA method are
not significantly different from the certified values. The Utest statistical result, which is to indicate the accuracy,
shows that most elements are within 2. It suggests that the k0-NAA method can be successfully applied at the Kartini reactor.
Keywords: k0-NAA, reference materials, research reactor, Kayzero for Windows software, validation.
_____________________________________________________________________________________________
INTRODUCTION
NAA Laboratory at Center for Accelerator Science and Technology – National Nuclear Energy Agency (CAST – NNEA) is one of the NAA laboratories in Indonesia. This laboratory was established in 1979. Many researches in different disciplines with the relative NAA method have been done. The NAA laboratory in CAST is supported by Kartini research reactor, which has two operating systems (rotary rack and Pneumatic). The reactor is operated at 100 kW of power, produces 5.97.1012 n.cm-2s-1 of thermal neutron flux and 5.59.1012 n.cm-2s-1 of fast neutron flux at central thimble. The reactor uses two loop cooling system (primary and secondary) for transferring the heat. A rotary rack is located at the top of the core inside the reflector and contains 40 irradiation positions.
The relative NAA method has been used in the NAA – CAST laboratory. This method is a standard method, used for daily work such as internal and external costumer’s analytical services. In the relative method, the unknown sample is irradiated together with a standard or a reference material containing a known amount of the element of interest. The standard or reference material is measured under the same conditions with the sample. This method is still regarded as one of methods. That has the highest accuracy. However, it was not suitable for multi-element analysis with many samples [1]. Moreover, the relative method gives relatively more radioactive waste than using of secondary standard. It does not support the Green Chemistry program which now widespread major project.
method [1]. The k0-NAA standardization, which was originally proposed by Simonits et al. [2-4], includes the simultaneous co-irradiation of the sample and a comparator nuclide such as 197Au. Accurate knowledge is needed for determining the concentration levels in the sample such as the neutron flux parameters of the irradiation position, k0-factors, and the detection efficiency for the specific activities of the nuclides in the sample and monitor [1,5,6]. Many NAA laboratories in the world have implemented k0-NAA method. Recently, NAA Laboratory in Řezˇ [6] and NAA laboratory in Egypt [1] have implemented the k0-NAA method.
Based on the many advantages of the k0-NAA method, NAA-CAST laboratory try to develop this method as an analysis method that can be used for daily analyses. The purpose of this research is to develop the k0-NAA method using Kartini research reactor at rotary rack facility (LS-5) and validate the application of such methods.
EXPERIMENTAL SECTION
Materials
In this study, materials used to experiment were NIST 8702, Buffalo River Sediment; NIST 1632c, Trace Elements in Coal, NIST 1648a, Urban Particulate Matter, Al-Au 0.1003±0.0012% foil IRMM-530R; Zr 99.8+% foil Good Fellow with 0.125mm of thickness; Al-Lu 0.1% foil IRMM-sp96091; Al-U 0.2% foil with 99.9520% 238U IRMM-NS00017; Al-Co 0.1043±0.0014% foil, Zn 99.98% foil Reactor Experiment Inc, cylindrical polyethylene, HDPE-C20 cladding and multiple point sources such as 133Ba, 60Co, 137Cs, 241Am, 226Ra, 152Eu, 57Co and 22Na.
Instrumentation
Instrumentation was the main supporting system to develop the experimental set up. It divided into two part, hardware and software. Hardware consist of Kartini research reactor, gamma spectrometer with HPGe detector GEM35P4-83, MCA 8K and Pb shielding. Software used consists of Genie 2000 software, DosBox software, HYPERMET-PC program, and KAYZERO/SOLCOI® software.
Procedure
The detection efficiency measurement of gamma spectrometer
A gamma spectrometer with a coaxial HPGe detector (ORTEC ©, model GEM35P4-83) of crystal length 49.2 mm, diameter 66.2 mm, relative efficiency of 35%, and resolution of 1.89 keV for Co gamma ray at 1332.5 keV was used for the measurement, MCA 8K and Genie 2000 software were needed to measure the detection efficiency. Energy peak efficiency of detector was determined using the standard source that emitted gamma rays. In the analysis, this source represented the range of energy required from low to high. The sources consist of 133Ba, 60Co, 137Cs, 241Am,
226Ra, 152Eu, 57Co and 22Na. They were measured at a certain distance and time in order obtained 10,000 counts
minimal. Then, it was created efficiency versus energy curve. The effect of true coincidence correction was performed using the standard source that emitted single energy gamma ray.
The determination of ƒ and α parameters
The determination of ƒ (thermal to epithermal flux ratio) and α (epithermal flux deviation from the ideal (1/E) distribution) parameters was performed using the multi monitor Cd-ratio method. Thin foil alloys were used to minimize self-shielding effects such as Al-Au 0.1003±0.0012% foil IRMM-530R; Zr 99.8+% foil Good Fellow with 0.125mm of thickness; Al-Lu 0.1% foil IRMM-sp96091; Al-U 0.2% foil with 99.9520% 238U IRMM-NS00017; Al-Co 0.1043±0.0014% foil and Zn 99.98% foil Reactor Experiment Inc. with 0.254mm of thickness. Irradiation was performed in the LS-5 position for 6 hours with bare and Cd-covered samples which was not rotated during the irradiation. Both Zr and Au monitors were measured in reference distance (10 cm) after 2–4 days of irradiation. The Zr monitor was re-measured after 5–8 days of the first measurement in the distance between samples with the lowest end-cap detector. It is same with other monitors. The following results were obtained: ƒ = 13.713 ± 0.066 and α = 0.0534 ± 0.0104. In this way, the ƒ and α values were obtained using element contents calculation [7].
The determination of elements in reference materials
Three types of standard reference materials (SRM) were chosen for validating the k0-NAA method. They are NIST 8702 (Buffalo River Sediment), NIST 1632c (Trace Elements in Coal) and NIST 1648a (Urban Particulate Matter) made in the US National Institute of Standards and Technology (NIST SRMs). 100 mg of standard reference materials were placed in clean cylindrical polyethylene (PE) vial with 0.3 ml of capacity and 6.4 mm of diameter. Sample, monitor and blank are included in the C20 HDPE cladding to irradiation. Irradiation was carried out in Kartini research reactor at and operated at 100 kW of power. Irradiation time for medium and long life elements are 6 hours and 12 hours, respectively.
______________________________________________________________________________
of relative efficiency, 1.89 keV of resolution FWHM for the 1332.5 keV photons of 60Co, 50:1 of peak-to-Compton ratio. The counting times and geometry were selected according to sample activities and half-lives of present radionuclides after decay times. They were chosen to determine as many elements as possible with a low uncertainty [6,8]. The counting of standard reference materials was performed at 2–25 days of different cooling times. The counting times were varied from 1000 to 4000 seconds at such certain distances so that the dead time of counting was kept below 10%. The HYPERMET-PC program was used for evaluating peak area. The evaluation’s result from will be used as an input of Kayzero for Windows program, because Kayzero for Windows program was applied using net peak area (*.PTF) and spectrum (*.SPE) files [8-9].
The k0-NAA is a multi element analytical to determine element based on the different gamma energy peak. The calculations of the thermal to epithermal neutron flux ratio (ƒ) and epithermal neutron flux shape factor (α) were performed using the equation described Kubeˇsova [6]. These parameters presented the characteristic condition for each of irradiation channel in the reactor. Their results will influence the accuracy of k0-NAA. Other parameters in the mass fraction, such as the k0 and Q0 factors, presented by equation 1 [11] as recommended values.
= , ƒ , ,
ƒ , , 10
# (1)
where:
ρ = mass fraction; $ = analyte; Np = net peak area count; tm = counting time (s); S = 1 − e −λtd
= saturation factor; D = 1 − e−λtd = decay factor; C = 1 − e−λtd / λtm = counting factor; w = mass (g); Au = neutron flux monitor Au (single
comparator); α = epithermal neutron flux shape factor; εp = full energy peak detection efficiency; ƒ = neutron flux
thermal to epithermal ratio.
The accuracy of the analytical measurements obtained using k0-NAA was estimated via the Utest in equation 2: %&'(& =)*+, -* ./)
01+,2 12./
(2)
where:
xexp = the experimental of result value of analytes in the control sample; σexp = the experimental standard deviation
of analytes in the control sample; xSRM = the certified value of analytes in the control sample; and σSRM = the
certified standard deviation value of analytes in the control sample [10,11].
RESULTS AND DISCUSSION
The detection efficiency measurement of gamma spectrometer
First, gamma spectrometer must be calibrated before perform the analysis. The calibration of a HPGe detector such as the determination of the peak-to-total ratio, the fine-tuning technique and full-energy peak detection efficiency for the source-detector (εp). They were also carried out, but this work only focuses on the εp determination. The peak
efficiency is a function of the gamma energy of the photons that interact with the detector [12]. In the present work, high purity germanium detector GEM35P4-83 (ORTEC, 35% relative efficiency) connected to Genie PC (CANBERRA) software. The detector was calibrated and the efficiency curve was fitted using several suitable absolutely calibrated point sources such as 133Ba, 60Co, 137Cs, 241Am, 226Ra, 152Eu, 57Co and 22Na. The point source was made by the Isotope Products Laboratories Co. The experimental reference curves were obtained at a source-detector distance of 25 cm. It means when distance between source with source-detector was 25 cm, true-coincidence effects were negligible on these measurements [12]. Based on theory, the efficiency calibration curve of gamma ray cannot be expressed in one polynomial equation. This curve is usually divided into three energy regions: bellow 100 keV; 100-1000 keV and above 1000 keV [12].
In this research, the calculation of detector efficiency measurement was done manually using Excel program with logarithmic scale. It was obtained the efficiency calibration curves as shown in Fig. 1a. The obtained data was fitted using KAYZERO/SOLCOI® software and obtained the efficiency calibration curves as shown in Fig. 1b. The fitting result was obtained polynomial equation which consist of three energy regions. First energy region 40-200 keV with the equation is log(εp) = -42.601 + 46.585 log(Eγ) - 17.626 log(Eγ)2 + 2.152 log(Eγ)3. Second energy region
200-1150 keV with the equation is log(εp) = 0.081 - 1.109 log(Eγ). Third energy region 1150-3500 keV with the
.
(a) (b)
Figure 1. (a). The efficiency calibration curves for detector GEM35P4-83 was done manually using Excel program (b) The fitting result
of efficiency calibration curves for detector GEM35P4-83 using KAYZERO/SOLCOI® software
The determination of elements in reference materials
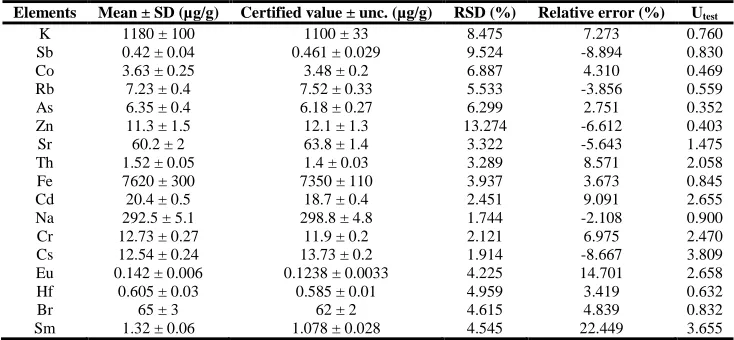
[image:4.595.78.536.63.262.2]Qualitative analysis of the k0-NAA method is same with the relative NAA. The identification of element content in sample was performed by the characteristics of gamma rays emitted by the elements nuclides. In Figure 2, the spectrum of measurement results for NIST 8702 Buffalo River Sediment presented two different decay times to determine content of various elements in a sample. The radionuclides were used to determine the elements with their half-lives and gamma-energies and presented in Table 1.
Table 1. Analytical condition of the three standard reference materials
Samples Irradiation time
(hour)
decay time (day)
counting time
(second) Nuclides detected
NIST 8702 2×6 6 18-25 2-5 1000 3000
42K, 24Na
59Fe, 124Sb, 115Cd, 51Cr, 134Cs, 60Co, 152Eu, 181Hf, 233Pa
NIST 1632c
6 2×6
2-5 15-25
2000 4000
42K, 24Na, 76As, 82Br, 153Sm
124Sb, 60Co, 86Rb, 65Zn, 85Sr, 233Pa, 59Fe, 115Cd, 51Cr, 134Cs,
152Eu, 181Hf
NIST 1648a
6 2×6
2-5 12-26
1500 3600
140La, 76As, 42K, 24Na, 82Br, 153Sm
115
Cd, 60Co, 51Cr, 59Fe, 86Rb, 85Sr, 65Zn, 134Cs
Figure 2.Gamma-spectra of NIST 8702 Buffalo River Sediment presented in the two different decay time (Td); Td = 3 days (a); Td = 15
days (b)
The radionuclides were used to analyze of three SRM and their gamma energy were measured results presented in 1.0E-04
1.0E-03 1.0E-02
10 100 1000 10000
E
ff
ic
ie
n
cy
[image:4.595.66.548.390.707.2]______________________________________________________________________________
other gamma energy and have a relatively greater probability. The results of qualitative analysis shown that there are many detected elements in the NIST 8702, NIST 1632c and the NIST 1648a such as 11 elements 17 elements and 14 elements respectively. Quantitative analysis to determine elements in the SRMs was performed using the k0-NAA method. Tables 3 to 5 show the analytical results of the three SRMs using the k0-NAA method.
[image:5.595.191.420.228.408.2]As presented in Table 3 to 5, 11 detected elements in the NIST 8702 (Buffalo River Sediment) have relative errors within 10%, except for Co and Cs. In the NIST 1632c (Trace Elements in Coal), 2 of 17 detected elements (Eu and Sm) have relative errors exceed 10%. In NIST 1648a (Urban Particulate Matter), 14 elements were detected and most of them have relative error within 10%, except for Co and Sm. The statistical evaluation of the k0-NAA method such as accuracy and precision was performed. The U-test can be used appropriately for the accuracy evaluation and defined by equation 2.
Table 2. Nuclear data for the nuclides used in the analysis
Elements Nuclides Half-live (hours) Eγ (keV)
K 42K 12.36 1524.7
Sb 124Sb 1444.8 602.7; 722.8; 1691.0
Co 60Co 46165.2 1173.2; 1332.5
Rb 86Rb 447.84 1076.60
Na 24Na 14.96 1368.6
Sr 85Sr 1556.16 514.00
Th 233Pa 648 312.01
Zn 65Zn 5853.6 1115.5
Fe 59Fe 1068 1099.2; 1291.6
As 76As 26.32 559.1; 657.1
Br 82Br 35.3 698.4; 776.6; 1044.0
Cd 115Cd 53.46 527.91; 336.26
Cr 51Cr 664.8 320.1
Cs 134Cs 18045.6 569.3; 604.7; 795.8
Eu 152Eu 116508 964.9; 1112.1; 1408.1
Hf 181Hf 1017.36 133.0; 345.9; 482.2
Sm 153Sm 1110.48 69.67; 103.18
[image:5.595.122.489.436.551.2]La 140La 966.48 328.8; 815.8; 1596.5
Table 3.Analytical results (µg/g) of NIST 8702, Buffalo River Sediment by the k0-NAA method
Elements Mean ± SD (µg/g) Certified value ± unc. (µg/g) RSD (%) Relative error (%) Utest
K 19810 ± 500 20010 ± 410 2.524 -1.000 0.309
Sb 3.32 ± 0.46 3.07 ± 0.32 13.855 8.143 0.446
Co 14.95 ± 0.6 13.57 ± 0.43 4.013 10.169 1.869
Th 8.7 ± 0.17 9.07 ± 0.16 1.954 -4.079 1.585
Fe 40020 ± 1500 39700 ± 1000 3.748 0.806 0.178
Cd 3.22 ± 0.31 2.94 ± 0.29 9.627 9.524 0.660
Na 5470 ± 200 5530 ± 150 3.656 -1.085 0.240
Cr 110.54 ± 5.2 121.9 ± 3.8 4.704 -9.319 1.764
Cs 6.78 ± 0.4 5.83 ± 0.12 5.900 16.295 2.275
Eu 1.28 ± 0.05 1.31 ± 0.038 3.906 -2.290 0.478
Hf 9.1 ± 2.7 8.4 ± 1.5 29.670 8.333 0.227
Table 4.Analytical results of NIST 1632c, Trace Elements in Coal by the k0-NAA method
Elements Mean ± SD (µg/g) Certified value ± unc. (µg/g) RSD (%) Relative error (%) Utest
K 1180 ± 100 1100 ± 33 8.475 7.273 0.760
Sb 0.42 ± 0.04 0.461 ± 0.029 9.524 -8.894 0.830
Co 3.63 ± 0.25 3.48 ± 0.2 6.887 4.310 0.469
Rb 7.23 ± 0.4 7.52 ± 0.33 5.533 -3.856 0.559
As 6.35 ± 0.4 6.18 ± 0.27 6.299 2.751 0.352
Zn 11.3 ± 1.5 12.1 ± 1.3 13.274 -6.612 0.403
Sr 60.2 ± 2 63.8 ± 1.4 3.322 -5.643 1.475
Th 1.52 ± 0.05 1.4 ± 0.03 3.289 8.571 2.058
Fe 7620 ± 300 7350 ± 110 3.937 3.673 0.845
Cd 20.4 ± 0.5 18.7 ± 0.4 2.451 9.091 2.655
Na 292.5 ± 5.1 298.8 ± 4.8 1.744 -2.108 0.900
Cr 12.73 ± 0.27 11.9 ± 0.2 2.121 6.975 2.470
Cs 12.54 ± 0.24 13.73 ± 0.2 1.914 -8.667 3.809
Eu 0.142 ± 0.006 0.1238 ± 0.0033 4.225 14.701 2.658
Hf 0.605 ± 0.03 0.585 ± 0.01 4.959 3.419 0.632
Br 65 ± 3 62 ± 2 4.615 4.839 0.832
[image:5.595.122.489.580.750.2]The accuracy of the experimental results that was evaluated using the k0-NAA method in our system shows that these results are close to the certified values. The results of the NIST 8702 (Buffalo River Sediment) show that all results are satisfactory according to | U-test | ≤ 2 criteria, except for Cs with a questionable result. The results of NIST 1632c (Trace Elements in Coal) show that all results are satisfactory according to this criteria, except for Th, Cd, Cr, Eu with a questionable result and Cs, Sm with a less satisfactory. The results of NIST 1648a (Urban Particulate Matter) indicate all results are satisfactory according to this criteria, except for Na and Co with a questionable result.
Table 5.Analytical results of NIST 1648a, Urban Particulate Matter by the k0-NAA method
Elements Mean ± SD (µg/g) Certified value ± unc. (µg/g) RSD (%) Relative error (%) Utest
K 10920 ± 1000 10560 ± 490 9.158 3.409 0.323
La 42.8 ± 4.48 39 ± 3 10.467 9.744 0.705
Co 20.87 ± 0.82 17.93 ± 0.68 3.929 16.397 2.760
Rb 46.8 ± 2.3 51 ± 1.5 4.915 -8.235 1.530
As 121.75 ± 4.71 115.5 ± 3.9 3.869 5.411 1.022
Zn 4970 ± 290 4800 ± 270 5.835 3.542 0.429
Sr 194 ± 27 215 ± 17 13.918 -9.767 0.658
Fe 40000 ± 4400 39200 ± 2100 11.000 2.041 0.164
Cd 69 ± 2.45 73.7 ± 2.3 3.551 -6.377 1.399
Na 4450 ± 70 4240 ± 60 1.573 4.953 2.278
Cr 372 ± 14.68 402 ± 13 3.946 -7.463 1.530
Cs 3.13± 0.38 3.4 ± 0.2 12.141 -7.941 0.629
Br 525 ± 18 502 ± 10 3.429 4.582 1.117
Sm 4.8 ± 0.6 4.3 ± 0.3 12.500 11.628 0.745
CONCLUSION
The k0-NAA method was successfully implemented at the CAST, Yogyakarta and applied for elemental analysis of three selected reference materials using Kartini reactor. The LS-5 position of rotary rack facilities in Kartini reactor was selected in this work, which was not rotated during irradiation. This work aims to validate the k0-NAA and analytical procedure method using NIST 8702 (Buffalo River Sediment), NIST 1632c (Trace Elements in Coal) and NIST 1648a (Urban Particulate Matter). The analytical results of three reference materials using the k0-NAA method show that the results are not significantly different from the certified values of each reference. The Utest
statistical result, which indicates the accuracy of the result, shows that most elements are within 2. This proves that the k0-NAA method can be implemented using Kartini reactor for analysis of samples.
Acknowledgements
The authors would like thank to all reactor staff for their cooperation. Thanks to Mr. Sutanto and all NAA – CAST laboratories staff for their field technical aids.
REFERENCES
[1]M Soliman; NMA Mohamed; MA Gaheen; EA Saad; SK Yousef; MA Sohsah, J Radioanal Nucl Chem, 2011, 287, 629–634.
[2]MABC Menezes; R Jac´imovic´, Applied Radiation and Isotopes, 2011, 69, 1057–1063. [3]HT Phuong; MV Nhon; LDH Oanh, Applied Radiation and Isotopes, 2012, 70, 478–482. [4]MJJK Ammerlaan; P Bode; AJM Winkelman, J Radioanal Nucl Chem, 2012, 291, 569–572. [5]MO Adeleye; YV Ibrahim; PK Kilavi, International Journal of Science and Technology, 2014, 3(3).
[6]M Kubeˇsova´, Dissertation, Faculty of Nuclear Sciences and Physical Engineering, Czech Technical University, Prague, 2012.
[7]S Murniasih; Roto; A Taftazani; T Rina; Sutisna, J. Tek. Reaktor Nuklir, 2014, 16(2), 100-108.
[8]M Kubeˇsova´; J Kucˇera, Nuclear Instruments and Methods in Physics Research A, 2010, 622, 403–406. [9]P Makreski; G Jovanovski; T Runčevski; R Jaćimović, Macedonian Journal of Chemistry and Chemical
Engineering, 2011, 30(2), 241–250.
[10]HM Dung; MC Freitas; M Blaauw; SM Almeida; I Dionisio; NH Canha, Nuclear Instruments and Methods in
Physics Research A, 2010, 622, 392–398.