Journal of Chemical and Pharmaceutical Research, 2015, 7(4):1215-1221
Research Article
CODEN(USA) : JCPRC5
ISSN : 0975-7384
E/Z-Iminol Conformational behavior of the substituted formohydroxamic:
A DFT study
Abdulhakim A. Ahmed
Department of Chemistry, Faculty of Science, University of Benghazi, Libya
_____________________________________________________________________________________________
ABSTRACT
The Z/E iminol forms formohydroxamic acids (HX(OH)NHOH where X=C, Si, Ge, Sn and Pb) have been investigated in the gas phase using B3LYP density functional theory at B3LYP/6-31++G(d,p) level of theory.The barrier to the rotation of Z to the more stable isomer E is significant in C, Si and Ge structures, whereas in Sn and Pb the Ztautomer is more stable than E. The highest energy point is TS1-2, which lies 46.35 kcal/mol above the E
isomer 2.The rate constant for tautomeric interconversion lies between 5.62×10⁻¹⁴ and 2.23×10⁹ s-1. The 3→4
interconversion exhibits the highest rate constant for the tautomeric interconversion. The equilibrium constant for interconversion of tautomer 1 to 2 is 4.45×10⁶. The solvent effect on formohydroxamic acid showed that the ∆G
1-2values are 0.37, 0.70, 0.58, 0.85, 1.97 and -9.07 kcal/mol, in DMSO, methanol, acetone, THF, cyclohexane and in
gas phase respectively.
Keyword: Electronic structure, formohydroxamic acids, solvent effect, thermodynamic and kinetic parameters.
_____________________________________________________________________________________________
INTRODUCTION
Hydroxamic acids are hydrophilic organic compounds that can exhibit keto-iminol tautomerizm, and both tautomers may exist as Z or E diastereomers. The pKa value of a molecule determines the relative concentration of its protonated and deprotonated forms at a specific pH, most drugs contain at least one site that is able to protonate or deprotonate reversibly [
[1]
]. The kinetic of the acid hydrolysis of formohydroxamic and acetohydroxamic acids in nitric acid to form hydroxylamine and the parent carboxylic acid have been determined [[2]
]. The structure and the deprotonation of the derivatives of these compounds have been the subject of several theoretical investigations [[3]
-[5]
]. Many hydroxamates exhibit metalloproteinase inhibition activity [[6]
-[7]
]. Earlier theoretical calculations have been shown that the substitution of the central carbon atom with the silicon in formohydroxamic acid significantly influences the structure and acidity by comparison with parent molecule [[8]
]. The aim of this work is to provide structural, kinetic and thermodynamic propertiesfor substituted iminol formohydroxamic acid using high level theoretical calculations. Additional interests are the molecular geometries, activation barrier and how these properties change upon isosteric substitution of carbon atom formohydroxamic acid molecule by silicon, germanium, tin and lead atoms.2. The Methodology section
(ε=32.63), acetone(ε=20.49), Tetrahydrofuran (THF) (ε=7.43), and cyclohexane(ε=2.02) were used as solvents. The equilibrium (Keq) and the rate (k) constants of the reactions were calculated using the computed Gibbs free energies.
The electrophilicity index (ω) which is a measure of the energy stabilization of a given molecule when it gains an amount of electron density. Parr and coworker [[14]] have defined the global electrophilicity power of a system in terms of its chemical potential and chemical hardness as follows:
= 2
Where µ is the chemical potential and η is the absolute hardness.
The calculations were performed using Gaussian09 package [[
15]
]. The visualizations of the structures were performed with the program ChemCraft 1.7 (Build 375) [[16]
].RESULTS AND DISCUSSION
3.1The geometries
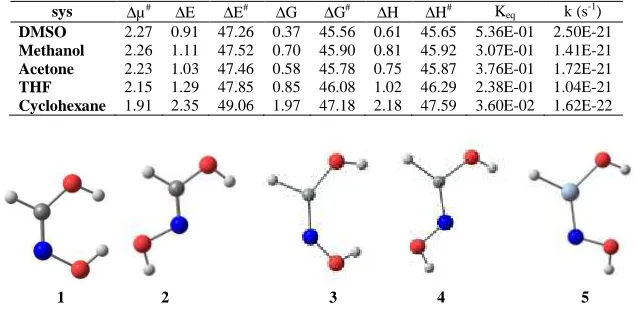
The calculations investigate the relative stabilities of the various isomeric forms of foromhydroxamic acid (HX(OH)NHOH where X=C, Si, Ge, Sn and Pb) and the reaction paths leading from Z to E tautomer. Ten local minima of Z and E tautomers 1-10 were located along with five transition structures (TS1-2to TS9-10) that connect these minima Z/E conformation. The local minima structures are presented in Figure 1.The bond lengths and bond order from the full optimized geometry of the minima structures are given in Table1.The Z and E tautomers for the formohydroxamic acid are planar, whereas the others are not. It is notable that as the central atom becomes heavier the planarity is reduced. As expected the N-O bond length is increased as the central atom becomes heavier thus the N-O of the lead structure 9 has the lowest N-O bond length (1.32 Å).The charge distribution of the structures in the gas phase has been examined using calculated Mulliken charges. Mulliken atomic charges for the minima structures and the dipole moments obtained are shown in Table 2. The data reveals that the central atoms (apart from carbon) acquire positive charges. N and O acquire negative charges; whereas the hydrogen atoms attached to the carbon and the remaining hydrogen are positively charged. The result suggests that the atoms bonded to nitrogen or oxygen atoms are electron donors, and that charge transfer from hydrogen to oxygen or nitrogen is significant. The tin structure 7 has the most negative oxygen charge (-0.629) and the silicon structure 4 has the most negative nitrogen charge (-0.756). Structures 10, 9 and 3 have the largest dipole moments in the gas phase (4.01 D, 3.85 D and 3.80 D respectively). The dipole moment of 5 was the lowest (0.74 D).
1 (Z) 2 (E)
TS
1-2= C, Si, Ge, Sn and Pb
Scheme 1
3.2The energy analysis
The transformation of the Z to E tautomers and the transition states is plotted schematically in Figure2. All transition states have been confirmed by vibrational analysis and by the corresponding imaginary frequencies. The energies of structures are reported relative to E tautomer in each case. The barrier to the rotation of Z to the more stable isomer,
E is significant in C, Si and Ge structures, whereas in tin and lead the Z tautomer is more stable than E is reverse. It
_____________________________________________________________________________
the previously reported results [[
17]
-[18]
]. In transformation of Z to E, the 1-TS1-2-2,3-TS3-4-4and 5-TS5-6-6 are exothermic steps with enthalpies change (∆H) of -8.52, -4.52 and -4.56 kcal/mol respectively. The remaining steps (7-TS7-8-8, 9-TS9-10-10) are endothermic with positive ∆H of 1.33 and 1.44 kcal/mol respectively. The LUMO separation (Table 1) has been used as a simple indicator of kinetic stability. Indeed the largest HOMO-LUMO gap (6.73 eV) is found for 2structure, whereas 9 has the lowest gap (2.61 eV). This difference in the energy gap is largely due to a relative stabilization of the LUMO, which is at -0.2348 and -3.7677 eV assigned to2 and 9 respectively.3.3 Thermodynamic and kinetic study
In the gas-phase the Gibbs free energy difference (∆G) between structures lies between -9.07 and1.76 kcal/mol for forward reactions. These data correspond to the ∆G1-2and ∆G9-10 respectively; this is expected because carbon tautomers are the most stable. The equilibrium constants of tautomeric transformations were calculated using the standard equation
=
∆
Where∆G is the relative total Gibbs free energy of the reactant and product, T is the temperature, and R is the universal gas constant. Standard transitional state theory [[19]-[20][20]] was employed to estimate the rate constant as follows:
= ( ℎ)
∆ #
Where ∆G# is the activation Gibbs free energy of the reaction, T is the temperature, kb is Boltzmann’s constant, h is Plank’s constant, and R is the universal gas constant. The activation parameters along with the equilibrium and rate constants are listed in Table 4. The equilibrium constant for interconversion of tautomer 1 to 2 at B3LYP/6-31++G(d,p) level is4.45×106, In accordance with ∆G between tautomers. In the tautomeric interconversion the 4 and 6arefound to be the major tautomers (positive keq) in the 3→4 and 5→6reactions respectively. In contrast the tautomers 8 and 10 are found to be the insignificant tautomers (very low keq) in the 7→8 and 9→10 reactions respectively. The equilibrium and rate constant of tautomerism interconversion at is given in Table 3. These data showed that the ∆G between TS of the tautomers (∆G#) lies in the range of 4.70and35.53 kcal/mol. Moreover, the rate constant for tautomeric interconversion lies between 5.62×10⁻¹⁴and 2.23×10⁹S-1. The 3→4 interconversion exhibitshigh rate constant for the tautomeric interconversion. The remaining low values of the rate constant indicate that no tautomeric conversion can occur at room temperature in the absence of catalyst or solvent assistance.
3.4 Solvent Effect
Experimental investigations on the structure of formohydroxamic acid using X-ray [[21]] and NMR [[22]] confirmed that the most stable structure is E-keto in crystalline form and Z-keto in solution, so it is interesting to look at the solvent effect on the iminol forms. The Z/E tautomerism of the simplest formohydroxamic acid (1-TS1-2
-2) has been analyzed further in different solvents. The three structures were reoptimzed in five different solvent. The
study of equilibrium and rate constant in solvent, free energy of tautomers and transition state were calculated using DMSO, Methanol, acetone, THF and cyclohexane as solvents. The major purpose from considering solvent effect is simulation of real system and determination of differences between the gas phase and solvated systems. The data shows that the11.96 kcal/mol value is the difference between the highest Gibbs free energy (2 in cyclohexane) and the lowest (1 in DMSO) of the tautomers, Table 4. In addition, by increasing of the polarity of the solvent theGibbs free energy is decreased. In 6→7transformation the DMSO provides the highest equilibrium constants (0.536) which
are still lower than the gas phase value of 4.45×10⁶. This huge shift towards lower equilibrium constant in solvents is attributed to the intramolecular hydrogen bonding. The tautomers interconversions in all solvents are afforded positive∆G. There is no obvious trend in the equilibrium constant in comparison with the solvent dielectric constant. One can conclude that the lower the dielectric constant of the solvent, the higher the barrier to the conformation process. The dipole moment value of tautomers correlates very well with the fact that the structure with the smaller dipole moment is always more stable, it is clear that the bulk of solvents stabilizing the tautomer with the lower dipole moment (Z tautomer).
which is far from the gas phase rate constants (maximum: 5.62×10⁻¹⁴ s-1) which is also extracted for the same 1→2
equilibria. An electron resonance involving the N=C-O bonds is possible, which should stabilized the electron pairs on oxygen atom. This resonance region is clearly affected by the solvents, for example, the C-O bond length in cyclohexane decreases to 1.395Å from 1.401Å in higher dielectric solvent (DMSO) and its stretching frequency also increases by 36 cm-1. The strong interaction nN3→σ
*
C1−O2 is effected by the polarity of the solvent, since the values
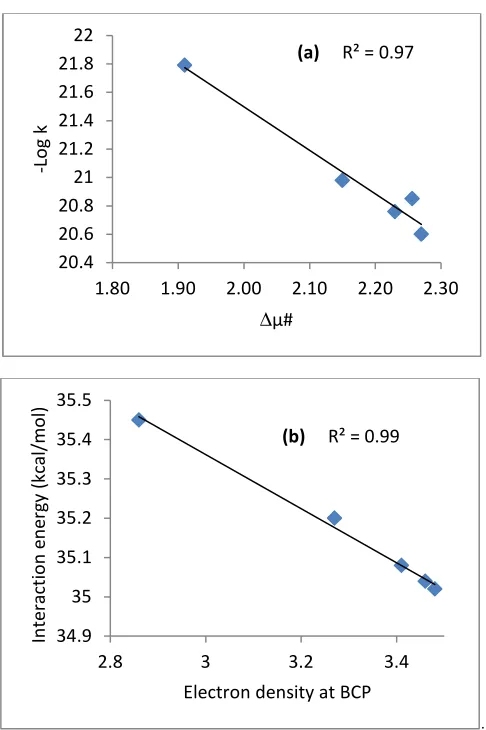
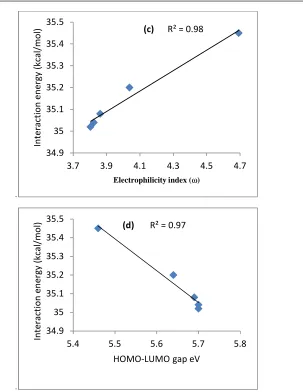
of electron density for C1-O2 bond decreases with solvent polarity. This decrease in electron density at the bond critical point (BCP) can be due to the decrease of interaction energy with the increase of C1-O2 bond length at TS1-2. A linear correlation has been found between the interaction energy of the TS1-2 (C1-O2) and the three other parameters namely the electron density at BCP, electrophilicity index (ω) and dipole moment Figure 3. The dipole moment of the TS1-2decreases as the polarity of the solvent increased, subsequently, the dipole moment of 3.48 and 2.86 D is extracted in DMSO and cyclohexane respectively. The activation dipole moment has similar trend. A linear correlation has been found between the activation dipole moment and the rate constant in different solvents.
Table 1: Geometrical parameters of the molecules, bond length (Ǻ), diple moment (Debye) and HOMO-LUMO gap (eV)
System X-O X-N X-H N-O O-H (X) O-H (N) µ H-L
1 1.359 1.272 1.082 1.398 0.964 0.970 2.94 5.97
2 1.347 1.268 1.082 1.398 0.964 0.970 0.91 6.73
3 1.653 1.605 1.458 1.390 0.961 0.966 3.80 4.79
4 1.641 1.620 1.470 1.417 0.963 0.963 0.87 4.92
5 1.787 1.744 1.517 1.424 0.965 0.964 0.74 3.97
6 1.780 1.748 1.529 1.424 0.965 0.964 0.92 4.11
7 1.964 1.986 1.704 1.366 0.961 0.969 2.31 2.96
8 1.951 1.986 1.714 1.374 0.961 0.968 2.31 2.94
9 2.063 2.166 1.775 1.320 0.962 0.975 3.85 2.61
10 2.048 2.162 1.782 1.330 0.963 0.974 4.01 2.62
Table 2: The Mulliken atomic charges of the molecules
Sys. qX qN qHX qO(N) qO(X) qH (XOH) qH (NOH)
1 -0.144 -0.171 0.197 -0.089 -0.197 0.226 0.177
2 0.005 -0.317 0.156 -0.163 -0.217 0.271 0.265
3 0.586 -0.652 -0.540 -0.027 -0.363 0.282 0.229
4 0.826 -0.756 -0.053 -0.114 -0.461 0.301 0.266
5 0.812 -0.537 -0.103 -0.097 -0.573 0.269 0.230
6 0.943 -0.656 -0.115 -0.171 -0.564 0.285 0.278
7 0.826 -0.487 -0.162 -0.105 -0.629 0.268 0.290
8 0.880 -0.543 -0.178 -0.096 -0.623 0.268 0.292
9 0.695 -0.416 -0.149 -0.036 -0.626 0.239 0.292
10 0.730 -0.466 -0.157 -0.033 -0.612 0.241 0.297
Table 3: The thermodynamic and kinetic parameters (kcal/mol) of the reactions
sys ∆E ∆E# ∆G ∆G# ∆H ∆H# Keq k (s-1)
1→2 -9.85 36.49 -9.07 35.53 -8.52 36.47 4.45E+06 5.62E-14
3→4 -4.46 3.52 -3.70 4.70 -4.52 2.97 5.15E+02 2.23E+09
5→6 -4.68 8.85 -4.00 10.65 -4.56 7.95 8.55E+02 9.70E+04
7→8 1.41 9.22 1.41 9.91 1.33 8.10 9.26E-02 3.38E+05
9→10 1.45 14.61 1.76 13.49 1.41 13.14 5.13E-02 8.03E+02
[image:4.595.131.450.595.754.2]
Table 4: The thermodynamic and kinetic parameters (kcal/mol) of the 1-TS1-2-2 path in different solvents
sys ∆µ# ∆E ∆E# ∆G ∆G# ∆H ∆H# Keq k (s-1)
DMSO 2.27 0.91 47.26 0.37 45.56 0.61 45.65 5.36E-01 2.50E-21
Methanol 2.26 1.11 47.52 0.70 45.90 0.81 45.92 3.07E-01 1.41E-21
Acetone 2.23 1.03 47.46 0.58 45.78 0.75 45.87 3.76E-01 1.72E-21
THF 2.15 1.29 47.85 0.85 46.08 1.02 46.29 2.38E-01 1.04E-21
Cyclohexane 1.91 2.35 49.06 1.97 47.18 2.18 47.59 3.60E-02 1.62E-22
_____________________________________________________________________________
6 7 8 9 10
Figure 1: The local minima structures
[image:5.595.169.412.392.757.2].
Figure 2: The potential energy surfaces describing the Z/E conformation
. . -5 5 15 25 35 45 55
Z TS E
R
e
la
ti
v
e
e
n
e
rg
y
(
k
ca
l/
m
o
l)
Reaction coordinates
C Si Ge Sn Pb
(a) R² = 0.97
20.4 20.6 20.8 21 21.2 21.4 21.6 21.8 22
1.80 1.90 2.00 2.10 2.20 2.30
-L
o
g
k
∆µ#
(b) R² = 0.99
34.9 35 35.1 35.2 35.3 35.4 35.5
2.8 3 3.2 3.4
In te ra ct io n e n e rg y ( k ca l/ m o l)
.
[image:6.595.152.455.61.453.2]
.
Figure 3: Linear relationship between (a) the activation dipole moment and rate constant, (b) the interaction energy of the TS1-2
(C1-O2) and of electron density at the BCP of C1-O2 at the TS1-2, (c) the interaction energy of the TS1-2 (C1-O2) and the electrophilicity
index and (d) the HOMO-LUMO gap and the interaction energy of the TS1-2 (C1-O2) in different solvents
CONCLUSION
The density functional theory studies on the Z/E iminol forms of (HX(OH)NHOH where X=C, Si, Ge, Sn and Pb) showed that the Z and E tautomers for the foromhydroxamic acid are planar, whereas the others (Si, Ge, Sn and Pb) are not. In the transformation of Z to E, the 1-TS1-2-2, 3-TS3-4-4 and 5-TS5-6-6 are exothermic steps and the remaining steps (7-TS7-8-8, 9-TS9-10-10) are endothermic. The solvent effect is clearly observed, since the ∆ G1-2values decreases by a factor of 11.04 kcal/mol in solvation. There is synchronizing trend in the increasing of the activation dipole moment and rate constant with the polarity of the solvent.
REFERENCES
[1]S Zhang; J Baker; P Pulay. J. Phys. Chem. A, 2010, 114, 432. [2]RJ Taylor; I May. Czech. J. Phys. 1999, 49, 617.
[3]S Yen; C Lin; J Ho. J. Phys. Chem. A, 2000, 104, 11771. [4]AA Ahmed. Der Chemica Sinica, 2012, 3(4), 989. [5]AA Ahmed. Der Chemica Sinica, 2012, 3(4), 884.
[6]A Chimiak; W Przychodzen; J Rachon. Heteoat. Chem., 2002, 13, 169. [7]S Bohm; O Exner. Org. Biomol. Chem. 2003, 1, 1176.
[8]M Remko; J Sefcikova. J. Mol. Struct. (Theochem.) 2000, 528, 287. [9]AD Becke. Phys. Rev. 1988, 38, 3098.
[10]C Lee; W Yang; RG Parr. Phys. Rev. B, 1988, 37, 785.
[11]B Miehich; A Savin; H Stoll; H Preuss. Chem. Physi. Lett.1989, 157, 200. [12]PJ Hay; WR Wadt. J. Chem. Phys. 1985, 82, 270.
(c) R² = 0.98
34.9 35 35.1 35.2 35.3 35.4 35.5
3.7 3.9 4.1 4.3 4.5 4.7
In te ra ct io n e n e rg y ( k ca l/ m o l)
Electrophilicity index (ω)
(d) R² = 0.97
34.9 35 35.1 35.2 35.3 35.4 35.5
5.4 5.5 5.6 5.7 5.8
In te ra ct io n e n e rg y ( k ca l/ m o l)
_____________________________________________________________________________
[13]J Tomasi; M Persico.Chem.Rev.1994, 94, 2027.
[14]RG Parr; LV Szentpaly; S Liu. J. Amer. Chem. Soc. 1999, 121, 1922. [15]Gaussian 03, Revision C.02. Gaussian, Inc., Wallingford CT, 2004. [16]GA Zhurko; DA Zhurko.ChemCraft, V.1.7 (Build 375), 2014. [17]R Kakkar; R Grover; P Chadha. Org. Biomol. Chem. 2003, 1, 2200.
[18]D Wu; J Ho. J. Phys. Chem. A, 1998, 102, 3582.
[19]E Eyring. J. Chem. Phys. 1935, 3, 107.
[20]G Bravo-Perez; JR Alvarez-Idaboy; A Cruz-Torres; ME Ruiz. J. Phys. Chem. A, 2002, 106 4645. [21]IK Larsen. Acta Crystallogr. Sect. B, 1988, 44, 527.