Denoising of Auditory Brainstem Response using
Diffusion and Wavelet Transform
Jiwa Abdullah
Department of Communication Engineering, Faculty Of Electrical and Electronic Engineering, Universiti Tun
Hussein Onn Malaysia, Johor, Malaysia [email protected]
Hassan Hamid Ekal
Department Of Communication Engineering, Faculty Of Electrical And Electronic Engineering, Universiti Tun
Hussein Onn Malaysia, Johor,Malaysia [email protected]
Abstract— Evoked Potentials are event-related activities that occurred as an electrical response from the brain to different sensory stimulations of nervous tissues. In this paper, auditory evoked potentials (AEP) brain responses were collected and examined. The data collection was done twice with three different levels of sound and frequencies. The auditory brain response data was extracted from the noisy original data using the averaging technique and set as a reference signal. We propose new approaches for feature extraction of the auditory brain response using wavelet transforms and diffusion filters algorithms. The wavelet transform has the ability to resolve the data into various levels of decomposition, which facilitate its representation in the frequency and time domain. The diffusion filters on the other hand enhanced the extracted signals resulting in the noise suppression and thus reducing the error. Performance analysis was done based on signal-to-noise ratio (SNR), mean squared error (MSE) and peak-signal-to-noise ratio (PSNR). The outcome shows that the diffusion technique produces better performance than wavelet transform in all the cases studied.
Index Terms — Electroencephalogram; Wavelet Transform; Diffusion Filter; Evoked Potentials
I. INTRODUCTION
Event-related potentials (ERPs) can be roughly defined as the changes of the ongoing electroencephalogram(EEG) due to various stimulation activities. They have low amplitude as compared to the background EEG activity and as a result, they are hardly visualized in a single-trial operation. The normal way of improving the ERPs visualization is by averaging the responses over several trials. However, ensemble averaging relies on the basic assumptions that ERPs consist of an invariant pattern time-locked to the stimulus, coupling to the independent stationary stochastic EEG signal. Several techniques have been proposed to improve the visualization of the ERPs. In this paper, the wavelet transform (WT) and diffusion filter provide a time-frequency decomposition that is shown to be very suitable for ERP analysis, due to its optimal resolution both in the time and frequency domain. This study presents a recently proposed de-noising implementation based on the wavelet transform and diffusion filter to obtain the ERPs within a single-trial event[1].
Auditory brain response (ABR) carried a very important data for many clinical applications, therefore designing filters to remove its’ noise with less degradation is very necessary. Almost all biological signals are non-stationary including electroencephalography (EEG). Once the time localization of the spectral components is required, the transform giving the time-frequency representation of the signal must be done[2]. Blankertz et al [3] elucidates the theoretical background of the Common Spatial Pattern (CSP) algorithm. In their proposal, the electroencephalogram (EEG) recordings shows a rather blurred image of brain activities. Hence, spatial filters are extremely useful for a single-trial analysis in order to improve the SNR of its response. During the calibration phase, the subject is instructed to perform certain tasks and collected short segments of labeled EEG trials. The classifier is then trained based on these samples of the trials. However, in the feedback phase it samples through the sliding windows from the continuous stream of EEG.
challenging issue of enabling fast brain-computer interaction to construct a mental speller. Using visual evoked potentials as communication carriers an online paradigm called imitating human-natural reading is realized. This online paradigm single-trial estimation with the intrinsically real-time feature should be used instead of grand average that is traditionally used in the cognitive or clinical experiments. Using several montages of component features from four channels with parameter optimization it explored the support vector machines based on single trial estimation of evoked potentials [6].
The expected outcomes of the proposed algorithms when the averaged auditory brain response signal (ABR) is compared to the signal obtained by wavelet and diffusion filter are as follows. When there is no degradation occurs; it gives high signal-to-noise ratio (SNR), high peak-signal-to-noise ratio (PSNR) and less error (MSE). Less degradation will result in the best evaluation of the denoising algorithm from either wavelet or diffusion filters.
.
II. METHODOLOGY
[image:2.612.348.519.205.348.2]First, wavelet transform and diffusion filtering are design to denoise the averaged auditory brain response signal and improve its quality. Second, various standard matrices like signal-to-noise ratio (SNR), mean squared error (MSE) and Peak Signal-to-Noise Ratio (PSNR) are examined within the design algorithms for the evaluation of signal quality. The signal quality is measured after the denoising process by comparing it with the original data of auditory brain response using the standard metrics mentioned. Figure below is a model of the implemented filters and proposed standard metrics for the measurement of auditory brain response signal quality.
Fig. 1. Model of the Proposed Algorithm
From the figure above we can see clearly how the algorithm is processed with denoising of ABR data and evaluating the quality of its signal before and after applying the filtering algorithms. The noisy signal will go through wavelet transform and diffusion filtering which will denoised the data result in better preservation and edges enhancement. The denoised ABR signal then goes for performance evaluation/assessments using several algorithms to obtain the quality of the signal.
A. Data collection
For data collection, measurement is recorded for tow subject by placing a three numbers of electrodes on the scalp that can measure the currents produced from the electric field generated by the joint of millions of neurons during the
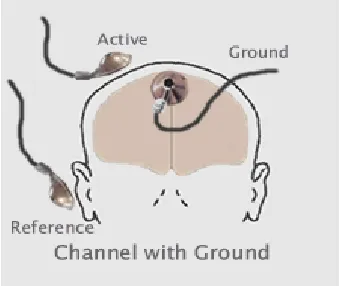
[image:2.612.61.290.422.550.2]synaptic excitation of dendrites. EEG in clinical contexts refers to the recording of the brain’s spontaneous electrical activity over a short period of time using electrodes placed on the scalp. The EEG, a highly complex signal is one of the most common sources of information used to study brain function and neurological disorders [1]. EEG monitoring systems generates large amounts of data, and their complete visual analysis is not routinely possible. EEG consists of electrical rhythms and transient discharges which are discriminated by location, frequency, amplitude, form, periodicity, and functional properties [2]. An Electro-Cap consists of electrodes is used to record EEG signals from positions shown in the given image below.
Fig. 2. Electrode positioning for EEG measurement
In this paper, we are going to record the electrical response of the brain due to an external audio. This audio is in the form of tone that is used to stimulate the brain, where the responses of the brain will be recorded by electrodes and save as text file. Several frequencies will be used with the audio tone of 500Hz, 1000Hz and 4000Hz with different period of time (one to two second).
III. SIGNAL REPRESENTATION AS A GENERAL CASE
Time frequency signal analysis and process concern with the analysis and processing of signals with time varying frequency contents. Such signals are best represented by time-frequency distribution, which is intended to show how the energy of the signal is distributed over the one dimensional time-frequency space. Processing the signal may exploit the features produced by the concentration of signal energy in one dimension.
The two classical representations of a non-stationary signal process {x} are the time-domain representation x(t) and the frequency-domain representation X(f) [7]. In both forms, the variables t and f are treated as mutually exclusive such that, to obtain a representation in terms of one variable, the other variable is integrated. Consequently, each classical representation of the signal is non-localized with respect to the excluded variable. But, in time-frequency distribution S (t, f) the variables t and f are not mutually exclusive but rather they occurred simultaneously. Hence, the time-frequency distribution is localized both in t and f. Naturally, any signal can be expressed as a function of time t.
Original signal
De-noising
process
ABR
Signal
assessment
De-noised
Signal
Final
A. ABR Signal Representation
Time signal representation concerns the analysis and processing of signals with time domain. Such signals are best represented by time-frequency distribution, which is intended to show how the energy of the signal is distributed over the two dimensional time-frequency space. Processing the signal may exploit the features produced by the concentration of signal energy in two dimensions instead of only one.
B. Wavelet Transform Analysis
The main advantages of wavelet transform over other existing signal processing techniques are its space-frequency localization, multi-scale view of the signal components and its ability to identify spatial structure in the transit data. Furthermore, there must be a suitable representation of the data in order to facilitate any analytical procedures. By using transformation or decomposition techniques we can achieve and reach the maximum goal of the signals set of basic functions prior to processing in the transform domain. In addition, one of the associated basis functions is complex
sinusoidal waves that correspond to the eigenvectors of a linear time-invariant operator [2]. A signal defined in
the temporal domain and its Fourier transform , defined in the frequency domain, have the following relationship,
(1)
(2)
Fourier transform characterizes a signal via its frequency components. Since the support of the bases function covers the whole temporal domain (i.e. infinite support),
depends on the values of for all times. To achieve the goal of capturing frequency evolution of a non-static signal , the main function must be supported by both time and frequency domain and that could be happen by introducing WFT with the usage of w(t) function in the domains.
(3)
By applying the energy concepts and its Fourier transform as , with energy in frequency domain
localized around , over an interval of size . In a
time-frequency plane , the energy spread of what is called the
atom is represented by the Heisenberg rectangle with
time width and frequency width .
(4)
One of the examples of spatial-frequency is tiling with Heisenberg rectangles. Also, the shape if the time frequency boxes that cross the whole time frequency plane must be
identical based on windowed Fourier transform which means that the analysis resolution of a windowed Fourier transform remains the same across all frequency and spatial locations.
C. Nonlinear Diffusion filtering algorithm
The nonlinear diffusion filtering operation is governed by the following nonlinear partial differential equation (PDE):
, = , . ∇, (5)
where , is the initial noisy signal at time t and the solution of the above PDE iteratively yields a filtered version which can be considered as the denoised signal. In Eqn. (5) , is the diffusion coefficient controlling the diffusion amount and is typically described by a diffusivity function of the form,
, = |, | =
|,| (6)
where| , | is the edge estimate at pixel (x, y), usually approximated by a gradient magnitude operator, and is the edge threshold parameter [10]. The diffusivity function ||is a nonnegative monotonically decreasing function and, depending upon the value of the edge threshold , encourages homogenous regions with reduced noise while preserving the edges. The nonlinear diffusion PDE of Eqn.(1) can be expanded to,
/ " _" , = / , . / _" , + / , . / _" , (7)
substituting the time-derivative of , by its forward difference and discretizing,
%&'∆&),*+%&),*
∆ = / , . / _" , +
/ , . / _" , (8)
Let ∆" = 1 and replacing , , as defined in Eqn.(2) above, with 1 − ., , we obtain:
, = , +/)/, + /
/*, −
)0., .
), 1 −
*0., .
*, 1 (9)
Usually,, is initialized by 2, = , , where , is the original noisy image. The solution to the above equation yields a denoised signal after a certain number of iterations [9].
D. Denoising of Auditory Brain Response data By Wavelet Filter
Wavelet de-noising is comparatively a new method proposed in for estimation of single trial evoked potential signal. It provides time-frequency decomposition for the analysis of evoked potentials. This method assumes that the evoked potential is non-stationary. In this method the activity of the averaged evoked potential is decomposed in different frequency bands and times using the wavelet multi-resolution decomposition technique. Wavelet coefficients correlated with evoked potentials are identified and the remaining ones are set i t
e
ω( )
f t
ˆ ( )
f
ω
ˆ ( )
( )
i t,
f
ω
+∞f t e
−ωdt
−∞
=
∫
1 ˆ ( ) ( ) . 2 i tf t f
ω
e dωω
π
+∞ −∞ =∫
( ) f t i te
ωˆ ( )
f
ω
f t( )( , )
( ) (
)
i.
Sf
ω
t
+∞f
τ
w t
τ
e
−ωτd
τ
−∞
=
∫
−
( ) ,
ˆ ( ) ˆ( ) i
gτ ξ
ω
wω ξ
e τ ω ξ− −
= −
ξ
σ
ω( , )
t
ω
,
( )
g
τ ξt
t
σ
σ
ω1
.
2
t ω
ABR Signal evaluation
SNR MSE PSNR
to zero [8]. Selected coefficients cover a time range in which the single-trial evoked potentials are expected to occur and then the inverse transform is calculated to obtain the denoised averaged evoked potential. This method used prior information about the peaks of evoked potential to identify the coefficients where these coefficients are identified manually which is a very tedious task. In this method we use a time range in which single trials evoked potentials are expected.
E. ABR data denoising with diffusion filter
Diffusion filter has received much attention and experienced significant developments, with promising results and applications in various specific domains. The elegant property of the technique is that it can enhance signal by reducing undesirable intensity variability within the objects in the signal without losing much information and enhance the contrast of the edges in other words it smoothen the edges. As a result it is proposed for denoising ABR data for better evaluation.
IV. EVALUATION PARAMETER OF ABR DATA DENOISED BY
WAVELET AND DIFFUSION FILTER.
[image:4.612.342.538.65.163.2]In this section introduces several quality measures for the assessment of the proposed algorithms. These measures are used to evaluate the algorithm and the signal itself as well. Signal-to-noise ratio, mean square error and peak-signal-to-noise ratio are the parameters introduced due to their simplicity and reputation.
Fig. 3. ABR assessment methods
V. RESULTS AND DISCUSSIONS
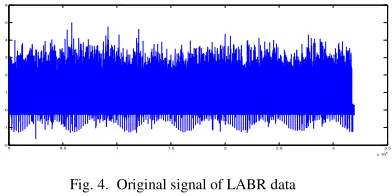
This part introduces the result obtained by the two algorithms and discusses in details their effects to the features extracted by both algorithms. At first the signal is plotted as can be seen in the below figure. Second, averaging technique was applied to simplify the process and remove the noise. Collected data was obtained from several individuals at different specifications. The original data are based on one second and two second recording time. Overall data that was used in this paper was 36 different data. An example of the original data is as plotted in the next figure (5). We can use the original data since it is corrupted by noise and it is too much. So, samples of the collected data will be used for the testing and evaluation.
Fig. 4. Original signal of LABR data
Fig. 4 shows the main signal of auditory brain response at given frequency of 500 Hz and recording time of one second. Sample of 2000 points were taken and averaged to obtain the denoised single trial due to the given specifications previously mentioned.
A. Data denoised by ensample average, wavelet and diffusion filter
[image:4.612.322.546.352.546.2]In this part, from each data collected we take 2000 point and average it as 4 trials. The averaged trial was used as reference, since no more noise in the trial. Wavelet transform at level 9 of decomposition was applied to remove the noise from the reference trial. In addition, diffusion filter was used to remove the noise and enhance the signal of auditory brain response. Finally comparison between these two filters was carried out.
Fig. 5. Denoised LABR data
Averaging algorithm is applied to the recorded signal of auditory brain response in order to cancel out the noise and reflect the response of the brain to the given tone only while neglecting the other responses. This averaging technique will be used later as reference signal for us to measure the performance of the proposed filters in denoising the single trial data. Comparative study will be carried out between wavelet transform and diffusion filter and measured their performance in denoising the auditory brain response. All this criteria is done based on one dimension format.
0 0.5 1 1.5 2 2.5 3 3.5
x 105
-2 -1 0 1 2 3 4 5 6
0 0.2 0.4 0.6 0.8 1 1.2 1.4 1.6 1.8 2
-2 0 2
0 0.2 0.4 0.6 0.8 1 1.2 1.4 1.6 1.8 2
0 1 2
wavelet denoised trial
0 0.2 0.4 0.6 0.8 1 1.2 1.4 1.6 1.8 2
0 1 2
[image:4.612.82.261.388.483.2]0 0.2 0.4 0.6 0.8 1 1.2 1.4 1.6 1.8 2 0
1 2
Reference ERP
0 0.2 0.4 0.6 0.8 1 1.2 1.4 1.6 1.8 2
-5 0 5
noisy ERP
0 0.2 0.4 0.6 0.8 1 1.2 1.4 1.6 1.8 2
0 1 2
Gaussian.F ERP
0 0.2 0.4 0.6 0.8 1 1.2 1.4 1.6 1.8 2
0 1 2
Wavelet.F ERP
0 0.2 0.4 0.6 0.8 1 1.2 1.4 1.6 1.8 2
0 1 2
[image:5.612.65.283.58.217.2]Diffusion.F ERP
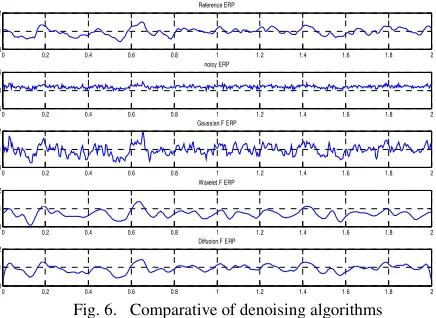
Fig. 6. Comparative of denoising algorithms
As shown in Fig. 6, first the averaged single trial is obtained and taken as the reference for our data. Second, white Gaussian noise is added to the averaged trial to test the proposed denoising algorithms on the data. Gaussian transform have been used in previous works but it gives poor result and most of the noise still remain in the data. Wavelet transform with nine levels of decomposition is used to remove the noise from the averaged data in order to obtain a very clear data. The result shows a very high respond and very good result is illustrated where the noise has been filtered out. Last, diffusion filter is applied to enhance the data and remove the noise in order to extract the auditory brain response with a minimum amount of noise.
Analysis of the image/signal quality assessment is discussed in details and comparative between the proposed methods is done based on signal-to-noise ratio (SNR), mean squared error (MSE) and peak-signal-to-noise ratio (PSNR). These three parameters will give us a clear distinction and evaluation of the two proposed methods.
B. Evaluation performance in statistical representation
VI. CONCLUSIONS
. In this paper, Auditory evoked potentials (AEP)/auditory brain response was collected and examined. The data was collected at three different level of sound at three different frequencies and two different record times. Average technique was used to remove the noise in the original data of auditory brain response and the final data in represented in graphical form. Averaging techniques removes the noise successfully and the output of the algorithm was plotted and used as reference for the other proposed algorithm. Wavelet transform and diffusion filter are two new algorithms for extracting signals such as the auditory brain response signals. The wavelet transform has the ability to decompose the data to many levels of decomposition, which facilitate its representation in frequency and time domain. The diffusion filters works same as wavelet transform adding an enhancement to the extracted signals which will result in removing the noise and decreasing the error
.
Performance analysis and evaluations parameters was carried out in this paper and it shows that, the diffusion works better than wavelet transform as given by signal-to-noise ratio, mean square error and peak-signal-to-noise ratio.ACKNOWLEDGMENT
REFERENCES
[1] Suhas S. Patil , Minal K. Pawar ,”Quality advancement of EEG by wavelet
denoising for biomedical analysis”, 2012
[2] Letian Wang, “Artifact Correction for EEG Alpha Wave Measurements”,
Master of Science Thesis, Delft University of Technology, Sept. 2009
[3] Blankertz, B.; Tomioka, R.; Lemm, S.; Kawanabe, M.; Muller, K.-R.,
"Optimizing Spatial filters for Robust EEG Single-Trial Analysis," Signal
Processing Magazine, IEEE , vol.25, no.1, pp.41,56, 2008
[4] I. Mustaffa, "Denoising of Single-trial in matrix representation using
non-linear diffusion filter ",2010
[5] P. Bansal, "Evoked potential denoising with Adaptive filter ", 2009
[6] Chen M, Guan J, Liu H. Enabling fast brain-computer interaction by
single-trial extraction of visual evoked potentials. J Med Syst. 2011 Oct;35(5):1323-31.
[7] Victor Sucic,"Estimating the number of components of a multicomponent
nonstationary signal using the short-term time-frequency Rényi entropy".2011
[8] Walter J. Freeman, Rodrigo Quian,"Imaging Brain Function with EEG:
Advanced Temporal and Spatial Analysis of electroencephalographic signals", 2013
[9] Abderrahim, Elmoataz, "Image and Signal Processing", 3rd
International Conference, ICISP 2008