Sheard, Mary and Ahmed, Jebar
Learner strategies using learning technologies in taught curriculum time
Original Citation
Sheard, Mary and Ahmed, Jebar (2008) Learner strategies using learning technologies in taught
curriculum time. Project Report. University of Huddersfield, Huddersfield, UK. (Unpublished)
This version is available at http://eprints.hud.ac.uk/id/eprint/784/
The University Repository is a digital collection of the research output of the
University, available on Open Access. Copyright and Moral Rights for the items
on this site are retained by the individual author and/or other copyright owners.
Users may access full items free of charge; copies of full text items generally
can be reproduced, displayed or performed and given to third parties in any
format or medium for personal research or study, educational or notforprofit
purposes without prior permission or charge, provided:
•
The authors, title and full bibliographic details is credited in any copy;
•
A hyperlink and/or URL is included for the original metadata page; and
•
The content is not changed in any way.
For more information, including our policy and submission procedure, please
contact the Repository Team at: [email protected].
Learner Strategies Using Learning Technologies
In Taught Curriculum Time
Mary Sheard
Jebar Ahmed
The School of Education and Professional Development
The University of Huddersfield
Report prepared for Becta and the University of Huddersfield
Contents
1. Introduction ...4
1.1 Rationale and aims ... 4
1.2 Relevant literature ... 4
2. Research questions...9
3. Methodology...10
3.1 How the study was undertaken... 10
3.2 Participants and learning contexts ... 10
3.3 Methods and instruments used... 11
3.4 How the data was analysed ... 12
4. Results ...13
4.1 Quantitative results: Surveys ... 13
4.2. Qualitative Findings ... 31
5. Conclusions and recommendations ...45
5.1 The use and usefulness of learning technologies in supporting learners’ strategies in taught sessions ... 45
5.2 Cognitive learning strategies (CLS) ... 47
5.3 Active learning strategies (ALS)... 48
5.4 Learning outcomes ... 50
5.5 In conclusion ... 52
6. References...53
7. APPENDICES...55
Appendix 1 ... 55
Appendix 2 ... 56
8. Contact information and acknowledgements...61
List of Tables
Table 3.1: Subject focus of taught sessions where learner strategies using learning technologies were observed... 11Table 3.2: Taught sessions in which learning technology was not used to support learning in taught sessions... 11
Table 4.1: Comparative survey findings of uses of technology for learning in the participating and wider Secondary school student populations surveyed ... 19
Table 4.2: Comparative survey findings of uses of technology for learning in the participating and wider FE student populations ... 25
Table 4.3: Comparative survey findings of uses of technology for learning in the participating and wider HE student populations... 28
Table 4.4: Summary of participants’ views of how the technology supports their learning in taught sessions in the Secondary school, FE and HE sectors: minority responses ... 29
Table 4.6: Participants’ perceptions of how the technology supported their learning in the
Secondary school, FE and HE sectors... 33
Table 4.7: Cognitive learning strategies (CLS), active learning strategies (ALS) and learning outcomes using the computer in computer-related courses: Secondary School sector ... 36
Table 4.8: Cognitive learning strategies (CLS), active learning strategies (ALS) and learning outcomes using the computer across the curriculum: Secondary School sector... 36
Table 4.9: Cognitive learning strategies (CLS), active learning strategies (ALS) and learning outcomes using the interactive whiteboard across the curriculum: Secondary School sector 38 Table 4.10: Cognitive learning strategies (CLS), active learning strategies (ALS) and learning outcomes using the computer in computer-related courses: FE sector ... 40
Table 4.11: Cognitive learning strategies (CLS), active learning strategies (ALS) and learning outcomes using the computer across the curriculum: FE sector ... 41
Table 4.12: Cognitive learning strategies (CLS), active learning strategies (ALS) and learning outcomes using the interactive whiteboard across the curriculum: FE sector ... 42
Table 4.13: Cognitive learning strategies (CLS), active learning strategies (ALS) and learning outcomes using the computer: HE sector ... 43
Table 4.14: Cognitive learning strategies (CLS), active learning strategies (ALS) and learning outcomes using the interactive whiteboard: HE sector ... 43
Table 5.1: Strategies to support different learning outcomes using learning technologies... 51
List of Figures
Figure 4.1: Reasons for Participants’ use of Technology... 13Figure 4.2: Support for Learning Provided by Technology in Lessons ... 14
Figure 4.3: Enthusiasm For Using Technology in Lessons ... 15
Figure 4.4: Technology Makes Learning More Interesting ... 16
Figure 4.5: Frequency of Computer Use to Support Learning in School ... 17
Figure 4.6: Use of the Internet to Learn at School ... 18
Figure 4.7: Use of the Interactive Whiteboard to Support Learning in School ... 18
Figure 4.8: Reasons for Using Technology in Lessons in FE ... 20
Figure 4.9: Support for Learning provided by Technology in Lessons... 21
Figure 4.10: Enthusiasm in Using Technology for Learning ... 21
Figure 4.11: The role of technology in making learning more interesting in FE ... 22
Figure 4.12: Use of Computers to Learn in FE Colleges... 23
Figure 4.14: Use of the Interactive Whiteboard to Learn in FE Colleges ... 24
Figure 4.15: Reasons for Using Technology in Lessons in HE ... 26
Figure 4.16: The Role of Technology to Learn in HE ... 26
1. Introduction
The study was conducted from October 2007 to April 2008 by the University of Huddersfield
through a Becta research grant under the capability and capacity strand of the DfES
Harnessing Technology strategy.
1.1 Rationale and aims
There appears to be little research evidence on learners’ experience of learning with
technology in taught curriculum time, how learners are engaged in learning with technology in
this learning context, the learning strategies they use and associated learning outcomes.
By focussing on learning with technology in taught sessions and the strategies that learners
use in this context, the present study aimed to investigate an important dimension of the
concept of e-learning, which is often not associated with taught curriculum time, but more with
independent self-directed study time (SDST).
The focus of the project would seem to be of interest at the present time of substantial
investment across the educational sectors in technological provision and capability for
computer access, Virtual Learning Environments (VLEs) and online communication and
information systems.
In order to meet the continuing challenge of delivering greater educational value from
technology and realising significant benefits for learners (Crowne, 2007) the project aimed to
identify learners’ strategies when using technology as a cognitive tool in taught curriculum
sessions. The intention was that the findings would inform how we can develop more effective
learning strategies using technology in taught sessions.
It was considered important to identify the continuities and discontinuities that currently occur
between the Secondary school, FE and HE sectors in students’ learning with technology in
taught curriculum time. Findings would inform support for increased learner engagement with
technology in the three educational sectors and would sustain improvement in learner
capability as students transfer from Secondary school to FE and into HE on their educational
journey.
1.2 Relevant literature
The study was mindful of recent research findings that have contributed to our current level of
understanding about the role of technology in students’ learning in different educational
sectors. The Harnessing Technology Review (Becta, 2007), for example, places a clear
emphasis on the need to progress the use of technology from enhancing and enriching to
to learners’ strategies, and particularly to strategies associated with collaborative and
constructive learning. This shift in focus is concerned to address the often passive learner role
in knowledge creation in formal education settings, the infrequent use of technology for
learning together, and the dislocation between learners’ experiences using technology in
formal and informal learning contexts and outside education.
Important learner perceptions of the impact of ICT on their education were reported in some
earlier studies. For example, Jarvis et al (2005), in an important test-bed study, found that
Secondary school students wanted more autonomy in the use of computer equipment in
lessons. Many students were ambivalent about ICT in teaching and learning, felt impatient
when the teacher was showing them what to do, and looked forward to a time when they
might have their own individual computer in school and the teacher could just log in and
check work (Jarvis et al, 2005: 24). The students reported variable access to ICT, depending
on the subject, the teacher, the time-table, and the location of the lesson. Some students felt
that the momentum for learning with ICT technology had been lost.
In a comprehensive study of learners’ experiences of e-learning across further education,
including work-based learning, and higher education, Creanor et al, (2006) identify control
and choice as key themes associated with learner strategies and behaviours. Within these
themes, the importance of meta-cognition is emphasised, where a learner displays an
understanding of how learning occurs and its impact on the learner’s identity. However, while
the report identifies influencing factors on the learner experience of e-learning in formal
learning, the learning strategies and the key themes associated with them are not detailed in
the formal learning context.
Conole et al (2006) reported the pervasive and integrated use of technology by HE students
and the development of new strategies, including searching, restructuring and validating.
Conole et al (2006) suggest that such strategies lead to a shift from passive to interactive
learning and from lower to higher levels of cognitive engagement. A role for technology was
identified in supporting learning through thinking and reflection, learning through experience
and activity, and learning through conversation and interaction (Conole et al, 2006). However,
perhaps because the emphasis of the reports by Conole at al (2006) and Creanor et al (2006)
was on learner voice and recognised the difficulties in describing one’s own learning, learners’
strategies using learning technologies were not deconstructed or described in specific terms.
The boundaries in participants’ narratives reported in recent research studies are often
blurred between learning in formal contexts and independent self-directed study time (SDST).
Overall, reports of findings about learner strategies in recent research studies focus on how
learners fit e-learning around their traditional learning activities. It is often unclear if and how
taught curriculum time. The recent study by Deepwell et al (2008) makes an important
contribution to investigating and capturing university students’ experiences of learning
technologies in their self-directed study. The study by Deepwell et al (2008) paves the way for
much needed research into students’ experiences of learning technologies and the learning
strategies they use in taught sessions in different educational sectors.
Earlier studies, (Oblinger, 2003; Raines, 2003) reported that learners who have grown up in
the digital era prefer teamwork, experiential activities, structure and the use of technology.
Their strengths, which may indicate learning strategies, include multi-tasking, goal-orientation,
positive attitudes, and a collaborative learning style. However, Oblinger (2003) found that
many learners between the ages of twelve and seventeen were disappointed with the use of
technology in school. Signs of disengagement and dislocation were evident where the
learners considered their teachers’ use of technology to be uninspiring, and reported seeing
better ways than their teachers to use the technology. More recently, Oblinger (2008), van’t
Hooft, (2008) and de Frietas (2008) argue that formal education risks becoming less relevant
if more effective strategies for learning with technology are not supported.
Dyke et al (2007: 84) suggest that e-learning could be improved by being oriented around
thinking and reflection, experience and activity and conversation and interaction. It follows
that learning strategy development should reflect these three learning orientations. A
taxonomy of cognitive activities suggested by Ohlsson (1995) seems to offer useful
descriptors of cognitive strategies learners might use with computers as cognitive tools
(Lajoie et al, 2000). The taxonomy includes describing, explaining, explicating (clarifying),
evaluating, arguing, predicting and defining.
Jucks et al (2003) suggest structure, elaborate, restructure and integrate as a set of learning
processes to describe learning with computers, particularly in collaborative contexts. These
processes operate on information content to structure information, ideas and concepts,
elaborate using other sources, and restructure the information, ideas and concepts into an
extended form of understanding. Currently there appears to be little research evidence on the
active learning strategies learners use to structure, elaborate and restructure information
using learning technology in taught sessions.
Important questions about the role that technology plays in the relationship between taught
curriculum time and independent self-directed study time (SDST) are prompted by the
research findings by Deepwell et al (2008) of university students’ experiences of learning
technologies in their self-directed study. In particular, the study suggests that students’ use of
technology to support their learning in SDST is underdeveloped, and that students require
Heppell’s (2008) concept of ‘inbetweenies’ is useful in this context as it places the digital
generation of learners between traditional formal learning experiences and e-learning
experiences in SDST where learners use their preferred strategies for learning. Such
‘inbetweeness’ may be disempowering, and the concept highlights the importance of
integrating strategies for using technology as a cognitive tool into taught sessions across
educational sectors.
Review of the Harnessing Technology Strategy suggested that the use of technology to
support effective continuity in learning as at an early stage: ‘Understanding what continuity of
learning supported by technology looks like for different learner groups and sectors is
essential’. The Harnessing Technology Strategy Review identifies, for example, that
technology is used less in the Secondary school sector than the Primary school sector for
analysing information, problem solving, collaboration and creativity. Similarly, findings by
Sheard et al (2007) highlight the learning preferences, mind sets and features of engagement
of Secondary school students and the challenges facing Higher Education in engaging future
generations of learners. To build on this earlier research it would seem important to
investigate students’ learning strategies using technology in different educational sectors to
inform how continuity of learning in taught curriculum time may be better supported.
The study was further informed by the findings of the Harnessing Technology Strategy review
(2007) which reported that while there has been an improvement in levels of e-maturity and
increased use of interactive whiteboards in Secondary schools, there continues to be
variation in the extent to which use of technology is embedded as a teaching and learning
tool. Continued improvement in developing ICT capability in FE is indicated, with the use of
ICT as a teaching and learning tool featuring in most colleges. However, in both Secondary
school and FE sectors, the review indicates that the possibilities ICT offers for teaching and
learning are not fully exploited, particularly for creative and collaborative learning
opportunities and for personalised, flexible learning.
Other research indicated a positive impact on Secondary school students’ learning outcomes
has been associated with the use of technology, and interactive whiteboards in particular, to
support learning (ImpaCT2, 2002). However, while, increased engagement in and satisfaction
with learning with technology are reported in the FE sector, evidence of the impact on
learning outcomes is limited (Harnessing Technology Strategy review, 2007:13).
Somekh (2007:33) argues that until all students have their own personal ‘digital learning
companions’ and access to the Internet wirelessly and when required, the usefulness of
technology for learning will inevitably be constrained. Similarly, a new pedagogic
understanding of the role of technology for learning needs to emerge if teaching and learning
providing ideas and a resource for enquiry, and, perhaps most importantly, as a support for
creativity in learning (Somekh, 2007:101). This new pedagogic understanding of the role of
technology for learning would need to be informed by and seek to develop the strategies
2. Research questions
The research questions underpinning the study were: -
1. What strategies for learning with technology do students use in taught curriculum time in
the Secondary school, FE and HE sectors? What are the continuities and discontinuities
in learners’ strategies between the three educational sectors?
2. What learning outcomes are associated with students’ learning strategies using
technology in taught curriculum time?
3. How can we develop more effective learning strategies?
Underpinning the main research questions is how learner strategies are supported by
technology in the Secondary school, FE and HE sectors (in reference to cognitive learning
strategies (CLS) and active learning strategies (ALS)) and what are the continuities and
3. Methodology
3.1 How the study was undertaken
The study incorporates the emphasis placed on learner voice in recent important research
projects with a cognitive-empirical approach to investigating learner strategies. Online surveys
were completed and fieldwork in the Secondary school, FE and HE sectors including lesson
observations, interviews and students logs, were conducted from December 2007 to April
2008.
3.2 Participants and learning contexts
3.2.1 Participants
The participants were 9 Year 11 students from 3 Secondary schools, 9 A level or Diploma
students from 3 FE institutions, and 7 undergraduate students from 5 university schools and
departments (Law, Youth and Community Work, International Business Studies,
Pharmaceutical Science, and Advertising with Media and Design Management) in one
post-92 University in the North of England.
Ethical guidelines for educational research were followed (BERA, 2004), ethical approval was
obtained from the University, access to participants was through consenting institutions, and a
contract of ethical practice was undertaken with each participant to ensure voluntary informed
consent. The principle guiding participant access and participation the research was the
individual’s interest, willingness and enthusiasm for taking part in the project. The subject
areas and anticipated use of learning technology were not the main deciding factors (see
Section 3.2.4).
3.2.2 Students completing online surveys
To gain a wider picture of students’ perceptions of how learning technology supports their
learning and the strategies learners use, and to contextualise and triangulate findings from
the participants observed in the study, online surveys were completed by FE students (N=81)
from partner institutions and HE students (N=72) registered on a range of undergraduate
courses at the University. Secondary school students in Year 11 (N=109) and in Year 10
(N=97) completed online or paper-based surveys.
3.2.3 Taught sessions in which observations were made of learner
strategies using learning technologies
The subject focus of the taught sessions was a chance factor and depended on the days
negotiated for the observations. Some subject and discipline matches occurred across the
Table 3.1: Subject focus of taught sessions where learner strategies using learning technologies were observed
Secondary school sector FE sector HE sector
History GCSE PE
Technology (Graphics) Sociology
English Applied Science Science Physics Mathematics Key Skills DIDA Geography French
Food Technology
History Music
Business studies Psychology
Health and Social Care Applied Science
Diploma in Child Care and Education Computer studies
BTEC IT Key Skills
IT BTEC Intermediate Travel and Tourism Spanish
Photography
Law
International Business Studies (Statistics)
Youth and Community Work Pharmaceutical Science
Advertising with Media and Design Management
Taught sessions in which learning technology was not used to support learning during the
data collection period are shown in Table 3.2.
Table 3.2: Taught sessions in which learning technology was not used to support learning in taught sessions
Secondary school sector FE sector HE sector
Chemistry Media RE Drama Art
English Maths
International Business Studies Law (some modules)
Advertising with Media and Design Management
3.3 Methods and instruments used
3.3.1 Shadowing participants
To track learning with technology, students were shadowed for one day or relevant part of a
day in their educational setting in taught curriculum time. This involved observing, timing and
recording aspects of the student’s interactions with learning technology, their learning
strategies and learning outcomes. In this context, learning was defined as an increase in
knowledge, skill or understanding or as a change in how something is perceived or
interpreted. An observation form was developed to record learning with technology, and
included information on the times, duration, activity, learning strategy and learning outcomes
of student engagement with/use of technology as a learning tool in taught curriculum time.
3.3.2 Student log
A student log was completed after each taught session that featured learning with technology
(computers or interactive whiteboards). The student log identified the subject focus, the focus
of the session, the technology used, what it was used for, how the technology supported
learning, and the student’s perceived learning outcomes, or what the student knew,
3.3.3 Structured interviews
Students reflected on and evaluated their learning with technology through an interview
schedule that asks questions on the role technology plays in the student’s learning; whether
and why the participating day was usual or unusual in the way technology supports learning;
which technologies support learning in the students’ particular settings; differences between
experiences of learning with technology in the present and previous educational sectors; the
features of learner-focused engagement with technology and possible missed opportunities
for such engagement.
3.3.4 Student survey (Case study and wider population survey)
Questions were asked around the role technology plays in the student’s learning, the
technologies used, and the types of learning activity that technology supports.
3.4 How the data was analysed
The data was analysed quantitatively and qualitatively. Quantitative analysis was carried out
on survey data on students’ perceptions of technology for learning and on observational data
from shadowing students in taught sessions. Quantitative analysis from observations
focussed on the following:
the amount and percentage of taught curriculum time learning technology is used as a tool for
learning, and differences within and across educational sectors;
and
the amount and percentage of taught curriculum time students spend using different learning
technologies, and differences within and across educational sectors.
Qualitative analysis drew on the work of Ohlsson (1995) on cognitive epistemic activity, Jucks
4. Results
4.1 Quantitative results: Surveys
Quantitative analysis was carried out on survey data on students’ perceptions of how they use
technology for learning in taught sessions in the Secondary school, FE and HE sectors.
Statistical comparisons were made between the participating students and the wider
populations surveyed. The section aims to provide a context for the learning strategies and
learning outcomes identified in subsequent sections of the report. Quantitative analysis was
also applied to observational data of learner strategies from shadowing students in taught
sessions.
4.1.1 How Secondary School students perceive the usefulness of
technology for learning
This section provides information about the views of the participating students regarding the
usefulness of technology for learning and the focus of such learning in taught sessions in the
Secondary school, FE and HE sectors. In this way, the section aims to provide a context for
the learning strategies and learning moves identified in the qualitative analysis (See Section
4.2). It should be noted that percentage values for the participant group should be interpreted
with caution due to the small sample size.
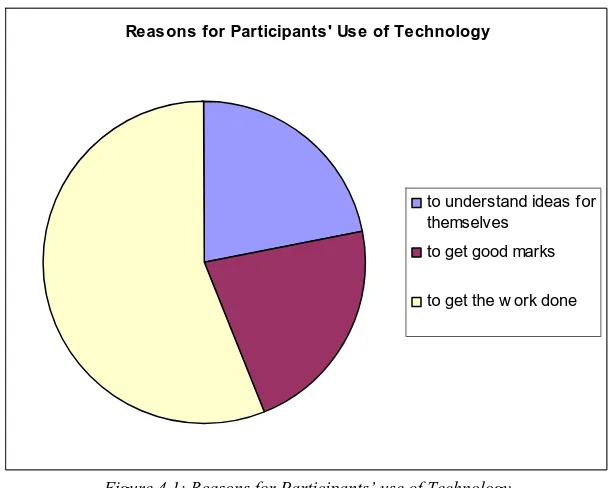
Reasons for participants’ use of technology
As Figure 4.1 shows, Secondary school students considered the main reason for using
technology was to get the work done.
Reasons for Participants' Use of Technology
to understand ideas for themselves
to get good marks
[image:15.595.144.451.490.734.2]to get the w ork done
Figure 4.1: Reasons for Participants’ use of Technology
2 students (22%) use technology in lessons to help to get good marks
5 students (56%) use technology in lessons to get the work done
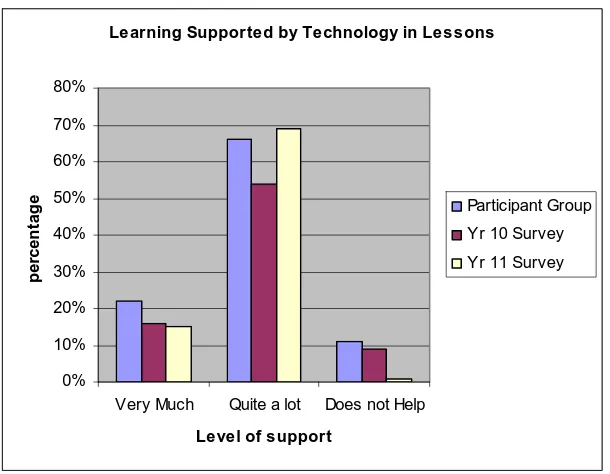
The level of support for learning provided by technology
As Figure 4.2 shows, Secondary school students mainly consider that technology supports
their learning quite a lot in lesson time.
Learning Supported by Technology in Lessons
0% 10% 20% 30% 40% 50% 60% 70% 80%
Very Much Quite a lot Does not Help
Level of support
p
er
cen
tag
e Participant Group
Yr 10 Survey
[image:16.595.146.451.192.429.2]Yr 11 Survey
Figure 4.2: Support for Learning Provided by Technology in Lessons
2 students (22%) say technology helps them very much to learn in lessons compared with
16% of the wider Year 11 population surveyed and 15% of the wider Year 10 population
surveyed.
6 students (66%) say technology helps them quite a lot to learn in lessons compared with
54% of the wider Year 11 population surveyed and 69% of the wider Year 10 population
surveyed.
1 student (11%) says that technology does not help to learn in lessons, compared with 9% of
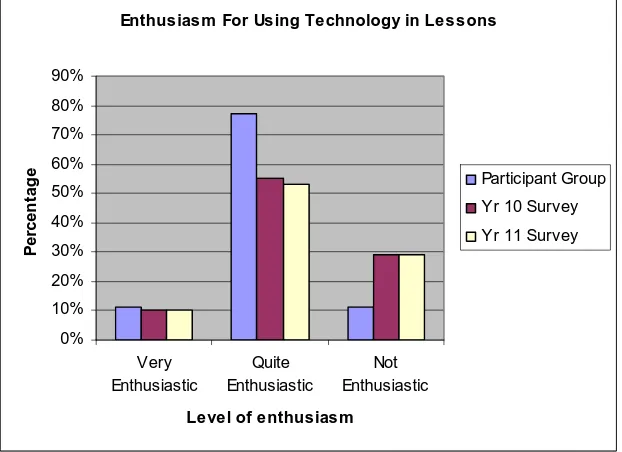
Enthusiasm for using technology in lessons
Figure 4.3 suggests that while Secondary school students are generally quite enthusiastic
about using technology to support their learning in lessons, a sizeable minority are not.
Enthusiasm For Using Technology in Lessons
0% 10% 20% 30% 40% 50% 60% 70% 80% 90%
Very Enthusiastic
Quite Enthusiastic
Not Enthusiastic
Level of enthusiasm
P
er
cen
tag
e Participant Group
Yr 10 Survey
[image:17.595.143.454.129.355.2]Yr 11 Survey
Figure 4.3: Enthusiasm For Using Technology in Lessons
1 student (11%) reports being very enthusiastic about learning with technology in school
compared with 10% of the wider Year 11 population surveyed and 10% of the wider Year 10
population surveyed.
7 students (77%) say they are quite enthusiastic about learning with technology in school
compared with 53% of the wider Year 11 population surveyed and 55% of the wider Year 10
population surveyed.
1 student (11%) reports being only a little enthusiastic about learning with technology in
school compared with 29% of the wider year 11 population surveyed and 29% of the wider
Year 10 population surveyed.
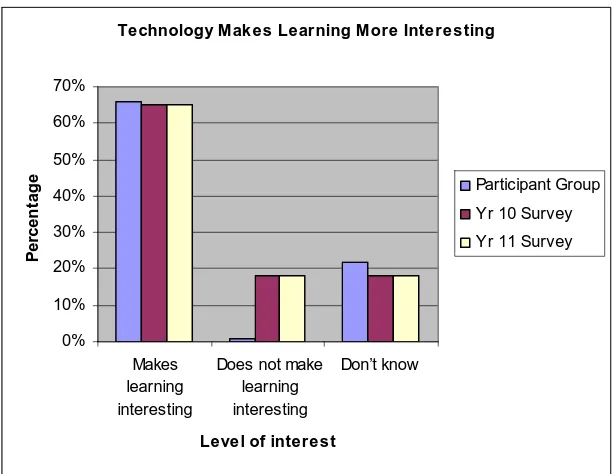
The role of technology in making learning more interesting in lesson time
Figure 4.4 shows that on the whole Secondary school students are more interested in
Technology Makes Learning More Interesting
0% 10% 20% 30% 40% 50% 60% 70%
Makes learning interesting
Does not make learning interesting
Don’t know
Level of interest
P
e
rcen
tag
e Participant Group
Yr 10 Survey
[image:18.595.144.451.72.309.2]Yr 11 Survey
Figure 4.4: Technology Makes Learning More Interesting
6 students (66%) say using technology makes them more interested in learning in school
compared with 65% of the wider Year 11 population surveyed and 65% of the wider Year 10
population surveyed.
1 student (11%) says using technology does not make him more interested in learning in
school compared with 18% of the wider Year 11 population surveyed and 18% of the wider
Year 10 population surveyed.
2 students (22%) did not know whether using technology makes them more interested in
learning in school compared with 18% of the wider Year 11 population surveyed and 18% of
the wider Year 10 population surveyed.
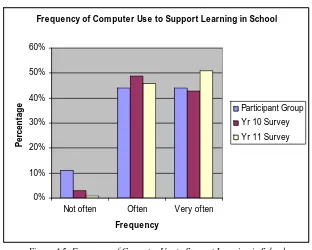
How often computers are used to support learning in school
Overall, Secondary school students reported that computers are used often or very often to
Frequency of Com puter Use to Support Learning in School
0% 10% 20% 30% 40% 50% 60%
Not often Often Very often
Frequency
P
er
cen
tag
e Participant Group
Yr 10 Survey
[image:19.595.141.453.68.318.2]Yr 11 Survey
Figure 4.5: Frequency of Computer Use to Support Learning in School
1 student (11%) reported not often using the computer to learn in school, compared with 3%
of the wider Year 11 population surveyed and 1% of the wider Year 10 population surveyed.
4 students (44%) use the computer often to learn in school, compared with 46% of the wider
Year 11 population surveyed and 49% of the wider Year 10 population surveyed.
4 students (44%) use the computer very often to learn in school, compared with 51% of the
wider Year 11 population surveyed and 43% of the wider Year 10 population surveyed.
Use of the internet to support learning in school
As Figure 4.6 shows, Secondary school students reported using the internet often or very
often to support learning in school.
Use of the Internet to Learn at School
0% 10% 20% 30% 40% 50% 60% 70%
Often Very often
Level of use
P
er
cen
tag
e Participant Group
Yr 10 Survey
Figure 4.6: Use of the Internet to Learn at School
6 students (66%) use the internet often to learn in school compared with 38% of the wider
Year 11 population surveyed and 55% of the wider Year 10 population surveyed.
3 students (33%) use the internet very often to learn in school compared with 41% of the
wider Year 11 population surveyed and 36% of the wider Year 10 population surveyed.
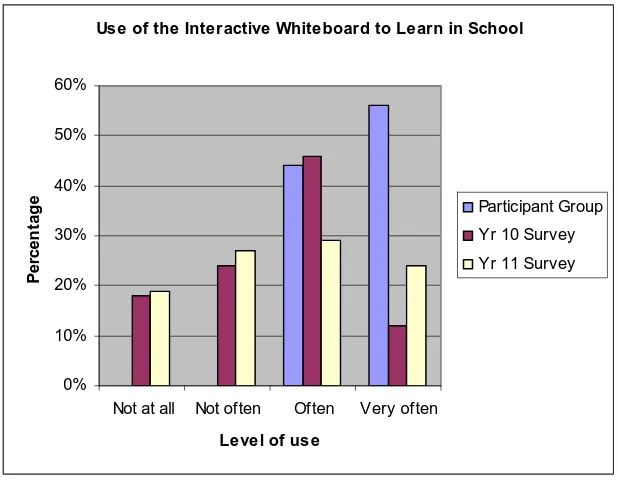
Use of the Interactive Whiteboard to support learning in school
As Figure 4.7 suggests, while the participant group reported that the interactive whiteboard
often or very often supported their learning, the findings were variable for the wider surveyed
groups.
Use of the Interactive Whiteboard to Learn in School
0% 10% 20% 30% 40% 50% 60%
Not at all Not often Often Very often
Level of use
P
er
cen
tag
e Participant Group
Yr 10 Survey
[image:20.595.143.452.256.497.2]Yr 11 Survey
Figure 4.7: Use of the Interactive Whiteboard to Support Learning in School
4 students (44%) use the interactive whiteboard often to learn in school, compared with 29%
of the wider population surveyed and 46% of the wider Year 10 population surveyed.
5 students (56%) use the interactive whiteboard very often to learn in school, compared with
24% of the wider Year 11 population surveyed and 12% of the wider Year 10 population
surveyed. It should be noted that 19% of the wider Year 11 population surveyed and 18% of
the Year 10 population surveyed reported not using the interactive whiteboard at all for
learning. Similarly, 27% of the wider Year 11 population surveyed and 24% of the Year 10
population surveyed reported not using the interactive whiteboard often for learning.
4.1.2 Specific uses of technology for learning in the Secondary
school sector
The survey findings from the participating students are compared with findings from the wider
Table 4.1: Comparative survey findings of uses of technology for learning in the participating and wider Secondary school student populations surveyed
Participating students: Year 11 (N=9)
Wider Secondary school population: Year 11 (N=109)
Wider Secondary school population: Year 10 (N=97) Technology uses
N %* N % N % Using technology to find
things out: Not at all Not often Often Very often 0 1 6 2 0 11 66 22 0 12 62 34 0 11 57 32 1 5 56 34 1 5 59 35
Using technology to solve problems:
Not at all Not often Often Very often 0 2 7 0 0 22 77 0 4 30 61 12 4 30 57 11 9 23 48 15 10 24 50 16 Using technology to sort
out ideas: Not at all Not often Often Very often 0 2 5 2 0 22 55 22 5 34 59 10 5 31 55 9 6 34 38 15 6 37 41 16 Using technology to
Make work better: Not at all Not often Often Very often 0 1 3 5 0 11 33 55 1 16 57 34 1 15 53 31 1 4 52 37 1 4 55 39 Using technology to be
critical of information: Not at all
Not often Often Very often 1 3 4 1 11 33 44 11 11 49 36 9 10 47 34 9 15 35 32 8 17 39 35 9 Using technology to
revise: Not at all Not often Often Very often 1 2 2 4 11 22 22 44 4 28 44 32 3 26 41 30 7 16 41 31 7 17 43 33 * percentage values maybe inflated due to the small sample size
Table 4.1 suggests that findings from the participating students are mainly consistent with the
wider populations surveyed. Being critical about information, sorting out ideas and problem
solving are identified as underdeveloped uses of technology for learning.
4.1.3 How FE students perceive the usefulness of technology for
learning
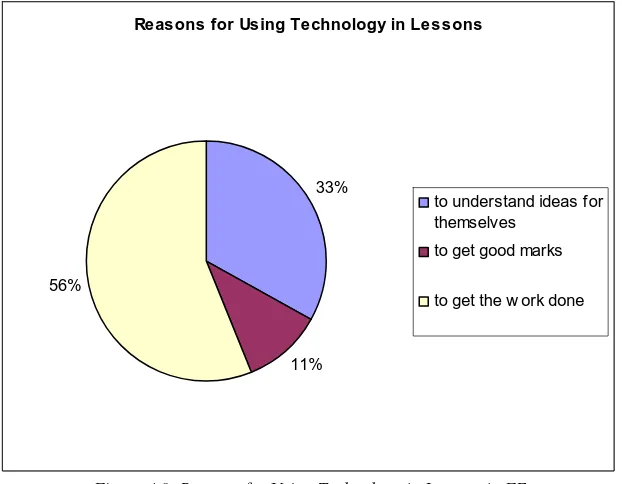
Reasons for participants’ use of technology in FE
As Figure 4.8 shows, FE students considered the main reason for using technology was to
get the work done.
Reasons for Using Technology in Lessons
33%
11% 56%
to understand ideas for themselves
to get good marks
[image:22.595.143.454.184.426.2]to get the w ork done
Figure 4.8: Reasons for Using Technology in Lessons in FE
3 students (33%) use technology in lessons to understand ideas for themselves
1 student (11%) uses technology in lessons to help to get good marks
5 students (56%) use technology in lessons to get the work done
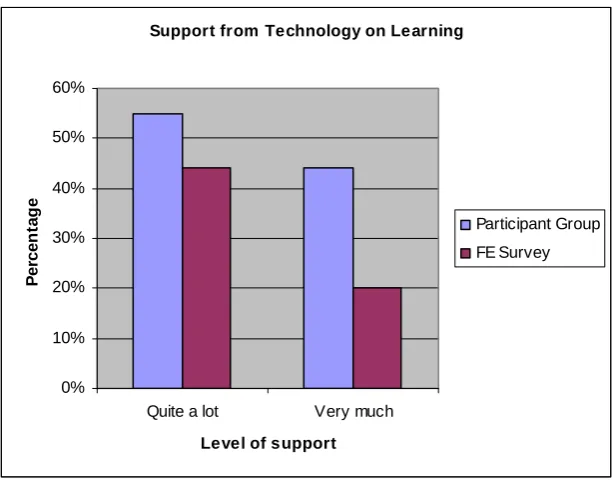
The level of support for learning provided by technology in FE
As Figure 4.9 shows, FE students consider that technology plays an important role in
Support from Technology on Learning
0% 10% 20% 30% 40% 50% 60%
Quite a lot Very much
Level of support
P
er
cen
tag
e
Participant Group
[image:23.595.144.451.72.314.2]FE Survey
Figure 4.9: Support for Learning provided by Technology in Lessons
5 students (55%) say technology helps them quite a lot to learn in lessons, compared with
44% of the wider FE population surveyed
4 students (44%) say technology helps them very much to learn in lessons compared with
20% of the wider FE population surveyed
[image:23.595.144.452.500.734.2]Enthusiasm for using technology in lessons
Figure 4.10 suggests that while FE students in the participant group are generally quite
enthusiastic about using technology to support their learning in lessons, the enthusiasm for
using technology for learning in the wider surveyed group is more variable.
Enthusiasm in Using Technology for Learning
0% 10% 20% 30% 40% 50% 60% 70%
Little enthusiastic
Quite enthusiastic
Very enthusiastic
Level of enthusiasm
P
er
cen
tag
e
Participant Group
FE Survey
1 student (11%) reports being only a little enthusiastic about learning with technology in
college, compared with 36% of the wider FE population surveyed
6 students (66%) say they are quite enthusiastic about learning with technology in college,
compared with 37% of the wider FE population surveyed
2 students (22%) report being very enthusiastic about learning with technology in college,
compared with 23% of the wider FE population surveyed
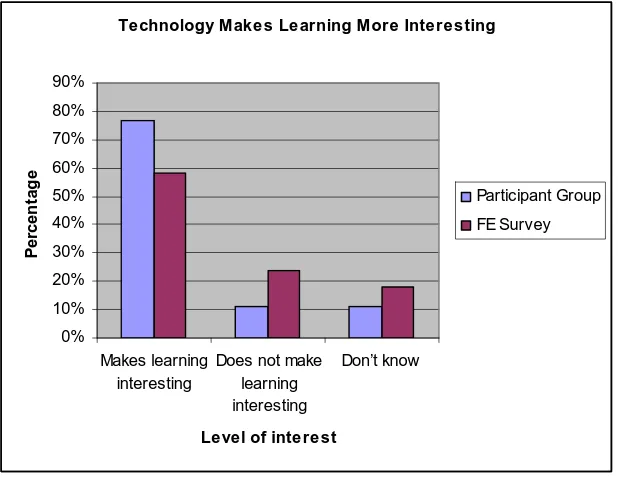
The role of technology in making learning more interesting in lesson time in FE
Overall, FE students surveyed considered that using technology made them more interested
in learning at college, as Figure 4.11 shows.
Technology Makes Learning More Interesting
0% 10% 20% 30% 40% 50% 60% 70% 80% 90%
Makes learning interesting
Does not make learning interesting
Don’t know
Level of interest
P
er
cen
tag
e
Participant Group
[image:24.595.144.453.247.486.2]FE Survey
Figure 4.11: The role of technology in making learning more interesting in FE
7 students (77%) say using technology makes them more interested in learning in college,
compared with 58% of the wider FE population surveyed
1 student (11%) says using technology does not make him more interested in learning in
college, compared with 24% of the wider FE population surveyed
1 student (11%) did not know whether using technology makes them more interested in
learning in college, compared with 18% of the wider FE population surveyed
How often computers are used to support learning in FE college
Overall, FE students reported that computers are used often or very often to support their
learning in college. The level of computer use of the participant group appeared ro exceed
Use of Com puter to Learn in College
0% 10% 20% 30% 40% 50% 60% 70% 80% 90%
Often Very often
Level of use
P
er
cen
tag
e
Participant Group
[image:25.595.144.451.73.313.2]FE Survey
Figure 4.12: Use of Computers to Learn in FE Colleges
2 students (22%) report using a computer often to learn in college, compared with 36% of the
wider FE population surveyed online
7 students (77%) report using a computer very often to learn in college, compared with 45%
of the wider FE population surveyed
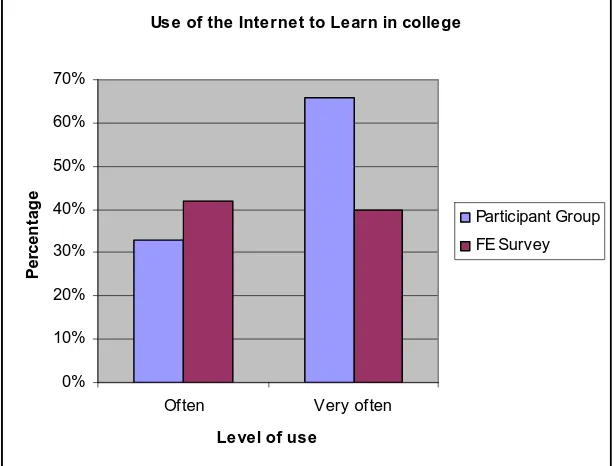
Use of the internet to support learning in FE colleges
As Figure 4.13 shows, FE students reported using the internet often or very often to support
learning in college. A higher level of use was indicated by the participant group.
Use of the Internet to Learn in college
0% 10% 20% 30% 40% 50% 60% 70%
Often Very often
Level of use
P
er
cen
tag
e
Participant Group
FE Survey
[image:25.595.144.452.484.717.2]3 students (33%) use the internet often to learn in college, compared with 42% of the wider
FE population surveyed
6 students (66%) use the internet very often to learn in college, compared with 40% of the
wider FE population surveyed
Use of the Interactive Whiteboard to support learning in FE colleges
As Figure 4.14 suggests, reported use of the interactive whiteboard was variable.
Use of the Interactive Whiteboard to Learn in College
0% 10% 20% 30% 40% 50% 60%
Not at all Not often Often
Level of use
P
e
rcen
tag
e
Participant Group
[image:26.595.145.451.210.450.2]FE Survey
Figure 4.14: Use of the Interactive Whiteboard to Learn in FE Colleges
3 students (33%) report that they do not use the interactive whiteboard at all to learn in
college, compared with 32% of the wider FE population surveyed
3 students (33%) report that they do not often use the interactive whiteboard to learn in
college, compared with 35% of the wider FE population surveyed
5 students (55%) report that they often use the interactive whiteboard to learn in college,
4.1.4 Specific uses of technology for learning in the FE sector
The survey findings from the participating students are compared with findings from the wider
[image:27.595.84.521.161.602.2]FE student population in Table 4.2.
Table 4.2: Comparative survey findings of uses of technology for learning in the participating and wider FE student populations
Participating FE students: N=9 Wider FE student population: N=81
Technology
uses N % N %
Using technology to find things out: Not at all Not often Often Very often 0 0 6 3 0 0 66 33 1 4 22 51 1 5 28 65 Using technology to
solve problems: Not at all Not often Often Very often 0 3 4 2 0 33 44 22 1 18 42 17 1 23 54 22
Using technology to sort out ideas: Not at all Not often Often Very often 0 1 6 2 0 11 66 22 3 35 28 12 4 45 36 15
Using technology to Make work better: Not at all Not often Often Very often 0 0 2 7 0 0 22 77 1 12 45 20 1 15 58 26
Using technology to be critical of information: Not at all Not often Often Very often 0 4 3 2 0 44 33 22 11 29 23 14 14 38 30 18
Using technology to revise: Not at all Not often Often Very often 1 1 5 2 11 11 55 22 5 17 31 25 6 22 40 32
4.1.5 How HE students perceive the usefulness of technology for
learning
Reasons for participants’ use of technology in HE
As Figure 4.15 shows, HE students considered the main reasons for using technology was to
Reasons for Using Technology in Lessons
to understand ideas for themselves
[image:28.595.142.454.70.317.2]to get the w ork done
Figure 4.15: Reasons for Using Technology in Lessons in HE
2 out of 7 students say they use technology on their course to understand ideas for
themselves.
2 out of 7 students say they use technology on their course to get the work done. The
students did not identify using technology to get good marks.
[image:28.595.141.453.479.723.2]The role of technology in learning
Figure 4.15 shows that HE students consider technology plays an important part in learning
on their courses.
Technology Plays an Im portant Part to Learn in HE
0% 20% 40% 60% 80% 100% 120%
Yes Not sure
Perceived as im portant
P
er
cen
tag
e
Participant Group
HE Survey
All participating students say technology has played an important part in their learning on their
course compared with 95% of the wider HE student population surveyed, of which 5% were
unsure.
Use of the Interactive Whiteboard to support learning in HE
As Figure 4.16 suggests, the interactive whiteboard was reported to play an important role in
students’ learning in HE.
Im portance of the Interactive Whiteboard in supporting Learning HE
0% 10% 20% 30% 40% 50% 60% 70% 80%
Important Very important
Im portance
P
er
cen
tag
e
Participant Group
[image:29.595.143.454.211.451.2]HE Survey
Figure 4.17: Importance of the Interactive Whiteboard in supporting Learning HE
5 students (72%) report that the interactive whiteboard is important in supporting their
learning, compared with 49% of the wider HE student population surveyed.
2 students (28%) report that the interactive whiteboard is very important in supporting their
4.1.6 Specific uses of technology for learning in the HE sector
The survey findings from the participating students are compared with findings from the wider
HE student population in Table 4.3.
[image:30.595.93.502.165.695.2]
Table 4.3: Comparative survey findings of uses of technology for learning in the participating and wider HE student populations
Participating HE students: N=9
Wider HE student population: N=69
Technology uses
N % N %
Using technology to learn facts: Not at all Not often Often Very often 0 0 4 3 0 0 57 43 1 9 27 32 2 13 39 46
Using technology to find things out (enquire and investigate): Not at all Not often Often Very often 0 0 2 5 0 0 28.5 71.5 0 4 11 54 0 6 16 78
Using technology to solve problems: Not at all Not often Often Very often 0 2 2 3 0 28.5 28.5 43 0 10 23 36 0 15 33 52
Using technology to structure ideas: Not at all Not often Often Very often 0 2 2 3 0 28.5 28.5 43 2 18 27 22 3 26 39 32
Using technology to make work better (correct and improve): Not at all Not often Often Very often 0 3 1 3 0 43 14 43 1 8 21 39 2 11 29 58
Using technology to be critically evaluate ideas/ information: Not at all Not often Often Very often 0 1 5 1 0 14 71.5 14 3 15 29 21 4 22 43 31 Using technology to
revise: Not at all Not often Often Very often 0 1 4 2 0 14 57 28.5 7 20 17 25 10 29 25 36
4.1.7 Summary of survey findings for the 3 educational sectors
Two approaches were taken to analysing the survey findings. The first approach looked at the
• Technology often and very often helps to find things out in the Secondary school, and
FE and HE sectors
• Technology often helps students to sort out their ideas and to solve problems in the
three educational sectors
• Overall, technology often or very often helps them to make their work better in the
three educational sectors
• While the majority of participating students in all three educational sectors say that
they often or very often use technology to be critical, a large minority each sector say
that this happens not often or not at all
• Technology often and very often helps students to revise in each educational sector.
The second approach looked at the minority responses to ensure that student voice is
faithfully represented and to identify possible areas where the potential of technology for
supporting learning could be explored and developed further.
A summary of the minority responses that appear to have particular significance is presented
in Table 4.4.
Table 4.4: Summary of participants’ views of how the technology supports their learning in taught sessions in the Secondary school, FE and HE sectors: minority responses
Secondary Sector
1 student (11%), 33% of the wider year 11 population surveyed and 29% of the wider Year 10 population surveyed report being only a little enthusiastic about learning with technology in school; 12% of the wider year 11 population surveyed and 6% of the wider Year 10 population surveyed report being not at all enthusiastic about learning with technology in school
1 participating student (11%), 18 % of the wider Year 11 population surveyed and 18% of the Year 10 population surveyed say using technology does not make them more interested in learning in school;
2 participating students (22%), 28% of the wider Year 11 population surveyed and 24% of the wider Year 10 population surveyed say technology does not often help them to solve problems;
2 participating students (22%), 31% of the wider Year 11 population surveyed and 37% of the Year 10 population surveyed say that technology does not often help them to sort out their ideas;
1 participating student (11%), 10% of the wider Year 11 population surveyed and 17% of the Year 10 population surveyed says that technology does not help them at all to be critical of information;
3 participating students (33%), 47% of the wider Year 11 population surveyed and 40% of the Year 10 population surveyed say technology does not often help them to be critical of information;
FE Sector
I participating student (11%) and 36% of the wider FE population surveyed report being only a little enthusiastic about learning with technology in college;
While 7 participating students (77%) and 58% of the wider FE population surveyed say using technology makes them more interested in learning in college, 1 participating student (11%) and 24% of the wider FE population surveyed say using technology does not make them more interested in learning in college;
3 students (33%) and 32% of the wider FE population surveyed report that they do not use the interactive whiteboard at all to learn in college;
3 students (33%) and 35% of the wider FE population surveyed report that they do not often use the interactive whiteboard to learn in college;
3 participating students (33%) and 23% of the wider FE population surveyed say that technology does not often help them to solve problems;
1 participating student (11%) and 45% of the wider FE population surveyed say that technology does not often help to sort out ideas;
4 participating students (44%) and 38% of the wider FE population surveyed say that using technology does not often help them to be critical about information;
HE Sector
2 participating students (28.5%) and 15 % of the wider HE student population surveyed say technology does not often help them to solve problems;
2 participating students (28.5%) and 26% of the wider HE student population surveyed say that technology does not often help them to structure their ideas;
1 participating students (14%) and 22% of the wider HE student population surveyed say technology does not often help them to critically evaluate information and ideas
3 participating students (43%) and 11% of the wider HE student population surveyed say that technology does not often help them to improve their work
Table 4.4 indicates consistencies between the Secondary school, FE and HE sectors in
participants’ views of how the technology supports their learning in taught sessions. For a
significant minority of students, technology is consistently not often used to solve problems,
sort out and structure ideas, or to be critical about information and ideas although this way of
using technology to support student’s learning reportedly increases across the educational
sectors.
4.1.8 Quantitative Findings from observations made whilst
shadowing students
The total number of taught sessions observed was 77. The number of taught sessions
observed in each sector was: -
• Secondary = 36 (including 2 lessons on computer-related courses) • FE = 26 (including 7 lessons on computer-related courses) • HE = 15
Quantitative analysis from observations focussed on the following:
The amount and percentage of taught curriculum time learning technology is used as a tool
for learning, and differences within and across educational sectors; the amount and
percentage of taught curriculum time students spend using different learning technologies,
and differences within and across educational sectors. The findings are presented in Table
[image:32.595.135.460.569.770.2]4.5.
Table 4.5: Quantitative findings from observations
Statistics from data Secondary
school sector
FE sector HE sector
Number of taught sessions using technology to support learning
22 19 10
Percentage of lessons observed in which technology was used to support learning
61 73 66
Percentage of lessons observed in which technology was used to support learning (not computer-related courses)
59 50 67
Average (mean) no. of minutes per session using technology to support learning
Average (mean) no. of minutes per session using technology to support learning
(not computer-related courses)
37 40 61
Average (mean) % time per lesson using technology to support learning
63 64 71
Average (mean) % time per lesson using technology to support learning
(not computer-related courses)
61 55 71
Number of taught sessions
for IWB 12 4 10
Average (mean) minutes
per session for IWB 31 24 61
Average (mean) % time
per session for IWB 51 34 71
Number of taught sessions
using computer 12 15 0
Number of taught sessions using computer
(not computer-related courses)
10 8 1
Average (mean) minutes
for computer 45 46 40
Average (mean) minutes for computer
(not computer-related courses)
43 47 40
Average (mean) % time
per lesson for computer 70 68 38
Average (mean) % time per lesson for computer (not computer-related courses)
70 64 38
The results in Table 4.5 show that learning technology is used more often in taught sessions
that are not computer courses in the Secondary schools than in the FE colleges. The use of
the interactive whiteboard as a support for learning was observed more frequently in taught
sessions in the Secondary schools than in the FE colleges and most often in taught sessions
in HE courses as PowerPoint presentations. One observation was made of students using
computers in taught sessions in the HE setting.
4.2. Qualitative Findings
Qualitative analysis of data obtained from student lesson logs and from lesson observations
focussed on learner voice and cognitive–empirical analysis to investigate learner strategies
using learning technology in taught sessions. Data analysis produced findings in the following
four areas: -
2. The cognitive learning strategies (CLS) (describe, explain, explicate, evaluate, argue,
predict, define) students use when learning with technology in taught curriculum time.
3. The active learning strategies (ALS) students use to structure, elaborate and restructure
information, ideas and concepts in response to the input/learning experiences in taught
sessions.
4. The learning outcomes in taught sessions resulting from the learner strategies. It does not
seem unreasonable to suggest that the learning outcomes might be directly or indirectly
associated with observed learner strategies. However, there is a need for further research
to explore more fully the relationship between learner strategies and learning outcomes
that might be observed or otherwise captured.
Separate results were obtained from observations of Interactive Whiteboards and computers
supporting learning for the different educational sectors (Secondary school, FE and HE). A
distinction was made between taught sessions in computer-related courses and in the use of
ICT across the curriculum (ICTAC). Findings in the four areas identified above are reported in
the following sections.
4.2.1 Participants’ perceptions of how the technology supported
their learning in taught sessions: Evidence (Logs)
It was possible to group students’ perceptions of how technology supported their learning in
the following ways: informative, instructional, procedural, explanatory, reflective/evaluative,
and other ways that students might identify. The informative category was where technology
provided information such as fact or opinion. The instructional category was for support in the
form of instructions for learning. Procedural support referred to how a specific personal
learning aim or objective may be achieved or how a learning need might be met.
Explanatory support helps the learner to understand the learning content in terms of reasons
why, procedures describing how, and relationships defining a concept event or artefact.
Reflective/evaluative support helps the learner to consider the learning content from an
interpretative and critical stance.
While the category ‘other’ was used to capture additional ways that students might consider
technology as a support to their learning in taught sessions, none were found. Students’
perceptions are grouped as informative, instructional, procedural, explanatory and
Table 4.6: Participants’ perceptions of how the technology supported their learning in the Secondary school, FE and HE sectors
Secondary sector Technology : IWB
Student perceptions: how the interactive whiteboard supported learning
Informative
It gave me a picture to imagine everything that was going on, which made it easier to learn (Jack, RE)
Showed examples and images of what (guerilla) war would have been like (Vietnam) (Joseph, Hi)
Putting things in order and suggesting a good way of presenting (instructions for preparing a meal) (Cheryl, Food Technology)
Illustrating in an understandable way; I could see video that I wouldn’t be able to see for real (Ellie, Science: reactivity of alkaline metals, cesium)
Showed examples of the work and it moved (dynamic representations of moving averages) (Justin, Maths)
Instructional
Even though the teacher was telling me the tasks I was able to read the tasks so I could understand it more (Jack, Applied Sc)
Told us the aims of the lesson and how to set up and complete an experiment (Cheryl, Sc)
Procedural
It quickened the speed (of my learning). (Jack, Ma)
It helped me to write my notes down and with my ideas (Jane, En Lit)
Improved my listening skills and showed phrases in French. It made it easy to copy down the phrases (Heather, French)
Explanatory
The diagrams explained easier. (Jack, Ma)
Explained ideas (how brightness helps us to find out how far away a star is) (Joseph, Physics)
Reflective/evaluative
No examples given
Secondary sector Technology: Computer
Student perceptions: how the technology supported learning
Informative
(Finding) personal opinions and evidence to support my work (Cheryl, Sociology)
Collected information using macromedia Fireworks and the school server, and excel to produce graphs (about the effects of tourism on a locality) (Heather, Geography)
Used collection of digital photos to find examples of how tourism is managed and sustained (Jonathan, Geography)
Instructional
No examples given
Procedural
To create accurate measurements for (decorative) wings and how to do extra things (Katie, Graphics)
To complete a media English assignment using Microsoft word; this helped with my spelling, correct use of technical accuracy and paragraph structure (Cheryl, En)
Editing and making the course work look neater (Ellie, Sociology) Showed me how to do different textures on an image (Jane, DIDA) To learn other (key) skills (Jane, DIDA)
Explanatory
Cleared any misunderstandings I had (about past and future tenses) (Katie, French)
Reflective/evaluative
I was able to go back to the video and look at things over and over again before answering the questions (Jack, Sports analysis)
FE Sector Technology: IWB
Student perceptions: how the computer supported learning
Informative
Seeing the (orchestral) performance (on YouTube) helped to give a better understanding of the piece (Justin, Music) Showed me lots of things about what it is like to live with autism (Megan, Psychology)
To watch EYFS DVD (Jenny, Child Care and Education)
Instructional
No examples given
No examples given
Explanatory
No examples given
Reflective/evaluative
No examples given
FE Sector Technology: Computer
Student perceptions: how the technology supported learning
Informative
Quick access to a number of documents, clearly set out (Justin, History)
Provided information from the internet; provided software to write-up my work (Jenny, Child Care and Education) To finish a systems requirements poster using Microsoft Word and Photoshop, and to check some old work for definition of RAM (Kerry, IT Btech)
To research a website (Kerry, IT Btech)
Instructional
No examples given
Procedural
To complete the work set (If I wasn’t on the computer I would have been unable to complete the work I completed) (James, Computer studies)
To transfer printed data to the computer so I could edit it (UK confectionary Value 2002-2007) (James, Business Studies)
To create an evaluation of my presentation, to organise and develop my thoughts and organise the sections (of my assignment) correctly (Megan, Health and Social Care)
To write a report on IT troubleshooting, helped me with spellings (Imran, Btech IT)
Quick way of getting work typed in, and also a better way of presenting it with colour, bullet points etc (Candy, Leisure and Tourism)
Photoshop allows me to crate the perfect and aimed effect of the images in a quick interesting way (Candy, Photography)
Explanatory
To develop what we have learned in class through using the internet to extend my knowledge (of titration) (Megan, Applied Science)
Reflective/evaluative
No examples given
HE Sector Technology: IWB
Student perceptions: how the interactive whiteboard supported learning
Informative
As well as my tutor talking, I could see it in black and white and was given a copy (Sadie, Youth and Community) It lead the lesson and showed what we were doing (ratio analyses in accounting) (Holly, International Business Studies)
Easy to refer to, not too much note taking (because the presentation was downloaded from Blackboard prior to the lecture), supplement learning (Jasmine, Law)
I could write down the notes that I needed (Avril, Law)
To look at information on black minority ethnic (BME) communities (Kerry, Youth and Community Work) It enabled each slide to be viewed and discussed individually (Tariq)
Instructional
To find out how my assignment needs to be set out (Sadie, Youth and Community Work) Developed my understanding of the assignment brief (Kerry, Youth and Community Work)
Procedural
No examples given
Explanatory
It explained and clarified new information and helped me to develop my understanding (Kerry, Youth and Community)
Reflective/evaluative
No examples given
Other
It enables the teacher to interact with the students (Tariq, Pharmacuetical Science)
HE Sector Technology: Computer
Student perceptions: how the computer supported learning
No examples given
Instructional
I was able to download work (Statistics handout with tasks) (Holly, International Business Studies)
Procedural
No examples given
Explanatory
No examples given
Reflective/evaluative
[image:37.595.83.512.71.204.2]No examples given
Table 4.6 shows that students in all three educational sectors perceive the use of the
interactive whiteboard to be mainly informative. Few explanatory or reflective/evaluative uses
are identified in reference to taught sessions. Students in all three educational sectors identify
the computer’s main focus of support as developing procedural knowledge. As with findings
for the interactive whiteboard, few explanatory or reflective/evaluative uses of the computer
are identified with taught curriculum time.
4.2.2 Findings for cognitive learning strategies (CLS), active
learning strategies (ALS) and learning outcomes
Cognitive learning strategies (CLS) were identified as describing, explaining, explicating
(clarifying), evaluating, arguing (challenging or defending information or ideas), predicting,
and defining evidenced in students’ talk and writing/word processing. The findings are
presented below for the different educational sectors (Secondary school, FE and HE), course
type and technology used in taught sessions. Active learning strategies (ALS) were identified
as observed behaviours that support the learner in structuring, elaborating and restructuring
their knowledge and understanding. Structuring is organising information or ideas into a
coherent meaning. Elaborating is introducing additional information from other sources
(through questioning/searching) to support and develop knowledge or understanding.
Restructuring is adapting or changing understanding or an artefact of learning in response to
new information or ideas.
The analysis of active learning strategies (ALS) was informed by the descriptors of learner
engagement identified by Pianta et al (2007). Tables 4.7 to 4.14 show participants’ cognitive
learning strategies (CLS), active learning strategies (ALS) and learning outcomes observed in
the various taught sessions during the observation periods.
Findings are presented separately for the different learning technologies, lesson/course types
and educational sectors. The focus of each taught session, the cognitive learning strategies
Table 4.7: Cognitive learning strategies (CLS), active learning strategies (ALS) and learning outcomes using the computer in computer-related courses: Secondary School sector
Participant Subject Cognitive
Learning Strategy (CLS) Active Learning Strategy (ALS) Learning outcome Jane Jane Jon Key Skills DIDA DIDA Describe
Describe & evaluate
Describe & evaluate
Structures through manipulating ideas using Microsoft Word
Structures through manipulating ideas using Adobe Photoshop
Structures through; grouping information into categories
Elaborates through , reading previous notes on evaluation of planning section for portfolio, reflecting on peer evaluation, discusses with teacher the
requirement to clarity and signpost and link to other sites
Restructures through re-presenting /transforming the text by changing the Word document to HTML through Flashpaper and converting to PDF
How to use landscape for a grid (P)
Learned different skills (creating different textures on an image) for creating a PowerPoint (P)
How to change a word document into a web page (P)
Identified areas of weakness in the project (detail, signposting, clarity of purpose for each section) (Ref/Eval)
Focus of the taught sessions:
Jane, Key Skills: To create a grid for competition fixtures
Jane, DIDA: Creating a PowerPoint page for the artefact component of her assignment Jon, DIDA: Creating an e-portfolio
CLS: describing, evaluating
ALS: manipulating ideas, grouping information into categories, reflecting on peer evaluation, discussing with teacher, re-presenting and transforming ideas and text, composing and editing
Table 4.8: Cognitive learning strategies (CLS), active learning strategies (ALS) and learning outcomes using the computer across the curriculum: Secondary School sector
Participant Subject Cognitive
Learning Strategy (CLS) Active Learning Strategy (ALS) Learning outcome Jack Katie Cheryl PE Graphics English
Describe, explain & evaluate Describe, evaluate, Evaluate Structures through manipulating and deconstructing learning materials (video)
Elaborates through reflecting on personal skill level and technical ability
Restructures through applying analysis to another sport video
Structures through manipulating software, consulting the teacher and consulting /sharing ideas with peers
Structures through manipulating text using Microsoft word
How to deconstruct a sports video for performance analysis (P)
How to solve a graphics design problem (P)