2017 2nd International Conference on Computational Modeling, Simulation and Applied Mathematics (CMSAM 2017) ISBN: 978-1-60595-499-8
Theoretical and Case Study on Multiple Equal Part Linear Regression
Zu-chang
ZHONG, Xue-ying CHEN, Hui-Ling Yang,
Gang WANG
and Wen-Tsao PAN
School of Business, Guangdong University of Foreign Studies, China
Keywords: Extreme value, Multiple regression analysis, Equal part linear regression, GNP.
Abstract. This paper is to propose a new concept, which is called the Multiple Equal Part Linear Regression, in which the analysis data are divided into several equal parts and then the linear regression model is built up. This way, we will be able to observe the trend of sample data in each equal part. Difference comparison can be made with the general standard linear regression model.
Introduction
Multiple regression analysis is an important analyzing method, and it is now widely applied in various fields (Watanabe, 2014; Lu, 2009; Xiong Youlin, 2014; Zhou Xiaojuan, 2013). In the statistics, multiple linear regression model (LRM) uses the least squares function of the linear regression equation to model the relation between one or several independent variable (X) and dependent variable. When the linear regression model is used to analyze data with general normal distribution, the analysis and prediction results can be ideal. However, there will usually be extreme value data in real data. Such extreme value data are objects that are emphasized by the researchers of social science. If the linear regression model is used to summarize such extreme value by the average value, the study results will be distorted. However, the model currently used to solve the extreme value data issue mostly adopts the quantile regression model of Professor Koenker (1978). In addition, the concept of quantile is new to most of us (Yu, 2011; Li, 2011; Huang, 2015; Zhang, 2009). The quantile regression model is more complicated than and not as comprehensible as the linear regression model. Furthermore, the modeling is not easy. Specific software is needed. Therefore, in this paper, we refer to Pan (2017) using Multiple Equal Part Linear Regression Model (EPLRM), in which the analysis data are divided into several equal parts to build the linear regression model. This way, the model trend of each equal part can be independently observed. It can be compared with the general linear regression.
Equal Part Linear Regression Model
Assume y is a continuous dependent variable dependent on x. The standard linear regression model can be expressed as:
yi = β0+ β1xi+ εi
Therefore, we should build fit linear regression model for the 3 data points in different equal parts. The 3 equal part linear regression equation can be expressed as:
yiτ = β0τ+ β1τxiτ+ εiτ The least square estimator:
β̂0τ=∑ (xi
τ− x̅τ)(y
iτ− y̅τ) n
i=1
∑n (xiτ− x̅τ)2 i=1
(β̂iτ− tα/2× sβ̂t, β̂i τ
+ tα/2× sβ̂t),i=0,1
Symbol “t” is added at certain points in the equation.
Case Study
Building of 3 Equal Part Linear Regression Models
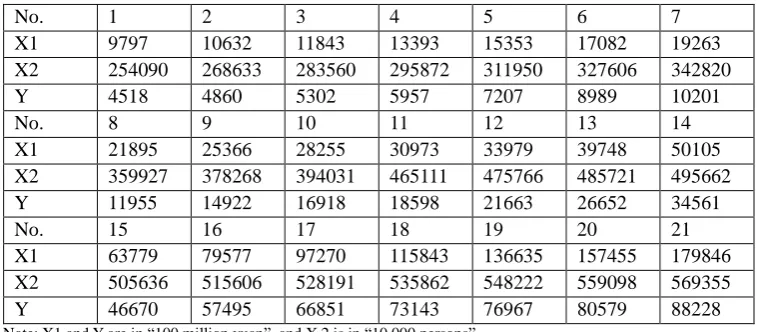
In the simple real case, this paper uses the GPD of mainland China to carry out factor analysis. The input of fixed assets stock (X1), input of human capital stock (X2) and GDP (Y) are taken as the study objects. Discussion mainly focuses on input of fixed assets stock and input of human capital stock of the government, as well as their impact on GDP. In this paper, a group of sample data of 21 years are extracted from the China Statistical Yearbook, as shown in Table 2.
Table 2. Test Data of Multiple Equal Part Linear Regression Model.
No. 1 2 3 4 5 6 7
X1 9797 10632 11843 13393 15353 17082 19263 X2 254090 268633 283560 295872 311950 327606 342820 Y 4518 4860 5302 5957 7207 8989 10201
No. 8 9 10 11 12 13 14
X1 21895 25366 28255 30973 33979 39748 50105 X2 359927 378268 394031 465111 475766 485721 495662 Y 11955 14922 16918 18598 21663 26652 34561
No. 15 16 17 18 19 20 21
X1 63779 79577 97270 115843 136635 157455 179846 X2 505636 515606 528191 535862 548222 559098 569355 Y 46670 57495 66851 73143 76967 80579 88228
Note: X1 and Y are in “100 million yuan”, and X 2 is in “10,000 persons”.
[image:2.595.108.487.252.418.2]At first, this paper carries out analysis with the equal part linear regression of sample points. The binary regression is used to respectively discuss the impact of X1 and X2 on GDP (Y). The X1 is placed in a small-to-large order, and at the same time, a standard linear regression model and 3 multiple equal part linear regression models are built up. There are a total of 21 sample points, and each equal part contains 7 sample points, Table 3 shows the analysis results of the standard linear regression model and 3 multiple equal part linear regression models built based on X1 and X2. We find that in the multiple equal part linear regression model, X1 in the standard linear regression model will pose a significant impact on GDP (Y). As for the multiple equal part linear regression models, the impact at the first equal part (τ=1) and the second equal part (τ=2) is considerable, but that at the third equal part (τ=3) is not prominent. This means that the input of fixed assets stock (X1) does not pose a great impact on GDP (Y) in the high equal part. If the standard linear regression model is used for analysis, such a special circumstance can not be observed.
Table 3. Statistics results of analysis of four binary linear regression model.
LRM R2=0.975
EPLRM τ=1 R2=0.986
EPLRM τ=2 R2=0.999
EPLRM τ=3 R2=0.973
Stat. Conf. T Sig. Conf. T Sig. Conf. T Sig. Conf. T Sig. X1 0.43 11.40 *** 1.12 3.60 ** 0.83 27.14 *** -0.59 -1.34 - X2 0.07 3.71 *** -0.06 -1.63 * 0 -0.78 - 1.68 2.10 *
Note: *indicates 10% significance level; **indicates 5% significance level; ***indicates 1% significance level.
equal part. If the standard linear regression model is used for analysis, this special circumstance can not be observed.
[image:3.595.68.530.191.244.2]Table 4 shows the difference examination between groups carried out for original data in this paper. F examination is carried out respectively for data of each equal part, Y/X1 and Y/X2. Table 4 shows that in the multiple equal part linear regression model, there is significant difference between the first equal part and third equal part of X1 and between the third equal part and second equal part. Therefore, further detailed analysis is required.
Table 4. F Examination of Difference between Different Equal Parts.
Variable τ1 − τ2 τ2 − τ3 τ1 − τ3
F_value Sign. F_value Sign F_value Sign
X1 0.8478 - 0.1981 ** 0.1679 **
X2 0.1695 ** 0.6045 - 0.1024 **
Note: *indicates 10% significance level; **indicates 5% significance level; ***indicates 1% significance level.
Drawing the Equal Part Linear Regression Line and Confidence Interval
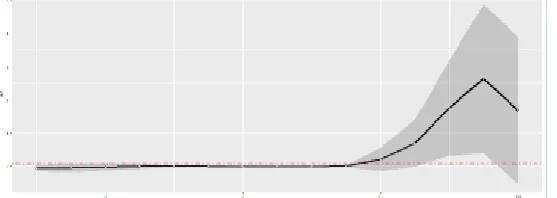
[image:3.595.163.435.321.439.2]This paper will further move the 7 data points of multiple linear regression leftwards horizontally by 1 X coordinate point. One regression line is drawn for each move. The coefficient and confidence interval of X1 and X2 are drawn, as shown in Fig. 1 and 2.
Figure 1. Four Linear Regression Lines Based on X1 and Y and 95% Confidence Interval.
[image:3.595.162.441.606.705.2]Fig. 1 shows the trend of the X1 coefficient and confidence interval. The thick solid line in the middle represents LRM and the thick dotted lines in the upper and lower parts represent the confidence interval of LRM. The irregular thin solid line in the middle represents EPLRM. The irregular grey parts represent the confidence interval of EPLRM. According to Table 2, we figure out that X1 is the most prominent in the first equal part (τ=1) and the second equal part (τ=2). It can be clearly seen in the figure that if the standard linear regression is used in the first and second equal parts for estimation, there may be underestimation; if the standard linear regression is used in the third equal part, there might be overestimation. This means that insufficient input of fixed assets stock will result in noticeable decrease of GDP. It is suggested that the government input fixed assets stock to considerably facilitate growth of GDP in China.
Figure 2. Four Linear Regression Lines Built Based on X2 and Y and 95% Confidence Interval.
government is willing to input human capital stock, growth of GDP in China can be greatly stimulated.
Conclusion and Suggestions
In this paper, a new regression modeling method is proposed. Compared to the quantile regression model which is widely used now, this method is more comprehensible and analysis will be easier. As the sample data used in the case study are only for simple test to describe the building of multiple equal part linear regression model, the data of 21 years extracted from China Statistic Yearbook are used only. However, while determining the equal part data, X variable or Y variable can be used for such division. The equal part number can be adjusted according to the study demand. If there are too many sample data, the work amount of building the equal part linear regression will be enormous. It is suggested that the building of equal part linear regression line be systematized, so as to easily build an equal line linear regression model.
Acknowledgment
The research is supported by the innovative entrepreneurship training program for college students, National Natural Science Foundation of China (71673064), Humanities and Social Sciences Planning Project of the Ministry of Education (13YJC630240), Soft Science Project of the Science and Technology Program of Guangdong Province (2013B070206058, 2015A070704054), Outstanding Youth Fund Project of Education Department of Guangdong Province (2014WTSCX040), Soft Science Project of the Science and Technology Program of Guangzhou 470 (2014Y430009).
References
[1] Watanabe, S., Nakamura, A. and Juang, B.H. (2014). Structural Bayesian Linear Regression for Hidden Markov Models, Journal of Signal Processing Systems, Vol.74, No.3, pp.341-358.
[2] Lu, J. and Wang, R. (2009). An enhanced fuzzy linear regression model with more flexible spreads, Elsevier North-Holland, Inc. Vol.160, No.17, pp.2505-2523.
[3] Zhao, B.F., Hou, Y.G. and Wen, Z.J. (2011). An Improved Multiple Linear Regression Model of Air Conditioning Load Prediction, Refrigeration Air Conditioning & Electric Power Machinery, Vol.32, No.4, pp.49-51.
[4] Xiong, Y.L. (2014). The Main Component of Linear Regression Coefficients of Pathological Model: Ridge Regression Estimate, Shuxue Xuexi Yu Yanjiu, Vol.9, pp.121-121.
[5] Zhou, X.J., and Jing Z.Y. (2013). Empirical Analysis of Logistics Demand Forecasting of Hebei Based on Multi-Linear Regression Model, Logistics Technology, Vol.32, No.9, pp.270-272.
[6] Yu. R.Y. and Rue, H. (2011). Bayesian inference for additive mixed quantile regression models, Computational Statistics & Data Analysis, Vol.55, No.1, pp.84-96.
[7] Li, P., Ren Y. (2011). Analysis of Quantile Regression about the Relationship between Price and Volume of China Stock Markets, Application of Statistics and Management, Vol.6, pp.1097-1103.
[8] Huang, F.F. and Hu H.C. (2015), Analysis of the Influence Factors of China’s Tourism Income-Based on Principal Component Regression, Statistics and Management, Vol.2, pp.46-48.
[10] Koenker, R.W. & Bassett, G. 1978, Regression Quantile, Econometrics, Vol.46, No.1, pp.33-50.