2017 2nd International Conference on Communications, Information Management and Network Security (CIMNS 2017) ISBN: 978-1-60595-498-1
Software Vulnerability Prediction Models Based on Complex Network
Xiao-lin ZHAO
1,*, Quan-bao CHEN
1, Jia-tong GAO
1,
Xian-hua ZHANG
2and Jian-yang DING
11
School of Software, Beijing Institute of Technology, Beijing 100081, China
2
Beijing Aerospace Control Center, Beijing 100094, China
*Corresponding author
Keywords: Complex networks, Software vulnerability prediction, Machine learning, Random forest.
Abstract. Recently, the software has been developed increasingly. It is more and more difficult to find software vulnerabilities. Therefore, this paper proposes a software vulnerability prediction model based on the complex network. This model regards the software defect evaluation as three classifications or regression sub-problems, including the defects in each class, software defect severity evaluation and software defect priority evaluation. This model uses machine learning method to train complex network feature, object-oriented feature and structure feature. The model can evaluate software defects on the hierarchy of class and assess software vulnerability effectively. An experiment on Hibernate is carried out, which selects random forest model as each sub-model. The experiment shows that the model is valid and accurate to evaluate vulnerability.
Introduction
Nowadays, although the Internet is more popular, cyberspace security issues are being more serious. It is very necessary to protect the security on the network, software and host. However, the potential software defects within the software system are increased sharply due to the scale and complexity of the software [1]. Now the prediction and discovery of software defects are of great significance of security of the software and system. Software vulnerability is one of the main causes of the information security. It is an important purpose of cyberattack and defense [2]. It is very important to discover and utilize the software vulnerabilities in the information security [3].
The traditional software defect evaluation is mainly based on experience, such as code line measurement, the complexity of the amount of meta and circle. Basili used object-oriented measurement method namely, C&K [4] to measure software defects.
Complex networks play an important role in the discovery of software defects. Complex networks are used to describe the software structure of finding the possibility of software vulnerabilities. It is the most important structure the huge number of edges and nodes in the complex network. Nodes can be used to represent something in the real world, and paper uses each entity class object as nodes. Arc is used to represent the complex relationship between an object and another object. Complex networks have their specific degree power-laws feature [5] and small-world features [6]. We can parse the source code or decompile the class file to obtain the original class object, aim to build the entire software network structure. There are some tools to detect software structure, such as Jode [7]. There are two important properties of the complex network, PageRank [8] and betweenness centrality [9] which used to predict the defect. But it is not enough to describe the software network which replying on the characteristics of complex networks. Because the smallest structure of the complex network is a class. if the development language is not object-oriented type, the defects within the class can’t be found.
a great impact of the software network [11]. Wang Beiyang [12] analysis software networks nodes impact on complex software system.
There are many features that can be extracted in complex the network analysis. MaWangWangying [13] mainly used the PageRank and betweenness centrality as the feature to detect software severe. It is difficult to describe the complexity to the software system.
The paper tries to find possible vulnerabilities in the software. We collect the three different characteristics of the history update record of the training set software, use the machine learning to train to get the classifier, and use the current software to test the model results
Shivani Gupta et al. [14] used in the four different measures, which is too small, and the algorithm is in the class overlapping. Taek Lee [15] expected that future defected prediction models will use more information about developers' direct and micro-level interactions to improve defect prediction. Some software source code can’t be obtained or the developer can’t be contacted.
It is a much interesting to uses cost-sensitive neural network to predict software defect. However, this article is not a description of which part has defected clearly [16].
Zeeshan Ali Rana et al. [17] associated relationship between software product metrics and software defects to improve Naive Bayes classifier. It is good to predict software defect.
The paper develops a model, which constructs the software networks form the class level and combine three measurement methods of structured program measurement, object-oriented metric and complex network feature measurement. The model can measure the security of software system and predict and evaluate defect distribution.
Comparison of Software Defect Metrics
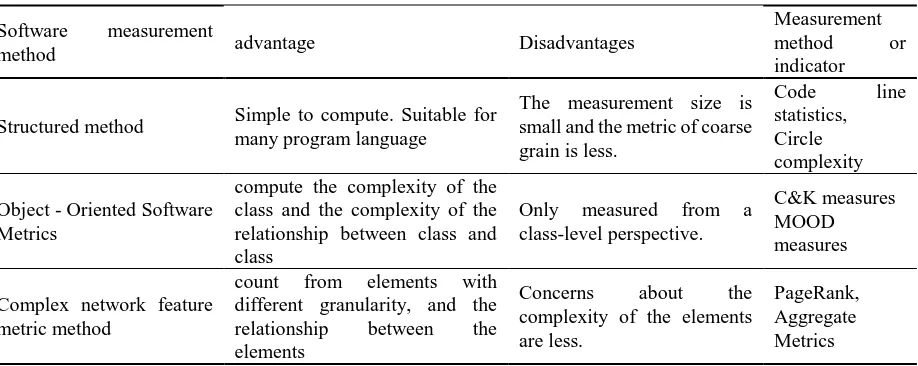
[image:2.595.72.531.528.711.2]As shown in Table 1, there are three constructional types of features to measure vulnerabilities from the 1960s to the present. First, it is the constructional feature to measure software, such as the number of lines of code and the loop complexity of the code execution path. They are too simple to calculate defect. Second, it is an object-oriented feature; its disadvantage is that the vulnerability within the class can’t be found. At last, it is the complex network features, such as PageRank and betweenness centrality. We can reduce the shortcomings of three different constructional features by the combination of features of the three structural types. The paper proposes a vulnerability detection model combining three structural features.
Table 1. Comparison of measurement methods.
Software measurement
method advantage Disadvantages
Measurement
method or
indicator
Structured method Simple to compute. Suitable for many program language
The measurement size is small and the metric of coarse grain is less.
Code line
statistics, Circle complexity
Object - Oriented Software Metrics
compute the complexity of the class and the complexity of the relationship between class and class
Only measured from a
class-level perspective.
C&K measures MOOD measures
Complex network feature metric method
count from elements with
different granularity, and the
relationship between the
elements
Concerns about the
complexity of the elements are less.
PageRank, Aggregate Metrics
Vulnerability Prediction Models
Vulnerable, also known as weaknesses, is the asset or asset group may be threatened to use to damage caused by the weak links, vulnerability once the threat of successful use of assets may cause damage. Vulnerabilities may exist on the physical environment, organization, process, personnel, management, configuration, hardware, software and information and other aspects.
According to the definition of vulnerability, we can know that the vulnerability of software refers to the existence of the software may be threatened to use the damage caused by the feeble part. If the weak part is attacked by an attacker, the more the harm, the lower the security of the software. We can know the approximate position of the vulnerable point by measuring the importance of the node.
To measure the importance of nodes, first, we construct the software networks’ diagram. And then select the characteristics of the nodes to input machine learning. Finally, we can get three sub-models. Their purpose is to determine whether the node defects, divided the risk of defects into 0-9 level, and defined prioritize from high to low.
The Construction of Software Network Model
The weighting software network described in this section refers to the analysis of object-oriented software from the class hierarchy. Graph G= (V, E, W), V={ |v ii 1, 2,..., }n , V is the set of all nodes in
the network, the number of nodes is the set of all edges in the network, W={wi j, |i j}, W is the
network, and is the set of all edges in the network.
The Measure Feature of Software Structure
The main feature measures are node’s weighted degree, eccentricity, clustering coefficient, closeness centrality, betweenness centrality, PageRank, circle complexity, depth of function and C&K metric. Because the computation of PageRank is complex, the paper will introduce how to compute the PageRank.
The PageRank is applied to the weighted weight of the software network. This paper assigns the PageRank value by the weighting of the directed edges. This paper presents the formula for calculating the PageRank value of a software network as to be shown in Equation 1 for a directed weight.
1 2
1 2
0 1 0 2 0
( , )
( , ) ( , )
( ) (1 ) ( ( ) ( ) ... ( ))
( ) ( ) ( )
n
n n
w T i w T i w T i
PR i d d PR T PR T PR T
W T W T W T
1 0
( , )
(1 ) ( )
( )
n j
j
j j
w T i
d d PR T
W T
(1)Where W T0( )1 represents the sum of the weights of all edges starting from node T1, and w T i( , )1
represents the weight from edge T1 to node i. The initial PageRank attribute value of all nodes is divided by the total number of nodes.
Sub-model Construction
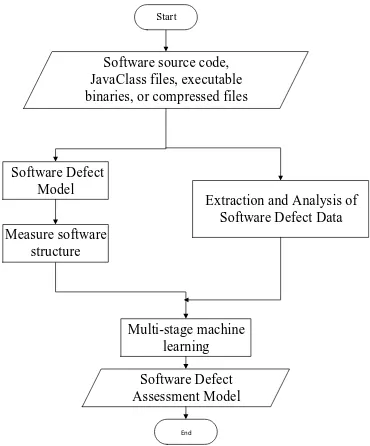
The vulnerability prediction model is composed of three sub-models. The entire framework of the model is shown in Figure 1. First, we predict whether each class has software defects and whether there are defective classes in the output of the software defect prediction model as the other two sub Model of the test object, respectively, the software defect severity and priority prediction.
(1) Vulnerability detection model
(2) Severity of Vulnerability Grading Model
The severity of vulnerability grading model is used to class the defect severity of a class with software defects from 1 to 10. The model is the process of regression analysis. In this paper, we compare the multiple linear regression model, the M5 model tree and the random forest model to select one of the models as the software defect severity prediction model.
(3) Priority of Vulnerability Evaluation Model
The priority of vulnerability evaluation model is used to evaluate the priority of vulnerability of a defective class, which is divided into three levels: high, medium and low. This stage is a multi-class learning process. In this paper, one of the models is selected as the priority of vulnerability evaluation model by comparing the effects of KNN, decision tree C4.5 and random forest.
Vulnerability detection model
Severity of Vulnerability Grading
Model
Priority of Vulnerability Evaluation Model Software Vulnerability Assessment Model
Start
Software source code, JavaClass files, executable binaries, or compressed files
Software Defect Model
Extraction and Analysis of Software Defect Data
End Measure software
structure
Multi-stage machine learning
[image:4.595.312.497.212.435.2] [image:4.595.100.273.311.434.2]Software Defect Assessment Model
Figure 1. Model Framework. Figure 2. Model of the construction method of the process.
Experimental Design
Model Building Process and Framework
In this paper, we propose a vulnerability prediction model based on the complex network. The model is constructed as follows: The process is shown in Figure 2.
(1) The construction of software network model
Taking the class of software as a node, the relationship between classes is directed and the degree of dependency is used as the weight of the edge, and the software network model of the software is constructed.
(2) The measurement of software structure characteristics
The measurement of software structure features three measurement methods: complex network feature measurement methods and related algorithms, structured program measurement methods and object-oriented measurement methods. In each method, we select the measure or algorithm which can reflect the complexity of the class node itself.
(3) Software defect data extraction and analysis
Using the static analysis tool to scan the source code, it obtains and analyzes the software defect information about the class, severity and priority of each defect.
(4) Multi-stage machine learning
Data Source and Analysis
This article uses the FindBugs static analysis tool to obtain software defect information. FindBugs is a very powerful static analysis tool, which by scanning Java Class files, JAR files or WAR files, the byte code and defect mode comparison, found that there may be software defects.
Findbugs divides it into three categories according to the severity of the software flaws: solemn (Scary) software defects, general (Troubling) software defects, and warnings (Warning) software defects. This paper will use the principle, the more solemn software defects, the greater the degree of seriousness. Therefore, serious, general and warning software defects corresponding to the severity of the range of 12 ~ 20, 7 ~ 11 and 1 ~ 6.
FindBugs classifies the software defect priority into high, medium and low levels, and the corresponding priorities are 1, 2 and 3 respectively. The priority of vulnerability evaluation model in this paper will be based on Findbug's priority criteria and data.
Experiment Sequential Flow
The purpose of this experiment is to build model and verify the accuracy of the model. Verify that the model can successfully detect vulnerabilities in the software. At the same time, this paper determines the machine learning algorithm for each sub-model.
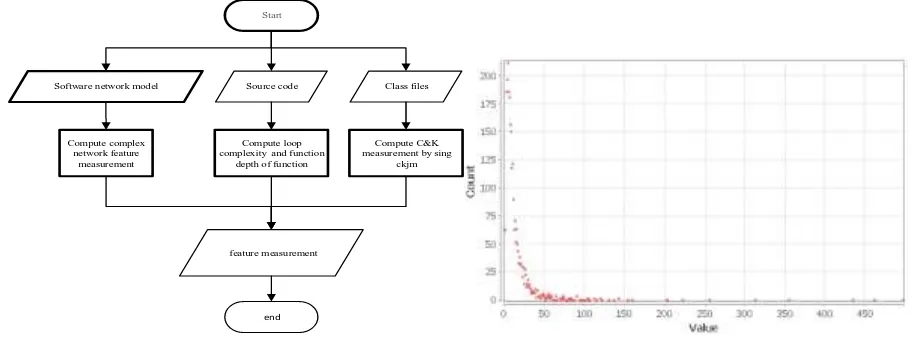
As shown in Figure 3, this paper first establishes the network model, to obtain complex network metrics and structural indicators and object-oriented metrics. Finally, this paper takes the obtained indicators for machine learning to get the final measurement model.
feature measurement Compute complex
network feature measurement
end
Start
Software network model Source code Class files
Compute loop complexity and function
depth of function
Compute C&K measurement by sing
[image:5.595.69.526.359.531.2]ckjm
Figure 3.Sequential Flow. Figure 4. Hibernate 4.3.11 Software network degree distribution.
Through the experiment, as a result, the paper can get three sub-models, namely, software defects with or without prediction model, defect severity model and defect priority model. This article tests hibernate software, the purpose is to obtain test results and experimental results. After comparing the test results and the experimental results, this paper verifies the accuracy and reliability of the model.
Experimental Results and Analysis
Small-world Feature
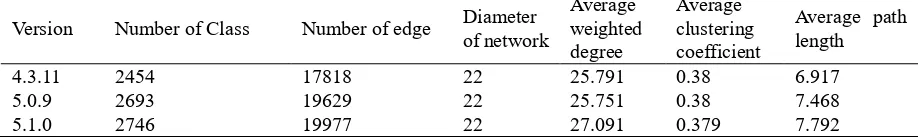
Table 2. Statistical characteristic of Hibernate software network.
Version Number of Class Number of edge Diameter of network
Average weighted degree
Average clustering coefficient
Average path length 4.3.11 2454 17818 22 25.791 0.38 6.917 5.0.9 2693 19629 22 25.751 0.38 7.468 5.1.0 2746 19977 22 27.091 0.379 7.792
Hibernate version 4.3.11 of the degree of distribution curve in Figure 4, showing that Hibernate software network has no scale characteristic.
Hibernate software network has complex network characteristics, and Hibernate is a large and complex software. Therefore, the software is satisfied with the conditions of the model. It is suitable for experiments. In this experiment, the versions 4.3.11 and 5.0.9 were used as training set and version 5.1.0 as the test set.
Experimental Verification and Result Analysis
[image:6.595.116.475.399.651.2]Data Analysis of Software Vulnerability Detection Model. The hibernate-core-5.1.0.Final.jar was tested by using the logistic regression, decision tree and random forest model. The results are shown in Table 3. The Kappa statistic of the random forest model is closest to 1. Mean absolute error and mean square error are used to measure the difference between the classification result and the actual result. The smaller the value, the better the classification effect, the minimum absolute error of the decision tree, the random forest the root mean square error is minimal.
Table 3. Results of Software vulnerability detection model.
Classification index Logistic
regression decision tree random forest number of instances correctly
categorized
2036 2521 2717
number of instances misclassified 710 225 29 Kappa statistic 0.2693 0.8053 0.9748 Average absolute error 0.3448 0.1009 0.1068 Root mean square error 0.412 0.2676 0.1604
Table 4. Classification of random forest.
category TP Rate FR Rate Accuracy Recall rate Defects 0.977 0.005 0.988 0.977 No defects 0.995 0.023 0.99 0.995
Table 5. Confusion Matrix of Random Forest Classification Results.
Original Classified Defects No defects
Defects 804 19
No defects 10 1913
[image:6.595.109.484.405.506.2]Table 6. Software Defect Severity Prediction Results.
Index Multiple regression model linear M5 tree Model Random forest
Correlation coefficient 0.3904 0.5804
Kappa statistic 0.9465
Average absolute error 1.2532 1.1008 0.0217
Root mean square error 2.0115 1.7789 0.0752
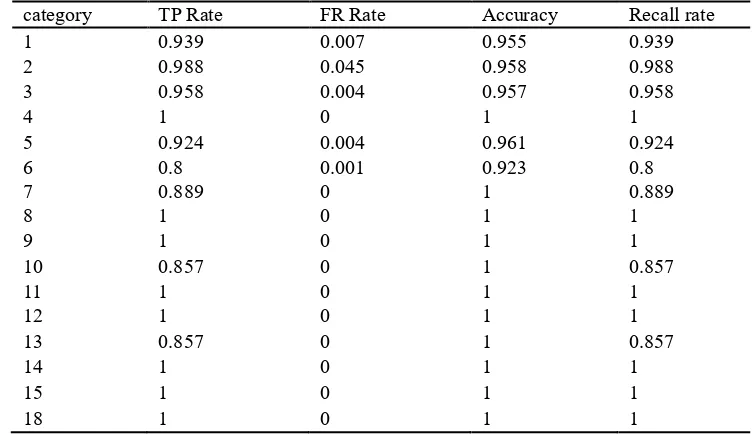
[image:7.595.107.484.331.548.2]According to the experimental data, it is found that the effect of random forest is better than that of multiple linear regression and M5 model tree. Therefore, random forest is selected as the software defect severity prediction model. The specific classification of software defect severity is shown in Table 7. The absence of 16, 17, 19, and 20 in the category is due to the absence of 16, 17, 19, and 20 of the software defects in the test set.
Table 7. Classification of random forest.
category TP Rate FR Rate Accuracy Recall rate
1 0.939 0.007 0.955 0.939
2 0.988 0.045 0.958 0.988
3 0.958 0.004 0.957 0.958
4 1 0 1 1
5 0.924 0.004 0.961 0.924
6 0.8 0.001 0.923 0.8
7 0.889 0 1 0.889
8 1 0 1 1
9 1 0 1 1
10 0.857 0 1 0.857
11 1 0 1 1
12 1 0 1 1
13 0.857 0 1 0.857
14 1 0 1 1
15 1 0 1 1
18 1 0 1 1
[image:7.595.80.515.642.798.2]Data Analysis of Priority of Vulnerability Evaluation Model.KNN, decision tree, and random forest were used to test hibernate-core-5.1.0.Final.jar, and the prediction results are shown in Table 8. In this experiment, the average absolute error of the KNN with the k value of 1 is the smallest, and the mean square error of the random forest is the smallest. The average number of KNs in the random forest is the smallest.
Table 8. Results of Software Defect Priority Forecast.
Classification index KNN (k=5) KNN(k=3) KNN(k=1) Decision tree Random forest
The number of instances correctly
categorized 649 694 785 763 804
The number of instances misclassified 174 129 38 60 19
Kappa statistic 0.5469 0.6736 0.906 0.8493 0.9524
Average absolute error 0.1863 0.1457 0.0315 0.0643 0.1066
After analyzing the experimental data, the classification effect of the random forest model is the best. The detailed classification of the software defect priority is shown in Table 9, and the confusion matrix is shown in Table 10.
Table 9. Classification of random forest.
category TP Rate FR Rate Accuracy Recall rate
low 0.994 0.052 0.973 0.994 medium 0.957 0.007 0.982 0.957
high 0.889 0 1 0.889
Table 10. Confusion Matrix of Random Forest Classification Results. Original Classified Low Medium High
low 532 3 0
medium 10 224 0
high 5 1 48
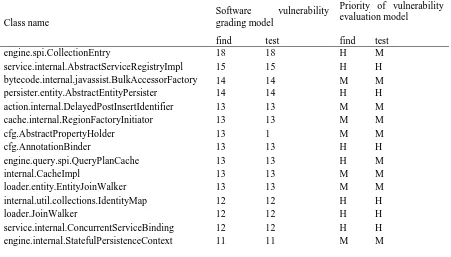
Analysis of Vulnerability Prediction Model Based on Complex Network. In the complex network of vulnerability prediction model, each sub-model finally selected a random forest model. A complete evaluation test was performed on hibernate-core-5.1.0.Final.jar using the resulting model. The results of the 20 classes tested by the Findbugs tool are compared with the results of the model. The results of the comparison are shown in Table 11. The "find" item in the table is the result of the Findbugs tool test. The "test" item is the test result of the model. M presents medium degree of vulnerability level, H presents the high and L presents the low.
Because results of detecting bug with software vulnerability model are the same as the Findbugs tool. So, it doesn’t show at table 11.
If the result of the Findbugs tool is evaluated as the correct result, then the model will have two categories of software defect prediction error.
[image:8.595.74.525.548.805.2]cfg.AbstractPropertyHolder has serious software defects, the defect was assessed as a warning class defects. Boot.internal.AttributeConverterDescriptorImpl with general software Defect, which is evaluated as a warning class defect, which has a low priority and is evaluated as a medium. Through the data onto Table 11, the mature static analysis tool, Findbugs as the standard, it indicates that the vulnerability prediction models can be a good prediction of serious defects.
Table 11. Comparison of the results of the 20 categories of software defects.
Class name
Software vulnerability
grading model
Priority of vulnerability evaluation model
find test find test
engine.spi.CollectionEntry 18 18 H M
service.internal.AbstractServiceRegistryImpl 15 15 H H
bytecode.internal.javassist.BulkAccessorFactory 14 14 M M
persister.entity.AbstractEntityPersister 14 14 H H
action.internal.DelayedPostInsertIdentifier 13 13 M M
cache.internal.RegionFactoryInitiator 13 13 M M
cfg.AbstractPropertyHolder 13 1 M M
cfg.AnnotationBinder 13 13 H H
engine.query.spi.QueryPlanCache 13 13 H M
internal.CacheImpl 13 13 M M
loader.entity.EntityJoinWalker 13 13 M M
internal.util.collections.IdentityMap 12 12 H H
loader.JoinWalker 12 12 H H
id.uuid.Helper 11 11 M M
boot.internal.AttributeConverterDescriptorImpl 10 5 L M
boot.registry.classloading.internal.ClassLoaderSer
viceImpl 10 10 M M
cfg.annotations.CollectionBinder 10 10 M M
engine.spi.EntityUniqueKey 10 10 M M
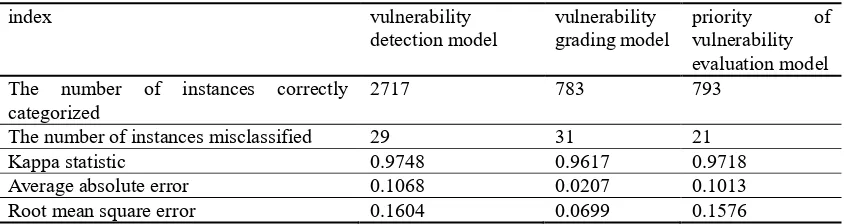
[image:9.595.88.510.242.354.2]The evaluation results of this experiment are shown in Table 12. In this paper, the evaluation of the software defect model based on complex network based on Hibernate has the advantages of good software defect, software defect severity and priority. The experiment proves the validity and accuracy of the model.
Table 12. Experimental evaluation results.
index vulnerability
detection model
vulnerability grading model
priority of vulnerability evaluation model The number of instances correctly
categorized
2717 783 793
The number of instances misclassified 29 31 21 Kappa statistic 0.9748 0.9617 0.9718 Average absolute error 0.1068 0.0207 0.1013 Root mean square error 0.1604 0.0699 0.1576
Conclusion
First, the paper analyzes the characteristics of the software and software, based upon the software structure characteristic measurement data and the specific software defect data by the method of machine learning. Second, the vulnerability prediction model based on the complex network is constructed. Finally, the paper finds vulnerability successfully by experiment’s assessment. The validity and accuracy of the model are verified by experiments.
In this paper, a vulnerability prediction model based on the complex network is constructed by experiment with hibernate. In each sub-model experiment, the machine model is compared with each other, and the stochastic forest model with good prediction effect is selected.
Overall, the experimental results show that the model is based upon the complexity and accuracy of the vulnerability prediction model, which proves the practical value from the model.
In this paper, there are still some shortcomings. Due to the limitation of code dependency analysis tools, we can only construct vulnerability prediction model based on the complex network of object-oriented software developed in Java language. In addition, the software defect information of open source software doesn’t contain the information of the defective class. In this paper, software defects are obtained by means of static analysis tools. There may be some differences between the software defect data and the real software defect data.
Acknowledgement
This work was supported the National Key R&D Program of China under Grant No. 2016YFB0800700.
References
[1] Zhu X, Cao C, Zhang J. Vulnerability severity prediction and risk metric modeling for software[J]. Applied Intelligence, 2017:1-9.
[3] Stuckman J, Walden J, Scandariato R. The Effect of Dimensionality Reduction on Software Vulnerability Prediction Models[J]. IEEE Transactions on Reliability, 2017, pp. (99):1-21.
[4] Hirama K. Software Complexity Analysis Based on Shannon Entropy Theory and C&K Metrics[J]. IEEE Latin America Transactions, 2016, 14(5):2485-2490.
[5] Vignatti A L, Silva M V G D. Minimum vertex cover in generalized random graphs with power law degree distribution[J]. Theoretical Computer Science, 2016, 647:101-111.
[6] Mehrabian A. Justifying the small-world phenomenon via random recursive trees [J]. Random Structures & Algorithms, 2016.
[7] Jochen Hoenicke. JODE URL http://jode.sourceforge.net/
[8] Sarma A D, Molla A R, Pandurangan G, et al. Fast distributed PageRank computation[J]. Theoretical Computer Science, 2015, 561:113-121.
[9] Durant K, Wagner S. On the distribution of betweenness centrality in random trees[J]. Theoretical Computer Science, 2016.
[10] Zhang Zhen, Zhang Zhenyu, Song Manman. Important node searching algorithm based on shortest-path betweenness [J]. Computer Engineering and Applications, 2013, 21: 98-100,132.
[11] Gu Qing, Xiong Shijie, Chen DaoXu. Correlations between characteristics of maximum influence and degree distributions in software networks[J]. Science China (Information Sciences), 2014, 07: 25-36.
[12] Wang By, Lü JH. Software networks nodes impact analysis of complex software systems. Journal of Software, 2013,24(12):2814-2829
[13] Ma Wanwangying, Chen Lin, Chen Zhifei, et al. Software severe defects evaluation based on complex network analysis. Journal of Frontiers of Computer Science and Technology, 2014, 8(8):956-965.
[14] Gupta S, Gupta A. A set of measures designed to identify over-lapped instances in software defect prediction[J]. Computing, 2017:1-26.
[15] Lee T, Nam J, Han D, et al. Developer Micro Interaction Metrics for Software Defect Prediction[J]. IEEE Transactions on Software Engineering, 2016, 42(11):1015-1035.
[16] Arar, Faruk M, Ayan K. Software defect prediction using cost-sensitive neural network[M]. Elsevier Science Publishers B. V. 2015.