2017 2nd International Conference on Computer Engineering, Information Science and Internet Technology (CII 2017) ISBN: 978-1-60595-504-9
A Method of Symbol Rate Estimation Based on
Wavelet Transform for Digital Modulation Signals
ZHIFEI YANG, JI SUN, PENGCHENG GUO and YONGXIN ZHANG
ABSTRACT
In non-cooperative communication, symbol rate estimation is an important basis for blind estimation and blind demodulation of digital signals. The traditional symbol rate estimation methods, such as the cyclic correlation method and the envelope spectrum method, show a dramatic decline of performance in low SNR. To solve this problem, a method based on wavelet transform is studied, and the optimal range of its best wavelet function and flex factor is deduced. Theoretical analysis and simulation experiments show that the proposed algorithm has many advantages, such as low data demand, high estimation accuracy, and so on. It has good robustness and universality in low SNR environment.
INTRODUCTION
In the non-cooperative communication, the receiver's signal is completely blind. It is necessary to estimate the parameters of the signal in order to demodulate the intercepted signal and obtain the information carried by the signal. Symbol rate is one of the most important parameters. It refers to the number of symbols transmitted in an inner channel per unit time. Accurate estimation of symbol rate is important for timing synchronization, modulation recognition, specific signal searching and demodulation.
There are three main classes of methods for symbol rate estimation [1][2]: 1) Cyclic correlation method; 2) Envelope spectrum method; 3) Wavelet transform method. The estimation precision of the cyclic correlation method and envelope spectrum method decreases sharply at low signal to noise ratio. In order to solve this problem, the wavelet transform method is adopted in this paper. The difficulty of the wavelet transform is the selection of the best wavelet function and the value of the flex factor. These two factors have a decisive influence on the recognition results. In this paper, the selection of the best wavelet function and the value of flex factor are solved by a large number of simulation, which is of great reference value for further theoretical research and engineering applications.
2. MODEL AND ALGORITHM DESCRIPTION
2.1 Digital Communication Model
Digital modulation is the conversion of digital symbols into channels suitable for transmission. The basic principle is to embed data information into the carrier, that is, to modulate the amplitude, frequency, or phase of the carrier frequency by means of digital signals. Suppose the carrier frequency is represented as follows:
_________________________________________
( ) cos( )
s t A t (1)
Then, the modulation of A is called amplitude modulation, the modulation of is called frequency modulation, and the modulation of is called phase modulation.
The basic idea of wavelet transform for symbol rate is: For the digital modulation signal singularity signal frequency, phase and amplitude will change when the symbol state changes. We can detect these singular points by using wavelet transform, singular points of the time interval between reflect symbol rate. The 2FSK signal is taken as an example to solve the best wavelet function and the range of flex factor.
The 2FSK signal can be represented as:
2FSK( ) T( ) cos(2 ( i c) c), i { ,1 2}
i
S t S
u t iT f f t f f f (2)Where S is the signal power and the c is the initial phase of the carrier wave.
2.2 Symbol Rate Estimation Based On Wavelet Transform
The wavelet transform of signals can be defined as [3]:
* 1 *
( , ) ( ) a( ) ( ) (t )
CWT a s t t dt s t dt
a a
(3)Where a is a scaling factor, is a translation factor, ( )s t is a signal, ( ) t is a mother wavelet and a( )t is a sub wavelet.
During a symbol period, the modulus of the wavelet transform coefficients of the signal is a constant. Usually, the flex factor is much smaller than the symbol period, so the change of the wavelet coefficients can be considered as a sudden change, which can be regarded as a pulse signal at the time when the symbol changes.
The amplitude after the wavelet transform of the FSK signal can be approximately represented as:
( ) i ( s) j ( s)
i j
x t
Au t iT
B t iT (4)Where Ts is the symbol cycle, Ai is the envelope of the wavelet transform of the
I symbol, Bj is the amplitude of the symbol junction, it can be positive or negative,
and ( ) t is the impulse function.
The amplitude function of the wavelet transform of the FSK signal can be approximated as:
1
1
( ) ( | | ) ( ) ( )
2 i i i s i s
i i
a
y t A A B t iT C t iT
a
(5)It can be known from the equation (5) that the modulus of the wavelet transform coefficients of the signal is a pulse sequence of Ts intervals. From the frequency angle analysis, | ( ) |y t is the spectral line with m times the symbol rate, so that the symbol rate can be calculated.
3. PERFORMANCE OF SIMULATION AND ANALYSIS
3.1 Selection of the Best Wavelet Function
To use the wavelet function in wavelet analysis with ( ) t diversity, there are Haar wavelet, Daubechies wavelet (dbN), Mexican Hat wavelet, Morlet wavelet and Meyer wavelet commonly used[4] (Figure 1). Each wavelet function has different application fields, using different wavelet functions for dealing with same problem can produce different results. The choosen of wavelet function is related to the accuracy and convenience of the symbol rate estimation, so the selection of the best wavelet function is a very important problem.
At present, it is difficult to determine the optimal wavelet function by theoretical analysis. We can compare the result by means of simulation to determine the best wavelet function for symbol rate analysis.
The program running environment is WinXP Sp3, and the computer is configured as memory 1G and CPU2.4GHz. The above 5 kinds of wavelet functions are used to estimate FSK signal’s symbol rate in different SNR. The corresponding experimental conditions are as follows: wavelet flex factor a=100, signal sampling rate fs=1MHz, carrier frequency fc=200KHz, symbol rate Rs=5KHz, data interception length is 100 bits, respectively. Monte Carlo test for 1000 times, figure 2 shows the different wavelet functions in 6 SNR estimation performance comparison, table I gives the calculation time of different wavelet functions.
0 0.2 0.4 0.6 0.8 1 1.2 1.4 -1.5
-1 -0.5 0 0.5 1
1.5 Haar小 波时 域 波 形
0 1 2 3 4 5 6 7 8 9
-1.5 -1 -0.5 0 0.5 1
1.5 db5小 波时 域 波 形
-6 -4 -2 0 2 4 6 -0.4
-0.2 0 0.2 0.4 0.6 0.8 1
mexihat小 波时 域 波 形
a) Haar wavelet b) Daubechies wavelet c) Mexican Hat wavelet
-6 -4 -2 0 2 4 6 -1
-0.8 -0.6 -0.4 -0.2 0 0.2 0.4 0.6 0.8 1
morlet小 波时 域 波 形
-6 -4 -2 0 2 4 6 -1
-0.5 0 0.5 1 1.5
meyer小 波时 域 波 形
-5dB -2dB 1dB 4dB 7dB 10dB 0.1
0.2 0.3 0.4 0.5 0.6 0.7 0.8 0.9 1
信 噪 比
正确
识别率
haar小 波 db5小 波 mexh小 波 morl小 波 meyr小 波
Co
rr
ec
t
re
co
gn
it
io
n
ra
te
SNR
[image:4.612.189.425.55.229.2]Figure 2. Performance comparison of different wavelet function symbol rate estimation.
TABLE I. CALCULATION TIME OF DIFFERENT WAVELET FUNCTIONS. Wavelet type
Calculation quantity
Haar wavelet
Daubechies wavelet (db5)
Mexican Hat wavelet
Morlet wavelet
Meyer wavelet The 1000 calculation
takes time (s) 17.8711 34.0040 44.0283 44.0008 45.2365
It can be seen from Figure 2, Haar wavelet and Mexican Hat wavelet estimation performance is the best, it can achieve 100% recognition rate when signal-to-noise above -1dB; Daubechies (db5) and Meyer wavelet estimation performance is poor, the correct recognition ratio only reaches 80% when signal-to-noise above 7dB; Morlet wavelet estimation is the worst performance, the correct recognition ratio only reaches 50% when signal-to-noise above 10dB.
It can be seen from table I the computation time of Haar wavelet is the shortest, single computing time is 17.87ms, far less than the other 4 kinds of wavelet. Combined with the performance of the wavelet in the figure 2, Haar wavelet and Mexican Hat wavelet estimation performance is almost the same, but Haar wavelet take a short time, so we final selected Haar wavelet as the best wavelet function.
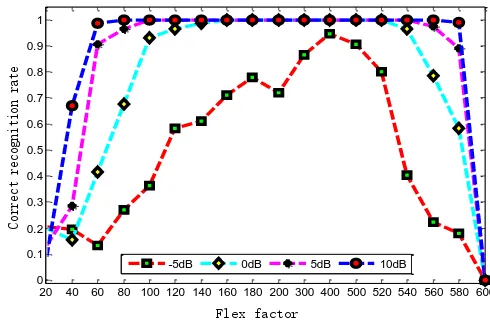
3.2 Determination of the Optimum Flex Factor
Small flex factor wavelet transform affected by noise is very large in low SNR environment, there will be false extrema point, which influence accurate calculation of symbol rate. Large flex factor wavelet transform stabilize the noise is more obvious, but the flex factor is too large, it will reduce or even submerged local extremum points, and increase the amount of calculation, so the flex factor selection is crucial to the estimation of symbol rate.
20 40 60 80 100 120 140 160 180 200 300 400 500 520 540 560 580 600 0
0.1 0.2 0.3 0.4 0.5 0.6 0.7 0.8 0.9 1
小 波 伸缩 尺 度
正确
识别率
-5dB 0dB 5dB 10dB
Co
rr
ec
t
re
co
gn
it
io
n
ra
te
[image:5.612.183.428.65.226.2]Flex factor
Figure 3. Performance relation between Haar wavelet function flex factor and symbol rate estimation.
TABLE II. CALCULATION FOR DIFFERENT FLEX FACTOR. Flex factor
Calculation quantity 100 200 400 800 1000
The 1000 calculation
takes time (s) 17.8711 20.1433 24.3515 35.3931 40.3214
It can be seen from Figure 3, the range of flex factor is larger when the SNR is higher. The correct recognition rate can reach 100% when the flex factor is between 160 and 520.
It can be seen from table II the larger the flex factor is, the greater the amount of calculation is. Therefore, under the premise of guaranteeing the accuracy of the symbol rate estimation, we try our best to select the smaller flex factorto reduce the computational complexity.
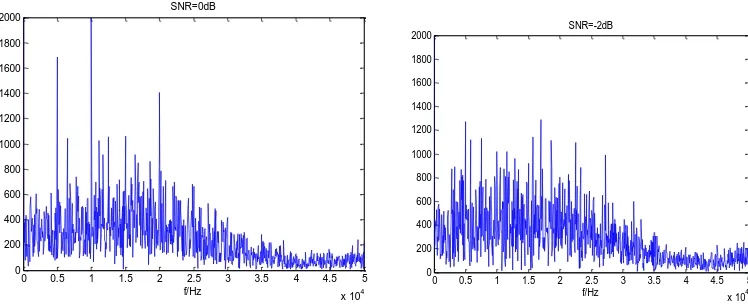
3.3 Simulation Results
Under different SNR conditions on FSK signal’s symbol rate estimation, simulation conditions are as follows: wavelet flex factor a=32, sampling rate fs=100KHz, carrier frequency fc=20KHz, symbol rate R=5KHz, data interception length is 100 bits. We simulate independent trials for 500 times, the results are shown in figure 4.
0 0.5 1 1.5 2 2.5 3 3.5 4 4.5 5 x 10⁴ 0
200 400 600 800 1000 1200 1400 1600 1800 2000
f/Hz
幅度
SNR=5dB
0 0.5 1 1.5 2 2.5 3 3.5 4 4.5 5
x 104 0
200 400 600 800 1000 1200 1400 1600 1800 2000
f/Hz
幅度
0 0.5 1 1.5 2 2.5 3 3.5 4 4.5 5 x 10⁴ 0
200 400 600 800 1000 1200 1400 1600 1800 2000
f/Hz
幅度
SNR=0dB
0 0.5 1 1.5 2 2.5 3 3.5 4 4.5 5 x 10⁴ 0
200 400 600 800 1000 1200 1400 1600 1800 2000
f/Hz
幅度
[image:6.612.102.476.57.209.2]SNR=-2dB
Figure 4. Frequency spectrum of signal wavelet transform.
The algorithm calculates the symbol rate of the signal by identifying the spectral lines, so the greater the ratio of the spectral line to the bottom noise is, the higher the estimation accuracy is. From the simulation results, it can be found that the ratio of the signal spectrum to the bottom noise is very high at SNR>1dB, and the symbol rate can be obviously estimated at 5 KHz. The simulation results are better than the results in the literature [5].
REFERENCES
1. Carlos M, Sandro S. 2008. “Non-data-aided symbol rate estimation of linear modulated signals”. IEEE Transactions on Signal Processing, 52(6), pp. 664-674.
2. Zeng Wei-gui, Sug Ying-feng, Xu Hui-qi. 2013. “Waveform design and parameter calculation for
quasi-continuous wave”. System Engineering and Electronics, 35(3), pp. 517-521.
3. Pelekanakia K, Nikias C. 2014. Adaptive sparse channel estimation under symmetric alpha-stable
noise. IEEE Transactions on Signal Wireless Communications, 13(6), pp.3183-3195.
4. Xu Jun, Wang Fuping, Wang Zanji. 2015. “The improvement of symbol rate estimation by the wavelet transform”. 2015 International Conference on Communications, Circuits and Systerns. Piscataway: IEEE, 1, pp.100-103.