2017 2nd International Conference on Computer Engineering, Information Science and Internet Technology (CII 2017) ISBN: 978-1-60595-504-9
Analyzing Reliability of Weld Structure of Crane's
Beam with Taguchi Method
WEN ZHANG, YINGKAI ZHAO, HONGWEI XU, XIN WANG and YANJUN SHI
ABSTRACT
The reliability of crane is an important factor to guarantee the mechanical engineering process normally. This paper used Taguchi method analyzed the reliability of the metal structure weld of the bridge crane whose limit state function is mathematical expression. Then we obtained the minimum reliable welding feet height values of the welds between cover plate and web plate on end beam support surface as well as the weld between main beam and end beam joint under different coefficients of variation. This paper provides a new idea and reference for the growth of the inherent reliability of bridge cranes.
KEYWORDS
Crane, Weld Structure, Reliability, Taguchi Robust Design.
INTRODUCTION
Bridge crane is typical engineering machinery, which is widely used in factories, wharfs, storage yards, nuclear power plant constructions and other places. Metal structure is the body of the hoisting machinery, which is the support part of other mechanisms. Its weight counts more than 60% of the total weight of the crane, the reliability of the metal structure directly affect the safety and reliability of the crane. The reliability analysis of mechanical structure developed from 1940s to the present, has been involved in all walks of life; reliable analysis technology also developed from the initial central point method, to first-order reliable analysis, Monte Carlo simulation and agent-based model of the response surface method. Isight is a multidisciplinary optimization software that integrates reliable analysis components and computational components such as matlab, ansys for reliable analysis. Zhu Xiaolong et al. [1] integrated Matlab based on Isight to analyze the reliability of gantry crane metal structures and to judge the reliability of the main beam and rigid leg of the portal crane, which can be optimized.
Zhong Qiang[2] used Isight combined with ANSYS to establish the response surface model and achieved the optimization of the tower crane’s weight, so the total weight of the structural system reduced by 18.3%, which also reduced manufacturing _________________________________________
Wen zhang, dlzw @hotmail.com, Yingkai Zhao, [email protected], Xin Wang, w angxbd @163.com and Yanjun Shi, [email protected], School of Mechanical Engineering, Dalian University of Technology, Dalian, China
costs. Li Bo et al. [3] analyzed the reliability of the crane metal structure based on Isight and MSC Nastran under different service years, and provided the reliability of the crane under different service years.
INTRODUCTION OF TAGUCHI ROBUST DESIGN
Taguchi Robust Design (TRD, hereinafter referred to as Taguchi method) is a low-cost, cost-effective quality engineering method founded by Dr. Genichi Taguchi, Japan, in the 1950s. Taguchi method not only advocates the use of cheap components to design and manufacture high-quality products, but also the use of advanced test technology to reduce the cost of design and testing, which is Taguchi's traditional changes in the traditional thinking and also points out a new direction for enterprises to increase benefits.
Taguchi method does not involve the system design, but focus on parameter design and tolerance design, whose core is the parameter design:
1. System design stage, also known as the concept design stage, whose main purpose is to find a variety of possible functional requirements of the system design or technology.
2. Parameter design stage: use the active and positive way to optimize the system design, use experiments to determine the level combination of control factors, then the system noise sensitivity reaches the lowest, so as to enhance the system's robustness.
3. Tolerance design stage: Based on the best conditions obtained in the parameter design phase, the appropriate tolerance range of each parameter can be determined. Tolerance design is passive which is related to the manufacturing cost and the wide tolerance often means low cost.
By selecting the design parameters, determining the orthogonal table test design and choosing SN ratio as an indicator, Taguchi method reduces the variation of the target value by decreasing the impact of noise factor on the desired value and enhance the stability and reproducibility of the product performance.
The characteristics of Taguchi method are as followed:
1. Evaluate the quality characteristics based on the mass loss function; 2. Measure the robustness by SN ratio;
3. Arrange the test design through Taguchi orthogonal table.
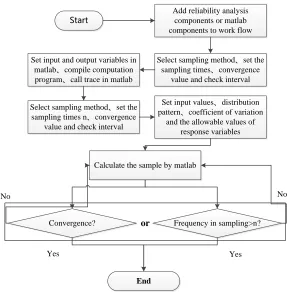
THE RELIABILITY ANALYSIS PROCESS BASED ON ISIGHT
Start
Set input and output variables in matlab、compile computation program、call trace in matlab
Select sampling method、set the sampling times、convergence
value and check interval Add reliability analysis components or matlab components to work flow
Select sampling method、set the sampling times n、convergence
value and check interval
Set input values、distribution pattern、coefficient of variation
and the allowable values of response variables
Calculate the sample by matlab
Convergence? Frequency in sampling>n?
End
No No
or
[image:3.612.152.439.51.343.2]Yes Yes
Figure 1. Reliability analysis process with Isight.
Connected Welds between Main Beam and End Beam
In this paper, for the reliability of the crane analysis, the rated lifting capacity of Q is 10t; span L is 20m; cart speed v1 = 75m / min; crane working type is A5; cart operation mechanism is centralized drive mode; car gauge L1 is 2m; Wheel base Bc is 1.4m; lifting speed v = 7.5m / min. Case is selected as a smooth brake car, which is in the cross and full load drop brake.
According to the literature [5,6], the location, which was generally used to make intensity check in bridge beam weld strength is weld seam at the joint between the cover plate and the web on the main support surface, welded joint between main beam and end beam web and the connection weld between the cover plate and the web on the end beam support surface. In this paper, the three welds were used to make reliability analysis.
Connection between main beams and end beams
Calculation formula of shear stress of weld joint between main beam and end beam:
( ) max
1 Q
=
*0.7* * G P
f
n h h
(1)
coefficient of variation is 0.01. The values and distributions of the parameters of the remaining beams and the end beams are the same as those in Table 1.
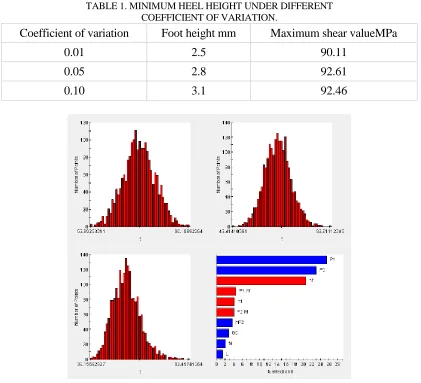
Calculating the height values of the feet under different coefficient of variation as shown in Table 1. Fig.2 shows the shear stress distribution and influencing factors of different coefficient of variation.
Connected Weld between End Beam Cover and the Web
On the cover plate and web connection, weld shear stress calculation formula is:
a 1
1
R * =
* x*0.7 * f S
n I h
(2)
Where Ra is the maximum supporting force of the end beam; S1 is the area of the centerline of the end beam supporting section on the horizontal center of gravity line;
1
n is the number of welds; hf is the foot height; Ix is the end beam support facing the
[image:4.612.88.509.316.699.2]horizontal center. The formulas are as followed :
TABLE 1. MINIMUM HEEL HEIGHT UNDER DIFFERENT COEFFICIENT OF VARIATION.
Coefficient of variation Foot height mm Maximum shear valueMPa
0.01 2.5 90.11
0.05 2.8 92.61
0.10 3.1 92.46
max 2 a
*( 2* ) R
G P
c
Q L a
K
(3)
1 1* 1* 1
S B d C (4)
2 3 4 5 6 7 x
I I I I I I I (5)
Among them,
2 1 1 1
* * 12
I B d ,I3B1*d1*C12, 4 2* 1 *h * *
12 f
I h h ,I52*h *hf *C22
3
6 2 2
1 2* * *
12
I B d ,I7 2 *B2*d2*C33.
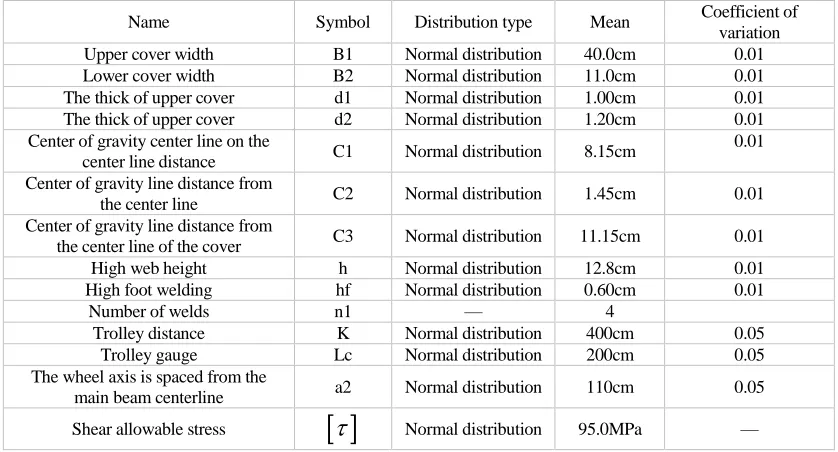
The calculation parameters are shown in Table 2.
[image:5.612.88.507.418.644.2]Assuming that the design variables are random variables and obey the normal distribution, the design value is the mean value. The coefficient of variation is based on the reference value and the variation range of the random variable, assuming the coefficient of variation of the random variable. Since the random variables in Table 2 are length, they mainly consider their machining errors and possible deviations in specific working conditions, and can be calculated in accordance with the formula [51], check the processing level and accuracy after the calculation. In this paper, to simplify the calculation process, if the design value is small, then take the coefficient of variation is 0.01; if larger, then take the coefficient of variation is 0.05, the specific value in Table 2.
TABLE 2. CALCULATION PARAMETERS FOR SHEAR STRESS OF END SEAM.
Name Symbol Distribution type Mean Coefficient of
variation
Upper cover width B1 Normal distribution 40.0cm 0.01
Lower cover width B2 Normal distribution 11.0cm 0.01
The thick of upper cover d1 Normal distribution 1.00cm 0.01 The thick of upper cover d2 Normal distribution 1.20cm 0.01 Center of gravity center line on the
center line distance C1 Normal distribution 8.15cm
0.01 Center of gravity line distance from
the center line C2 Normal distribution 1.45cm 0.01
Center of gravity line distance from
the center line of the cover C3 Normal distribution 11.15cm 0.01
High web height h Normal distribution 12.8cm 0.01
High foot welding hf Normal distribution 0.60cm 0.01
Number of welds n1 — 4
Trolley distance K Normal distribution 400cm 0.05
Trolley gauge Lc Normal distribution 200cm 0.05
The wheel axis is spaced from the
main beam centerline a2 Normal distribution 110cm 0.05
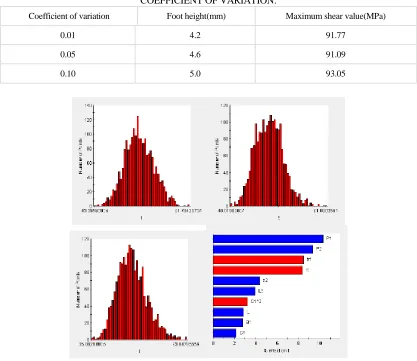
TABLE 3. MINIMUM WELDING FEET HEIGHT WITH DIFFERENT COEFFICIENT OF VARIATION.
Coefficient of variation Foot height(mm) Maximum shear value(MPa)
0.01 4.2 91.77
0.05 4.6 91.09
0.10 5.0 93.05
Figure 3. Distribution and influencing factors of shear stress under different coefficient of variation.
SUMMARY
In this paper, a reliability analysis method based on Isight for the mathematical expression is established, which provides a new idea for the reliability analysis of the weld metal structure of the crane, and avoids the problem of reliability optimization of the weld directly. The method is simple and easy to operate, so it is easy to be applied in engineering.
REFERENCES
1. Zhu Xiaolong, Yu Lanfeng, Guo Junchai, Li Shaopeng.Evaluation of Metal Structure System of Gantry Crane Based on Matlab and Isight [J]. Mechanical Design and Manufacture, 2013,03: 91-93 + 96.
2. Zhong Qiang, Optimization Design of Tower Crane Structure System Based on Fuzzy Stochastic Reliability [J]. South west Jiao tong University, 2009.
3. Li Bo, Li Zhenlin, Wang Deyu. Finite element simulation of crane metal structure reliability [J]. Computer Assisted Engineering, 2010, 02: 79-82.
4. Chen Weizhang, Gu Dimin. Crane metal structure [J].