1 | P a g e
Hadleigh Park priority species habitat assessment 2015
Authors: Connop, S. and Clough, J.
Corresponding author: Stuart Connop (s.p.connop@uel.ac.uk)
Published by the University of East London 4-6 University Way
Docklands London E16 2RD
Cover photo: White-letter hairstreak on bramble © Stuart Connop
© University of East London 2016
Printed in Great Britain at the University of East London, Docklands, London.
2 | P a g e
Contents
1. Background ...6
2. White-letter hairstreak butterfly survey ...8
3. Green haying forage creation experiment ...18
4. Bumblebee survey ...45
5. Habitat management recommendations ...66
6. References ...68
Appendix 1 ...70
3 | P a g e
Figures
Figure 1. Hadleigh Park Compartment Map. Map displaying the habitat management compartments
of Hadleigh Park ...7
Figure 2. White-letter hairstreak observation points at Hadleigh Park.. ...10
Figure 3. Total number of observations of white-letter hairstreaks at Hadleigh Park observation points, summer 2015 ...14
Figure 4. Maximum number of white-letter hairstreaks observed simultaneously at Hadleigh Park observation points, summer 2015. ...14
Figure 5. Distribution of average timed counts of all white-letter hairstreak butterfly individuals observed at Hadleigh Park observation points, summer 2015. ...16
Figure 6. Distribution of average maximum number of white-letter hairstreak butterflies observed simultaneously at Hadleigh Park observation points, summer 2015 ...17
Figure 7. Plan of Hadleigh Park green hay plots (Aerial photo © Hadleigh Park)...20
Figure 8. Plan of scrub removal forage patch creation experiment at Hadleigh Park...21
Figure 9. Green hay cutting on flower-rich area of Hadleigh Park. ...21
Figure 10. 1 x 1 m quadrat used for floral surveys at Hadleigh Park. ...22
Figure 11. Average number of all flower heads on the trial plots of experiment area 1, August 2015. ...27
Figure 12. Average number of all flower heads on the trial plots of experiment area 4, August 2015. ...27
Figure 13. Average number of all flower heads on the trial plots of experiment area 5, August 2015. ...28
Figure 14. Average number of Odontites verna flower heads on the trial plots of experiment area 1, August 2015 ...29
Figure 15. Average number of Odontites verna flower heads on the trial plots of experiment area 4, August 2015 ...29
Figure 16. Average number of Odontites verna flower heads on the trial plots of experiment area 5, August 2015 ...30
Figure 17. Average number of Lotus species flower heads on the trial plots of experiment area 1, August 2015 ...30
Figure 18. Average number of Lotus species flower heads on the trial plots of experiment area 4, August 2015 ...31
Figure 19. Average number of Lotus species flower heads on the trial plots of experiment area 5, August 2015 ...31
Figure 20. Average number of Centaurea nigra flower heads on the trial plots of experiment area 1, August 2015 ...32
Figure 21. Average number of Centaurea nigra flower heads on the trial plots of experiment area 4, August 2015 ...32
Figure 22. Average number of Centaurea nigra flower heads on the trial plots of experiment area 5, August 2015 ...33
Figure 23. Average number of Trifolium pratense flower heads on the trial plots of experiment area 1, August 2015 ...34
4 | P a g e
Figure 25. Average percentage cover of vegetation in floral survey quadrats...38
Figure 26. Visible line in vegetation differentiating the green hay plot from the natural recolonisation plot in experiment area 1, August 2015. ...39
Figure 27. Visible line in vegetation differentiating the green hay plot from the natural recolonisation plot in experiment area 4, August 2015. ...40
Figure 28. Visible line in vegetation differentiating the green hay plot from the natural recolonisation plot in experiment area 5, August 2015. ...40
Figure 29. Average dominance of grass/standing dead grass within 1 m² quadrats at Hadleigh Park, August 2015 ...43
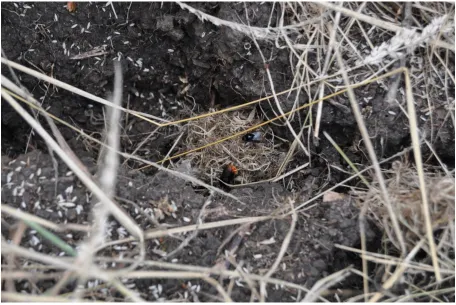
Figure 30. Bombus lapidarius nest in experiment area 5, Hadleigh Park. ...44
Figure 31. Bumblebee forage-rich areas of Hadleigh Park. ...46
Figure 32. Average bumblebee counts on experiment area 1 ...47
Figure 33. Average bumblebee species diversity on experiment area 1 ...48
Figure 34. Average bumblebee counts on experiment area 4 ...49
Figure 35. Average bumblebee species diversity on experiment area 4 ...49
Figure 36. Average bumblebee counts on experiment area 5 ...50
Figure 37. Average bumblebee species diversity on experiment area 5 ...51
Figure 38. Average timed counts of B. humilis at Hadleigh Park, August 2015 ...52
Figure 39. Average timed counts of B. sylvarum at Hadleigh Park, August 2015 ...52
Figure 40. Average timed counts of all Bombus species individualsat Hadleigh Park, August 2015 ...53
Figure 41. Average annual Bombus humilis and Bombus sylvarum counts at Hadleigh Park, 2003-2015 ...55
Figure 42. Forage preferences of bumblebees foraging on the green hay plot of experiment area 1 Hadleigh Park, August 2015 ...56
Figure 43. Forage preferences of bumblebees foraging on the green hay plot of experiment area 4 Hadleigh Park, August 2015 ...57
Figure 44. Forage preferences of bumblebees foraging on the green hay plot of experiment area 5 Hadleigh Park, August 2015 ...58
Figure 45. Forage preferences of bumblebees foraging on the natural recolonisation plot of experiment area 1 Hadleigh Park, August 2015 ...59
Figure 46. Forage preferences of bumblebees foraging on the natural recolonisation plot of experiment area 4 Hadleigh Park, August 2015 ...60
Figure 47. Forage preferences of bumblebees foraging on the natural recolonisation plot of experiment area 5 Hadleigh Park, August 2015 ...61
Figure 48. Forage preferences of bumblebees foraging on the key forage area - the Top Field, Hadleigh Park, August 2015 ...62
Figure 49. Forage preferences of bumblebees foraging on the key forage area - the Rear of the Marsh, Hadleigh Park, August 2015...63
Figure 50. Forage preferences of bumblebees foraging on the key forage area - Benfleet Downs, Hadleigh Park, August 2015 ...63
Figure 51. Forage preferences of bumblebees foraging on the key forage area - the Hay Cut area, Hadleigh Park, August 2015 ...64
Figure 52. White-letter hairstreak observation point 1, Hadleigh Park...70
Figure 53. White-letter hairstreak observation point 2, Hadleigh Park...70
Figure 54. White-letter hairstreak observation point 3, Hadleigh Park...71
5 | P a g e
Figure 56. White-letter hairstreak observation point 5, Hadleigh Park...72
Figure 57. White-letter hairstreak observation point 6, Hadleigh Park...72
Figure 58. White-letter hairstreak observation point 7, Hadleigh Park...73
Figure 59. White-letter hairstreak observation point 8, Hadleigh Park...73
Figure 60. White-letter hairstreak observation point 9, Hadleigh Park...74
Figure 61. White-letter hairstreak observation point 10, Hadleigh Park. ...74
Figure 62. White-letter hairstreak observation point 11, Hadleigh Park. ...75
Figure 63. White-letter hairstreak observation point 12, Hadleigh Park. ...75
Figure 64. White-letter hairstreak observation point 13, Hadleigh Park. ...76
Figure 65. White-letter hairstreak observation point 14, Hadleigh Park. ...76
Figure 66. White-letter hairstreak observation point 15, Hadleigh Park. ...77
Figure 67. White-letter hairstreak observation point 16, Hadleigh Park. ...77
6 | P a g e
1. Background
Hadleigh Park (HP) SSSI (TQ800869) was a key site for delivery of the 2012 London Olympics hosting the Olympic mountain biking course. As part of the legacy from this event an Ecological Management Plan was developed to conserve and enhance the ecological value of the site. This was to be achieved through a series of strategies:
1) To increase habitat extent and improve habitat quality through enhanced habitat management.
2) To enhance habitat connectivity across the foothills by restoring an existing 'weak-link' of arable land to permanent grassland.
3) To develop and fund a programme of ecological monitoring.
In order to fulfil some of the requirements of the ecological monitoring target of the strategies, invertebrate habitat assessment surveys were established during the summer of 2015 to create a baseline for monitoring the effects of current and future habitat management on the site. This included delivering invertebrate surveys focused on habitats/assemblages that the operational use of the legacy may affect and that are associated with the SSSI designation. The focus of these surveys would be in Compartments 1, 2 and 3a (Figure 1). The aim being to obtain results on which ISIS analysis could be carried out to provide common standards monitoring invertebrate assemblage information. The results of these surveys are available in Harvey (2015).
8 | P a g e
2. White-letter hairstreak butterfly survey
2.1 Background
The white-letter hairstreak (Satyrium w-album) is a small butterfly distinguished by a white ‘W’ mark across the underside. The species declined in the UK during the 1970s when its foodplants were reduced by Dutch Elm Disease, but is recovering in a few areas (Butterfly Conservation 2016). Due to the species' marked decline in the UK (99% decline in abundance extrapolated over 25 years) it was included on the UK Biodiversity Action Plan list in 1997 with the aims of ensuring monitoring and appropriate hedgerow management (JNCC 2010) and, subsequently, under Section 41 (S41) of the 2006 Natural Environment and Rural Communities (NERC) Act.
The butterfly breeds on various elm species, including wych elm (Ulmus glabra), English elm (U. procera) and small-leaved elm (U. minor). It breeds on mature trees or abundant sucker growth near dead trees (Butterfly Conservation 2016). It breeds where elms occur in sheltered hedgerows, mixed scrub, and the edges of woodland rides, and also on large isolated elms (Butterfly Conservation 2016). Information on the colony structure is sparse, but a marking experiment showed a population numbering several hundred with adults regularly moving between trees up to 300 m apart (Butterfly Conservation 2016). Many colonies are restricted to a small group of trees, but dispersal appears quite common and individuals have been seen several kilometres from known breeding sites (Butterfly Conservation 2016).
With large expanses of scrub containing stands of Ulmus species covering compartment areas 1 & 2 (Figure 1), Hadleigh Park is known to support a substantial population of these butterflies. Indeed it has been suggested that the Hadleigh Park population represents the largest colony within Essex (Personal communication Rob Smith transect coordinator for Essex Butterfly Conservation). With continuing losses to Dutch Elm Disease and legacy plans to re-open some areas of flower-rich grassland that have scrubbed over due to lack of management intervention, it is important to map the distributions and number of this species at the park and assess changes in these populations in relation to legacy management plans.
2.2 Survey Methodology
9 | P a g e surveys (Pollard and Yates 1993). As such, a novel repeatable timed count was established at the park in order to monitor populations on the site over future years. The methods used were based on those developed by the Herts & Middlesex White-letter Hairstreak Monitoring Project (Goodyear and Middleton 2007) suitable for assessing arboreal habitats rather than standardised butterfly walks.
In order to generate standardised indices counts, it is necessary to count individuals where they can be reliably and repetitively found. This requires a particular focus on searching for male activity around the tree-tops and also individuals nectaring on bramble and thistles in close proximity to elm trees. To achieve this, a series of 17 observation points were established across the park at various elm 'hotspots' (Figure 2) rather than standardised transect walks. Each observation point was marked with a blue cross to ensure that the same location could be reliably found and a GPS reading of location was taken using a GPSmap 60CSx (Garmin, Hampshire, UK) to aid relocation of the blue crosses (Table 1). At each point, if elms or bramble were only present in a single direction, a bearing was recorded of this direction as a guide for the observer for the start of each survey (Table 1). A series of photographs were also taken from each observation point to document the location and type of vegetation being surveyed. Copies of some of these photos are included as Appendix A. The remaining photos will be held in an archive and can be obtained from the University of East London Sustainability Research Institute.
Once established, a ten minute observational survey was carried out from each of these points. During each survey, the number of white-letter hairstreak individuals observed flying around tree tops and nectaring was recorded. Numbers were recorded using two methods. Firstly, the total number of individual sightings was recorded. Secondly, the maximum number of individuals seen at any one time was recorded. These two methods were utilised in an attempt to reduce the effect of observing the same individual twice and recording it as two separate sightings. As such, total observations represented a comparative count that was likely to be an over estimation of total numbers and maximum individuals observed at one time was a measure of the minimum number of individuals at each observation point. Observation could be done with binoculars if required but, as the tree tops being observed were near to the observation points and white-letter hairstreaks were likely to be the only small dark triangular butterflies jittering in classic hairstreak style around elm-rich spots in late June (Goodyear and Middleton 2007), it was also possible to carry out the surveys with the naked eye.
11 | P a g e Table 1. White-letter hairstreak observation points at Hadleigh Park. Details of observation point name, grid reference, bearing of main
concentration of elm/bramble (if appropriate) and a description of how to find each observation point on site. Each point is marked with a blue cross on the ground.
Name Grid ref Centre point bearing Description
HP1 TQ7960586220 328° U-bend ride bottom of top fields below Chapel Lane Car park, off main track
HP2 TQ7943086207 102° By bench round upper ride from HP1
HP3 TQ7922786168 121° Edge of boundary looking back over dead elm area HP4 TQ7883885882 46° S-ride upwards after green hay area
HP5 TQ7884185867 117° S-ride downwards after green hay area (different X to HP4) HP6 TQ7884585836 39° Bottom of S-ride looking back up
HP7 TQ7863885830 All directions New ride near pipeline (can see gate from survey point) HP8 TQ7852885721 32° Bottom of old pipeline ride looking back up
HP9 TQ7850385781 All directions Along new ride after pipeline
HP10 TQ7825885790 0° Eastern end of Benfleet Downs near bench
HP11 TQ7832685808 336° Second curve in top ride leaving from eastern end of Benfleet Downs (northward curve)
HP12 TQ7851785842 26° Bramble patch old pipeline - elm above HP13 TQ7863085868 All directions Bramble patch old ride
HP14 TQ7864885861 142° Old ride path junction
HP15 TQ7873885893 0° Old ride by muddy pool approximately 50m before ride HP16 TQ7877785927 15° and 195° Top of S-ride
12 | P a g e that all original monitoring points would be retained for subsequent monitoring rounds due to the distribution of white-letter hairstreaks at the park.
Previous surveys have recorded most success in terms of numbers of observations as the morning warmed up and conditions became amenable for active flight, with activity recorded as slow during the middle of the day (Goodyear and Middleton 2007). Based on this, survey rounds were started during mid-morning and the order of the survey points was varied on subsequent visits so that time of survey should not have affected results .
In addition to the baseline surveys carried out by University of East London researchers, surveys were also carried out by the conservation manager of Hadleigh Park, Andrew Woodhouse and by a butterfly surveyor that has been carrying out butterfly transects at Hadleigh Park for several years, David Chandler (Cambs & Essex Branch of Butterfly Conservation). Whilst Andrew was able to utilise the new monitoring methodology, David repeated the transects that he had established previously. As such, David's results were not directly comparable to those generated in the baseline survey and were thus treated separately. Nevertheless, they provide an interesting extra layer of data due to the continuity of methodology from his surveys in previous years.
2.3 Results
In total, five survey visits were made to each of the 17 observation points. These were timed to coincide with peak dates from the Goodyear and Middleton (2007) surveys and based on observations of first appearance by the conservation manager at Hadleigh Park. Survey visits ran from 22nd June to the 16th July 2015.
Results of average total counts of white-letter hairstreaks are recorded in Table 2. Results of average maximum number of individuals recorded during each observational survey are recorded in Table 3. The highest number observed during 10 minutes was 24 at HP4 on the 16th July. The maximum number of individuals observed in flight together was 8 recorded at HP7 and HP8 on the 30th June. The highest average score for total numbers observed was recorded at HP9 and the highest average maximum number of individuals was recorded at HP7. All observation points recorded at least one individual during at least one of the ten minute observation periods.
13 | P a g e Table 2. Average number of observations of white-letter hairstreaks at Hadleigh Park observation points, summer 2015. Observation made during a ten minute survey. Numbers represent the average of the total number of sightings during each of the ten minute surveys (n =5).
Observation Point Average S.E.
HP1 0.25 0.25
HP2 5.00 2.71
HP3 0.50 0.50
HP4 8.50 5.68
HP5 3.25 2.93
HP6 5.00 2.61
HP7 2.50 1.66
HP8 6.75 1.49
HP9 11.00 4.97
HP10 3.50 2.53
HP11 0.50 0.50
HP12 5.50 2.40
HP13 5.75 3.15
HP14 5.75 2.75
HP15 2.50 1.66
HP16 3.25 2.93
HP17 2.00 1.35
Table 3. Maximum number of white-letter hairstreaks observed simultaneously at Hadleigh Park observation points, summer 2015. Observation made during a ten minute survey. Numbers represent the average of the total number of individuals observed at any one time during each of the ten minute surveys (n = 5).
Observation Point Average S.E.
HP1 3.00 0.71
HP2 0.50 0.50
HP3 2.25 1.31
HP4 1.00 0.71
HP5 1.50 0.65
HP6 0.75 0.48
HP7 5.00 1.08
HP8 4.75 1.44
HP9 1.00 0.41
HP10 0.25 0.25
HP11 3.00 0.71
HP12 2.25 1.11
HP13 3.75 1.60
HP14 1.50 0.96
HP15 1.50 1.19
HP16 1.25 0.63
14 | P a g e Figure 3. Total number of observations of white-letter hairstreaks at Hadleigh Park
observation points, summer 2015. Observations were carried out at a series of fixed points. Each survey lasted ten minutes. Every individual observed during ten minutes was recorded. As such, values represent a measure of activity rather than actual population size.
15 | P a g e Table 4. Number of white-letter hairstreak individuals observed during fixed-length butterfly transect walks at Hadleigh Park, summer 2015. Walks carried out by David
Chandler. All WLH individuals observed during walks were recorded (Total observations) and the maximum observed at any one time at each section along the transect (Maximum
observed).
Date Total observations Maximum observed
11/06/2015 0 0
18/06/2015 0 0
25/06/2015 14 6
01/07/2015 40 19
10/07/2015 5 4
16/07/2015 4 3
27/07/2015 1 1
01/07/2015 2 2
08/07/2015 0 0
2.4 Discussion
White-letter hairstreak fixed point observation surveys were successful with substantial numbers being recorded at Hadleigh Park by all recorders. As expected, individuals were associated with the tops of elms or were observed nectaring on bramble along ri des (Goodyear and Middleton 2007). Results from timed counts indicated that individuals were distributed across the park with no single discernible hotspot. Highest average absolute counts and average maximum number of individuals counts were distributed across several of the observation points (Figures 5 and 6) and the location of highest counts varied on different survey dates (Figures 3 and 4). Indeed at least one white-letter hairstreak was seen at all 17 of the established observation points.
17 | P a g e Figure 6. Distribution of average maximum number of white-letter hairstreak butterflies observed simultaneously at Hadleigh Park observation
points, summer 2015. Observations were carried out at a series of fixed points. Each survey lasted ten minutes (n = 5). Maximum number of
18 | P a g e
3. Green haying forage creation experiment
3.1 Background
World-wide studies of native bees, both solitary and social, have revealed disturbing trends of decline over the last 40-50 years (Williams 1982; Rasmont, 1995; Biesmeijer et al., 2006; Kosior et al., 2007; Williams and Osborne 2009). If declines in UK bumblebees are to be halted and reversed, an adequate supply of suitable forage sources must be provided for the bees (Williams 1982). For forage provision to be effective, the specific foraging requirements of individual bumblebee species must be understood (Edwards 1998).
A three year investigation of the south Essex populations of UK Biodiversity Action Plan bumblebees, Bombus humilis and Bombus sylvarum, was carried out to assess their habitat management requirements (Connop 2008a). Foraging behaviour of the bees was recorded and the dietary preferences of the bees were assessed (Connop et al. 2010). Results of this study were fed into an experimental programme of forage creation at Hadleigh Park. The site was selected due to its suitability for a bumblebee habitat improvement program. The site runs between South Benfleet and Hadleigh in south Essex and is a mix of woodland, hedgerows, grassland and coastal grazing marsh with ponds and ditches. Historically the area was used for agriculture and much of the site was managed as open grassland. In more recent times, management has led to the development of substantial areas of scrub and loss of much bumblebee foraging and nesting habitat.
Site surveys at Hadleigh Park between 2003 and 2005 revealed both B. humilis and B.
sylvarum were present due to existing management. Areas of forage containing Odontites
verna, Lotus corniculatus/glaber, Trifolium pratense, Centaurea nigra, Ballota nigra and
Cirsium species supported the highest numbers of these bees. These flowers are generally most abundant on areas of the site managed for rough hay crops. Many of these areas were previously cut by mower but, due to management changes in 2003, they were managed by low-level grazing by cattle. Following the change in management, the target forage patches improved considerably. The fields were grazed twice a year, for approximately two months starting in March and again in September/October when bumblebee forage plant flowering is typically over. Scrub bands were kept down and several paths were mown on these sites along the edges of which much of the Odontites verna was found. Areas of tall grassland with a tussocky structure were also present on the site which might act as nesting habitat for the bumblebees (Carvell 2002; Connop 2008a).
19 | P a g e Scrub is a valuable habitat for a variety of wildlife. In particular, in relation to bumblebee conservation, Rubus fruticosus has been recognised as being of importance to B. humilis and B. sylvarum both in the Connop study (2008a) and by Peter Harvey (1999) and to other species such as the white-letter hairstreak (Satyrium w-album). Due to the abundance of scrub on the site compared to semi-natural grassland, however, it was decided that removal of 0.5 ha each year, initially over ten years, would still leave substantial scrub on the site whilst at the same time increasing the area of semi-natural grassland vital for many of the region’s nationally important invertebrates (Harvey 2000). Scrub clearance began in management unit 9 (Figure 2) in 2005 and a report was produced for the park recording clearance and initial recolonisation of the area (Connop 2006). This programme of clearance has continued annually extending into management unit 16 (Figure 7) and part of the Legacy Ecological Management Plan includes continued rollout of this programme of scrub clearance combined with a monitoring programme to assess the effects of this habitat management on the availability of suitable forage, bumblebee numbers on the site, and potential effects on other priority conservation species.
Following the clearance of the first 0.5 ha of scrub, an experiment was initiated to assess good practice for promoting the recolonisation of these scrub-cleared patches by floral species known to be favoured by foraging B. humilis and B. sylvarum workers. The cleared area was divided in half creating two trial plots (Figure 8), one of which was left to recolonise naturally, the other was covered in green hay (Trueman and Millet 2003) cut using a Ryetec flail mower collector from a nearby flower-rich area of the park (Figure 9). The area used for green hay harvesting was the same each year to ensure that the floral species comprising the majority of the green hay was as similar as possible. Initial response to the treatment was good and two further experimental areas were established in 2009 and 2010 following the same design.
In order to compare the value of the experimental areas for foraging bumblebees, floral and bumblebee surveys were carried out on the plots in 2007, 2008, 2009 and 2010, 2011. Results of these studies are presented in series of consultancy reports produced by Connop (2007; 2008b; 2009; 2010; 2011). Following the positive results from these surveys in terms of provision of suitable forage and the numbers and diversity of bumblebees foraging on these areas, a programme of green haying was carried out on all areas cleared subsequently.
The continued roll out of the scrub clearance programme at the park through the Legacy Ecological Management Plan and the associated monitoring programme provide an opportunity to re-visit the site and repeat the baseline surveys established as part of the original experimental research. By doing this it was possible to investigate:
whether management of the scrub cleared areas has been successful in retaining the bumblebee forage;
20 | P a g e
whether B. humilis and B. sylvarum are still utilising the scrub cleared areas;
any effects of planned changes to the management of these areas through a shift from an annual cut to a return to low-level grazing.
Figure 7. Plan of Hadleigh Park green hay plots (Aerial photo © Hadleigh Park). Areas 1-5 represent areas of scrub within management unit 9 (Figure 2) that have been cleared for bumblebee forage habitat creation. Area 5 represents green hay experiment area 5, green hayed in 2010. Area 6 represents the area that was planned to be cleared in 2011.
Management on the experimental areas has consisted of a single annual cut late in September/early October after flowering has ceased and when no more B. humilis or B. sylvarum were observed foraging. The cleared areas were cut by Ryetec flail mower and the cuttings were removed from all of the areas. Both the natural recolonisation and green hayed trial plots of each experiment area were managed in the same way. This was to ensure that the development of bumblebee forage on the plots could be monitored to assess whether initial green hay management continued to produce more suitable forage for B. sylvarum and B. humilis annually.
21 | P a g e Figure 8. Plan of scrub removal forage patch creation experiment at Hadleigh Park.
22 | P a g e The following sections document the methods and results of the repeated floral surveys to asses s the floral availability for foraging bumblebees.
3.2 Floral survey methods
Thirty 1 x 1 m quadrats (Figure 10) were randomly placed across each treatment plot of each of the experiment areas. In total 6 plots were surveyed (3 green hay plots and 3 natural recolonisation plots). The percentage of bare ground and relative abundance of each species within the quadrat in terms of number of flowers/inflorescences of each flowering plant species that were present and available to foraging bumblebees were recorded. One flower ‘unit’ was counted as a head (e.g. Trifolium species), spike (e.g. Prunella vulgaris), capitulum (e.g. Centaurea nigra), umbel (e.g. Achillea millefolium) or individual flower (e.g. Ranunculus acris) (Bowers 1985, Dramstad and Fry 1995, Carvell 2002 and Carvell et al. 2004). Flower identification followed Stace (2010).
Figure 10. 1 x 1 m quadrat used for floral surveys at Hadleigh Park.
23 | P a g e calculated by estimating the proportion of the 100 sub-units within the quadrat that each species was dominant in (creating a total score of 100 for each quadrat). These methods were used to ensure that some measure of species not currently flowering at the time of survey was made and so that a measure of vegetation cover was recorded.
3.3 Results
3.3.1. Floral and habitat feature diversity
Records of the floral species and habitat features recorded on the green hay plot and natural recolonisation plot of each experiment area during the August 2015 vegetation surveys are listed in Tables 5 to 7.
For experiment area 1 (established in 2006), the natural recolonisation plot recorded the highest diversity of floral species. In contrast, the green hay plot recorded the highest diversity of target species for the conservation priority bumblebees.
For experiment area 4 (established in 2009), the natural recolonisation plot and green hay plot recorded the same diversity of floral species, although they were not all the same species. Nevertheless the natural recolonisation plot recorded the highest diversity of target species for the conservation priority bumblebees.
24 | P a g e Table 5. Presence/absence list of floral species for experiment area 1 recorded during 2015 floral surveys. Thirty 1 x1 m quadrats were surveyed in each experimental plot (green hay plot and natural recolonisation plot). Floral species highlighted by shading are those that are considered to be target forage species for Bombus humilis and Bombus sylvarum (Connop 2008). Total floral species for each experimental plot is given under 'Count'. The number in brackets represents the total number of target forage species.
Floral species/habitat feature Green hay Natural recolonisation
Agrimonia eupatoria X X
Ballota nigra X
Centaurea nigra X X
Cirsium arvense X X
Cirsium vulgare X X
Crataegus monogyna X X
Galium verum X
Geranium molle X
Hypericum hirsutum X
Lotus corniculatus X X
Lotus glaber X
Medicago lupulina X X
Odontites verna X X
Papaver rhoeas X
Picris echioides X X
Plantago lanceolata X X
Potentilla reptans X X
Prunella vulgaris X X
Ranunculus repens X
Rosa canina X
Rubus fruticosus X
Senecio vulgaris X
Stachys officinalis X
Trifolium pratense X X
Trifolium repens X
Count 17 (8) 21 (7)
Bare ground X X
Grass/dead grass X X
25 | P a g e
Table 6.Presence/absence list of floral species for experiment area 4 recorded during 2015
floral surveys. Thirty 1 x1 m quadrats were surveyed in each experimental plot (green hay plot and natural recolonisation plot). Floral species highlighted by shading are those that are considered to be target forage species for Bombus humilis and Bombus sylvarum (Connop 2008). Total floral species for each experimental plot is given under 'Count'. The number in brackets represents the total number of target forage species.
Floral species/habitat feature Green hay Natural recolonisation
Agrimonia eupatoria X X
Centaurea nigra X X
Cirsium arvense X X
Cirsium vulgare X
Clinopodium vulgare X
Crataegus monogyna X X
Epilobium tetragonum X
Galium verum X
Geranium molle X
Hypericum hirsutum X X
Lotus corniculatus X X
Malva moschata X X
Malva sylvestris X
Medicago lupulina X X
Odontites verna X X
Picris echioides X X
Plantago lanceolata X X
Potentilla reptans X
Prunella vulgaris X X
Ranunculus repens X X
Rosa canina X X
Rubus fruticosus X X
Senecio vulgaris X
Trifolium pratense X X
Trifolium repens X
Vicia spp. X
Count 21 (6) 21 (7)
Bare ground X X
26 | P a g e Table 7. Presence/absence list of floral species for experiment area 5 recorded during 2015 floral surveys. Thirty 1 x1 m quadrats were surveyed in each experimental plot (green hay plot and natural recolonisation plot). Floral species highlighted by shading are those that are considered to be target forage species for Bombus humilis and Bombus sylvarum (Connop 2008). Total floral species for each experimental plot is given under 'Count'. The number in brackets represents the total number of target forage species.
Floral species/habitat feature Green hay Natural recolonisation
Agrimonia eupatoria X X
Acer campestre X
Ballota nigra X
Centaurea nigra X X
Convolvulus arvensis X
Crataegus mongyna X X
Crataegus monogyna X
Daucus carota X
Dipscus fullonum X
Hypericum hirsutum X
Lotus corniculatus X X
Medicago lupulina X
Odontites verna X
Picris echioides X
Plantgo lanceolata X
Potentilla reptans X
Rosa canina X X
Rubus fruticosus X X
Rumex crispus X
Trifolium pratense X
Count 9 (2) 18 (5)
Bare X
Grass/dead grass X X
3.3.2 Total flower heads
27 | P a g e Figure 11. Average number of all flower heads on the trial plots of experiment area 1, August 2015. Values calculated from 1 x 1 m quadrat surveys. [Error bars represent the standard error of the mean]
Average number of flower heads available to pollinators on experiment area 1 differed considerably between the two treatment plots (Figure 11). Substantially greater numbers were recorded on the natural recolonisation plot than on the green hay plot. Mann-Whitney U 2-tailed exact tests indicated that the difference in average flower heads was significant (p < 0.001).
28 | P a g e Average number of flower heads available to pollinators on experiment area 4 differed considerably between the two treatment plots (Figure 12). Substantially greater numbers were recorded on the natural recolonisation plot than on the green hay plot. Mann-Whitney U 2-tailed exact tests indicated that the difference in average flower heads was significant (p < 0.001).
Figure 13. Average number of all flower heads on the trial plots of experiment area 5, August 2015. Values calculated from 1 x 1 m quadrat surveys. [Error bars represent the standard error of the mean]
Average number of flower heads available to pollinators on experiment area 5 was substantially lower than on the other two experiment areas (Figure 13). Greater numbers were recorded on the green hay plot than on the natural recolonisation plot. Mann-Whitney U 2-tailed exact tests indicated that the difference in average flower heads was significant (p < 0.001).
3.3.3 Target forage species
Key forage species for Bombus humilis and Bombus sylvarum at Hadleigh Park are Odontites
verna, Lotus glaber, Lotus corniculatus, Trifolium pratense, Trifolium repens, Centaurea
nigra, Cirsium vulgare, Cirsium arvense and Ballota nigra.
Odontites verna
Average numbers of Odontites verna flowers varied considerably between experimental
29 | P a g e flower heads per quadrat was larger on the natural recolonisation areas than the green hayed areas. Mann-Whitney U 2-tailed exact tests indicated that the difference in average
Odontites verna flower heads was significant for experiment areas 1 and 4 (p < 0.001
respectively) but was not significant for experiment area 5 (p = 0.24).
Figure 14. Average number of Odontites verna flower heads on the trial plots of
experiment area 1, August 2015. Values calculated from 1 x 1 m quadrat surveys. [Error bars represent the standard error of the mean]
Figure 15. Average number of Odontites verna flower heads on the trial plots of
30 | P a g e
Figure 16. Average number of Odontites verna flower heads on the trial plots of
experiment area 5, August 2015. Values calculated from 1 x 1 m quadrat surveys. [Error bars represent the standard error of the mean]
Lotus species
Due to the small number of Lotus glaber flower heads recorded, Lotus glaber and Lotus
corniculatus were combined for flower head counts. Average numbers of Lotus species
flowers varied considerably between experimental areas and comparative treatment plots. Results for each experimental area are presented in Figures 17 to 19.
Figure 17. Average number of Lotus species flower heads on the trial plots of experiment
31 | P a g e
Figure 18. Average number of Lotus species flower heads on the trial plots of experiment
area 4, August 2015. Values calculated from 1 x 1 m quadrat surveys. [Error bars represent the standard error of the mean]
Figure 19. Average number of Lotus species flower heads on the trial plots of experiment
area 5, August 2015. Values calculated from 1 x 1 m quadrat surveys. [Error bars represent the standard error of the mean]
32 | P a g e 1 (p < 0.001) but was not significant for experiment areas 4 and 5 (p = 0.54 and 0.55 respectively).
Centaurea nigra
Average numbers of Centaurea nigra flowers varied considerably between comparative
experimental plots. Results for each experimental area are presented in Figures 20 to 22.
Figure 20. Average number of Centaurea nigra flower heads on the trial plots of
experiment area 1, August 2015. Values calculated from 1 x 1 m quadrat surveys. [Error bars represent the standard error of the mean]
Figure 21. Average number of Centaurea nigra flower heads on the trial plots of
33 | P a g e
Figure 22. Average number of Centaurea nigra flower heads on the trial plots of
experiment area 5, August 2015. Values calculated from 1 x1 m quadrat surveys. [Error bars represent the standard error of the mean]
In contrast to Lotus species and Odontites verna flowers, Centaurea nigra flowers were consistently more abundant on green hay plots than natural recolonisation plots. Mann-Whitney U 2-tailed exact tests indicated that the difference in average Centaurea nigra flower heads was significant for all experiment areas (p < 0.001 for 1, 4 and 5 respectively).
Trifolium pratense
Average numbers of Trifolium pratense flowers varied considerably between experiment
34 | P a g e
Figure 23. Average number of Trifolium pratense flower heads on the trial plots of
experiment area 1, August 2015. Values calculated from 1 x 1 m quadrat surveys. [Error bars represent the standard error of the mean]
Figure 24. Average number of Trifolium pratense flower heads on the trial plots of
35 | P a g e Other key forage species
Whilst the other key forage species for Bombus humilis and Bombus sylvarum at Hadleigh Park (Trifolium repens, Cirsium vulgare, Cirsium arvense and Ballota nigra) were recorded within the quadrat surveys, flowers of these species were rare and infrequent across the experimental plots. As such, no detailed analysis of comparative abundance of flower heads was made.
3.3.4 Vegetation cover
In addition to available flower heads, vegetation cover can provide a valuable measure of habitat value for pollinators and the effectiveness of management interventions. In particular vegetation cover surveys can quantify:
cover of target floral species not currently flowering but having recently flowered or still to flower providing additional forage resources;
presence of grassy swards providing nesting opportunities for ground nesting bumblebees such as Bombus humilis and Bombus sylvarum (Connop 2008);
abundance of recolonising scrub species that were targeted for removal by the original habitat management programme.
Table 8 provides a summary of the direction of average abundance (i.e. more abundant on green hay plot or natural recolonisation plot) and the level of statistical significance for this difference using Mann-Whitney U 2-tailed exact tests. Values are based on counts of all squares that the species was recorded in within each quadrat. The exception to this is grass/dead grass for which an additional measure of 'the number of squares it was the dominant vegetation in' is given. This was due to the almost ubiquitous nature of grass in terms of presence/absence within survey quadrats across all survey plots causing presence/absence counts to not provide meaningful data on the abundance of grasses.
36 | P a g e Table 8. Summary of the abundance and the level of statistical significance between target and non-target floral species on green hay plots and
natural recolonisation plots at Hadleigh Park, August 2015. Statistical difference was measured using Mann-Whitney U 2-tailed exact tests at a p
= 0.05 threshold for significance. Values are based on counts of all squares that the species was recorded in within each 1 x 1 m quadrat (n = 30 within each green hay plot and natural recolonisation plot). Where differences between treatment plots were significant, cells are shaded pink. Floral species are divided into target forage species for Bombus humilis and Bombus sylvarum foraging, grasses, and scrub. Due to the ubiquitous nature of grasses across the quadrat subunits (very few subunits recorded no grass at all) a dominance measure was also compared for grasses (i.e. number of squares where grass/dead grass was the dominant plant/feature).
Experiment area 1 Experiment area 4 Experiment area 5
Species/group
Highest average
count Significance
Highest average
count Significance
Highest average
count Significance
Ta rg e t fo ra ge
Odontites verna Natural p < 0.001 Natural p < 0.001 Natural p = 0.24 Lotus spp. Green hay p = 0.013 Green hay p < 0.001 Green hay p = 0.98 Centaurea nigra Green hay p < 0.001 Green hay p < 0.001 Green hay p < 0.001 Trifolium pratense Green hay p < 0.001 Green hay p < 0.001 Natural p = 1.00
G ra ss/ d e ad gr ass
Presence/absence Green hay p = 0.05 Natural p = 1.00 N = GH p = 1.00
Dominant squares Natural p = 0.001 Natural p < 0.001 Natural p = 0.05
Sc
ru
b
37 | P a g e With the exception of Odontites verna, significantly greater vegetation coverage was recorded on the green hay plots of experimental areas 1 and 4 for all target forage species. For experiment area 5 this was also the case with the exception of Trifolium pratense for which there was no significant difference. For Odontites verna, coverage was significantly greater on the natural recolonisation areas than the green hay areas for experiment areas 1 and 4. No significant difference was recorded for experiment area 5.
In terms of number of squares that grass and/or dead grass was recorded, significantly more was recorded in the green hay plot of experiment area 1 than the corresponding natural recolonisation plot, and no significant difference was recorded for experiment areas 4 and 5. Comparison of grass dominance, however, recorded significantly greater grass dominance on all three natural recolonisation plots than corresponding green hay plots.
The scrub species Crataegus monogyna was recorded with significantly greater cover on the natural recolonisation plots of all three experimental areas. Rubus fruticosus was recorded with significantly greater cover on the natural recolonisation plots of experiment areas 1 and 5 but was the opposite was true for experiment area 4. The third scrub species present in any number, Rosa canina, was recorded with significantly greater cover on the natural recolonisation plot of experiment area 1 but there was no significant difference on experiment areas 4 and 5.
Bare ground
Whilst a comprehensive cover of nectar and pollen-rich forage was a target for habitat creation, bare ground is an important habitat feature for species associated with Thames Terrace Grasslands and Open Mosaic Habitats in the Thames Corridor (Harvey 2000). It can act as a nesting resource for ground nesting aculeate Hymenoptera and also as basking areas for other thermophilic insects, particularly those at the northern edge of their range. As such the ratio of cover to bare ground was viewed as another key indicator for habitat quality in terms of habitat creation at Hadleigh Park.
38 | P a g e i)
ii)
iii)
Figure 25. Average percentage cover of vegetation in floral survey quadrats. Data from the
39 | P a g e 3.4 Discussion
Despite several years having passed since the green haying experimental trial plots were set up (nine, six and five years respectively for experiment areas 1, 4 and 5), substantial difference still persisted between the flora of the green hay areas and the corresponding natural recolonisation areas. This was apparent visually even prior to the quadrat surveys with divides in vegetation visible where the original green haying ended and the natural recolonisation areas began (Figures 26 to 28). Quadrat surveys supported this visual evidence with significant differences between the vegetation on the green hay plots and corresponding natural recolonisation plots.
Forage plants
Perhaps the starkest changes in the plots was the shift in overall total number of flower heads and Odontites verna abundance between the green hay plots and the natural recolonisation plots. Results of surveys carried out on the treatment plots of all three experimental areas a year after establishment identified significantly greater total flower heads and O. verna flower heads on the green hay plots compared to the natural recolonisation plots (Connop 2007, 2010, 2011).
40 | P a g e Figure 27. Visible line in vegetation differentiating the green hay plot from the natural recolonisation plot in experiment area 4, August 2015.
41 | P a g e At the time of this latest round of surveys, this was no longer the case for experiment areas 1 and 4 with significantly greater numbers of total flower heads and O. verna flower heads now recorded on the natural recolonisation plots. For experiment area 5, significantly more flower heads were recorded on the green hay plot but significantly more O. verna flowers were recorded on the natural recolonisation plot.
Odontites verna flowers are considered to be of particular importance to Bombus sylvarum
with the majority of visits of these bees on south Essex sites being made to these flowers (Connop et al. 2010). The shift in abundance of Odontites verna and other flowerheads between the green hay plots and natural recolonisation plots appeared to be related to successional processes. Green haying appears to be an excellent method for creating suitable forage areas for bumblebees over short time periods by accelerating recolonisation rates. This was demonstrated by green hay areas having significantly greater vegetation cover than natural recolonisation areas in the first 1 to 3 years after clearance and green haying. At the time of this round of surveys, green hay areas had complete vegetation cover with almost no bare areas, whereas natural recolonisation areas recorded greater areas of bare ground (still significantly so for experiment area 1). Odontites verna appears to be an opportunistic species at Hadleigh Park appearing on areas that are regularly cut or more heavily grazed, particularly along the edge of pathways and other short sward areas at the park. Evidence from these surveys indicated that the abundance of these plants (in terms of both number of flower heads and cover) reduces with the time following the original clearance and the maturing of the wildflower areas.
This pattern of development of flora over time is also apparent from the results for Lotus species. Initially following green haying, very few Lotus species flowers were recorded on the green hay plots. However, significantly greater cover of Lotus species was recorded on the green hay plots of experiment areas 1 and 4 during this latest survey. This was also the case
for Centaurea nigra with significantly greater cover and numbers of flower heads of this
species recorded on all green hay plots compared to natural recolonisation plots.
42 | P a g e Scrub
Another apparent difference between the two habitat management methodologies was the reoccurrence of scrub following the clearance and experimental treatments. Three scrub species, Crataegus monogyna, Rosa canina and Rubus fruticosus were recorded with any regularity. Of these C. monogyna cover was recorded as significantly greater on all three of the natural recolonisation plots, R. canina was recorded as significantly greater on the natural recolonisation plot of experiment area 4 but non-significantly different on the other two experiment areas, and R. fruticosus cover was significantly more on the natural recolonisation plots of experiment areas 1 and 5 but there was significantly more cover on the green hay plot of experiment area 4. This evidence indicated that the green haying had some effect in terms of reducing the recolonisation of sites by scrub following clearance. This may be related to the reduction in bare ground following green haying, or even a mulching effect created by the hay which also seemed to reduce colonisation by ruderals such as thistles on the green hay plots initially following treatment (Connop 2007; 2008b; 2009; 2010; 2011).
Grasses
The other substantial difference between the trial plots identified by the vegetation quadrat surveys was in relation to the colonisation of the trial plots by grasses. Comparison of the average number of squares that grass or standing dead grass was recorded in was not significantly different for experiment area 4 or 5 but was for experiment area 1 with greater numbers recorded for the green hay area. However, due to the almost ubiquitous recording of at least a small amount of grass in all quadrat sub-units across all plots, these results could be slightly misleading in terms of understanding grass cover. To reduce this effect, additional analysis was carried out on the number of quadrat sub-units for which grass was the dominant vegetation type. By carrying out this assessment it was possible to compare the proportion of grass dominance of each treatment plot. Results indicated that significantly greater dominance of grasses was found on all natural recolonisation plots compared to green hayed plots. This provided additional evidence of the impact that green haying can have on the subsequent development of suitable foraging habitat for bumblebees.
43 | P a g e i)
ii)
[image:44.596.72.523.45.692.2]iii)
44 | P a g e the grass dominated area created in experiment area 5 may well have additional value to the park in terms of creating suitable nesting habitat for the conservation priority bumblebees. Indeed another carder bee species considered to nest in dense grass swards, Bombus lapidarius, was observed nesting in experiment area 5 during the timed bumblebee counts (Figure 30). Several B. humilis individuals were also observed disappearing into the long grass in this area where no apparent suitable forage was available. Despite searches, however, no B. humilis nest were located.
45 | P a g e
4. Bumblebee survey
4.1 Background
As part of the bumblebee monitoring and habitat creation programme established at Hadleigh Park, counts of bumblebees utilising the most forage-rich areas of the site have been carried out. The purpose of these surveys is to provide long-term monitoring of population size so that an assessment can be made of the 'health' of the bumblebee populations in the park including any effects of the habitat creation programme. Such monitoring enables park managers to understand whether bumblebees are locating and exploiting the new forage resources and, as such, whether habitat management efforts are having a beneficial effect on the target bumblebees. The monitoring programme also provides a barometer for the populations of conservation priority bumblebee species at the park revealing long-term population trends from which the stochastic effects of good and poor climatic years can be disregarded.
4.2 Methodology
Bumblebee population baseline surveys were established at Hadleigh Park in 2003. These comprised of standardised timed walking surveys on approximately equal areas of the most forage-rich patches of the site (Figure 31). In 2007, following the establishment of the first experimental green hay and natural recolonisation plots in experiment area 1, these walking surveys were expanded to included the newly created plots. Additional experimental plots were added to these timed survey walks in subsequent years.
46 | P a g e Figure 31. Bumblebee forage-rich areas of Hadleigh Park. Yellow areas represent the most forage-rich areas within Hadleigh Park supporting the highest numbers of B. humilis and B.
sylvarum when surveys began in 2003 to 2005. The red dot represents the location of the
first scrub clearance area for the green hay experiment. Aerial Photo © ECC, Map prepared using ESRI ArcGIS.
Identification of the bumblebees followed Prŷs-Jones and Corbet’s key (1987). Bumblebees which could not be identified whilst foraging were captured using queen bee marking plunger cages (Kwak, 1987) and were identified by species morphology using a field lens. Where workers of B. humilis and B. pascuorum were old and worn making it impossible to use abdomen hair colouration to differentiate between the two species, individuals were recorded as B. pascuorum to avoid overestimating numbers of the target species B. humilis. For non-target species for which use of a field lens was insufficient to separate individuals, species were grouped together (e.g. B. terrestris/lucorum aggregate). Despite thorough searching by the authors and Peter Harvey (personal communications) Bombus muscorum has not been recorded in this area of the Thames Corridor in recent years. As such this species has been disregarded during the timed bee walks making differentiation of the 'brown' bumblebees more straightforward.
47 | P a g e technique for these surveys due to the time it would take impacting surveying time. For this reason the bee walks were carried out in a slow and methodical manner in an attempt to avoid counting the same bee twice. It was considered that this combination of avoidance of counting the same individual and repeated methodology both within and between patches would generate accurate comparative counts rather than actual counts. The technique therefore created an accurate comparison of the relative value of the forage areas in terms of the relative number of bumblebees they supported. This created a comparable indices of bumblebee numbers at each survey area within the park that could be compared between areas and across different years.
4.3 Results
Results were analysed to assess the abundance and diversity of bumblebees on green hay plots compared to corresponding natural recolonisation areas on experiment areas 1, 4 and 5. Numbers and diversity on all of the originally established forage-rich areas and the cleared areas were also compared. Forage preferences on each area were also analysed.
Comparison between green hay and natural recolonisation areas
[image:48.596.92.495.459.692.2]Timed bumblebee counts in experiment area 1 recorded greater average counts for target species B. humilis and for all Bombus species on the natural recolonisation plot (Figure 32).
Figure 32. Average bumblebee counts on experiment area 1. Averages calculated based on number of individuals observed in the green hay (GH) and natural recolonisation plots (N) during a fifteen minute walked survey (n = 10). Averages given for all bumblebee species (All
Bombus), and the habitat management target species Bombus humilis and Bombus
48 | P a g e Average counts for B. sylvarum were higher on the green hay plot. Average bumblebee species diversity was also higher on the natural recolonis ation plot (Figure 33).
Figure 33. Average bumblebee species diversity on experiment area 1. Average diversity calculated based on number of species observed in the green hay (GH) and natural
recolonisation plots (N) during a fifteen minute walked survey (n = 10). Averages given for all bumblebee species (All Bombus), and the habitat management target species Bombus
humilis and Bombus sylvarum. [Error bars denote standard error of the mean]
Mann-Whitney U 2-tailed exact tests indicated that the difference in bumblebee counts between the green hay plot and natural recolonisation plot of experiment area 1 was
significant for all Bombus species (p = 0.008), but was not significant for B. humilis (p = 0.59), B. sylvarum (p = 0.70), and species diversity (p = 0.14).
Timed bumblebee counts in experiment area 4 recorded greater average counts for target species B. sylvarum and for all Bombus species on the natural recolonisation plot (Figure 34). Average counts for B. humilis were higher on the green hay plot. Average bumblebee
49 | P a g e Figure 34. Average bumblebee counts on experiment area 4. Averages calculated based on number of individuals observed in the green hay (GH) and natural recolonisation plots (N) during a fifteen minute walked survey (n = 10). Averages given for all bumblebee species (All
Bombus), and the habitat management target species Bombus humilis and Bombus
sylvarum. [Error bars denote standard error of the mean]
Figure 35. Average bumblebee species diversity on experiment area 4. Average diversity calculated based on number of species observed in the green hay (GH) and natural
recolonisation plots (N) during a fifteen minute walked survey (n = 10). Averages given for all bumblebee species (All Bombus), and the habitat management target species Bombus
[image:50.596.88.493.443.684.2]50 | P a g e Mann-Whitney U 2-tailed exact tests indicated that the difference in bumblebee counts between the green hay plot and natural recolonisation plot of experiment area 1 was significant for B. sylvarum (p = 0.02), but was not significant for B. humilis (p = 0.96), all Bombus species (p = 0.11), and species diversity (p = 0.36).
Timed bumblebee counts in experiment area 5 recorded greater average counts for target species B. humilis and for all Bombus species on the green hay plot (Figure 36). No B.
sylvarum were recorded on the green hay plot or on the natural recolonisation plot. Average bumblebee species diversity was also slightly higher on the green hay plot (Figure 37).
[image:51.596.92.494.395.642.2]Mann-Whitney U 2-tailed exact tests indicated that the difference in bumblebee counts between the green hay plot and natural recolonisation plot of experiment area 1 was significant for all Bombus species (p = 0.03), but was not significant for B. humilis (p = 0.13) and species diversity (p = 0.89).
Figure 36. Average bumblebee counts on experiment area 5. Averages calculated based on number of individuals observed in the green hay (GH) and natural recolonisation plots (N) during a fifteen minute walked survey (n = 10). Averages given for all bumblebee species (All
Bombus), and the habitat management target species Bombus humilis and Bombus
51 | P a g e Figure 37. Average bumblebee species diversity on experiment area 5. Average diversity calculated based on number of species observed in the green hay (GH) and natural
recolonisation plots (N) during a fifteen minute walked survey (n = 10). Averages given for all bumblebee species (All Bombus), and the habitat management target species Bombus
humilis and Bombus sylvarum. [Error bars denote standard error of the mean]
Timed indices counts for all areas
Timed indices counts for experiment areas 1, 4 and 5 were compared to those recorded for the most forage-rich areas of Hadleigh Park when surveys were established in 2003. Results for B. humilis in 2015 are presented in Figure 38.
Highest average B. humilis counts were recorded on Benfleet Downs. However, numbers on the other historical key forage areas at the park were comparable with the newly created green hay plots of experiment areas 1 and 4 and the natural recolonisation plots of experiment areas 1 and 4. Average numbers on the green hay plot and natural recolonisation plot of experiment area 5 were the lowest recorded across the park.
52 | P a g e
Figure 38. Average timed counts of B. humilis at Hadleigh Park, August 2015. Bee walk
surveys carried out on experiment scrub clearance areas and other key forage areas. Timed counts of fifteen minutes in duration. All individuals recorded during walk. Ten walks carried out in each area. [Error bars denote standard error of the mean]
Figure 39. Average timed counts of B. sylvarum at Hadleigh Park, August 2015. Bee walk
[image:53.596.88.482.422.704.2]53 | P a g e Similarly to B. humilis counts, highest average B. sylvarum counts were recorded on Benfleet Downs. Numbers on the other areas of the site varied substantially. Next highest numbers were recorded on the green hay and natural recolonisation plots of experiment area 1. Numbers here were higher than on the other forage-rich areas of the park. The natural recolonisation plot of experiment area 4 also recorded counts comparable to other forage-rich areas of the park. Experiment area 4 green hay plot recorded fewer individuals, however, numbers were still similar to the 'Top field' historically forage-rich area.
Experiment area 5 recorded no B. sylvarum on the green hay or natural recolonisation areas.
[image:54.596.89.481.251.536.2]Timed indices counts for all Bombus species in 2015 are presented in Figure 40.
Figure 40. Average timed counts of all Bombus species individualsat Hadleigh Park, August
2015. Bee walk surveys carried out on experiment scrub clearance areas and other key forage areas. Timed counts of fifteen minutes in duration. All individuals recorded during walk. Ten walks carried out in each area. [Error bars denote standard error of the mean]