The London School of Economics and Political Science
London Office Performance: Determinants and Measurement of Capital Returns
Gerard Henry Dericks III
2
Declaration
I certify that this thesis presented for examination for the PhD degree of the London School of Economics and Political Science is solely my own work other than where I have clearly indicated that it is the work of others. There is no joint work contained herein, nor work submitted for the attainment of a previous degree, nor has a third party been utilized for editorial purposes.
The copyright of this thesis rests with the author. Quotation from it is permitted, provided that full acknowledgement is made. This thesis may not be reproduced without my prior written consent.
I warrant that this authorisation does not, to the best of my belief, infringe the rights of any third party.
3
Acknowledgements
If a community is required to raise a child then no less than a small city is demanded by a thesis. Although I could not possibly name everyone who has contributed to this work anymore than I could affix a phonebook to this page, I shall try with some degree of failure to name those people and organisations which have had an especially large and predominately positive influence. Without a hint of irony the author would like to thank Paul Cheshire, Christian Hilber, Steve Gibbons, Elaine Gascoyne, Samuel Sebba, Gavin Murgatroyd, Gardiner & Theobald, Wenjie Wu, Landmark Information Group, Adam Ozimek, Transport for London, City of London Police, City of London Planning Department, Mayor of London, Google Maps, Derrick Reed, Hannah Lakey, Theresa Keogh, Joseph Kelly, Alessandra Scandura, Kerwin Datu, Rosa Sanchis-Guarner, Alejandra Castrodad-Rodriguez, Sejeong Ha, Prabhjot Babra, Phil Hammond, Steve Waterman, Christina Burbanks, Nick Price, Wai Sau Chan, Marc Espinet, Stephen Jenkins, Thomson-Reuters, Bloomberg, the FTSE Group, Investment Property Databank, Property Market Analysis UK Ltd, Real Capital Analytics, and Estates Gazette.
4
Preamble
While collecting office building data on foot on August 16th 2011, the author’s activities were relayed to the City of London police by suspicious security at 99 Queen Victoria Street, at which point he was intercepted for search and questioning. In spite of the benign nature of his activities1 he was informed by the police that he only very narrowly escaped arrest by fortune of possessing in person an old letter addressed to him from LSE which corroborated his status as a research student. It is the author’s sincere wish that in future research students need not expose themselves to imprisonment and deportation in order to fulfil their degree requirements.
5
6
Thesis Abstract
7
Contents
Declaration ... 2
Acknowledgements ... 3
Preamble ... 4
Thesis Abstract ... 6
Thesis Introduction... 14
Chapter 1: License to build: rent-seeking by design ... 18
Abstract ... 18
Introduction ... 19
Literature Review ... 33
Data ... 37
Analysis ... 55
Discussion ... 76
Conclusion ... 88
References ... 92
Appendix A: Policy on the location and design of tall and large buildings ... 97
Appendix B: Separately tested but omitted controls ... 98
Appendix C: Descriptive statistics ... 100
Appendix D: Net-to-gross internal area ratio ... 104
Appendix E: Occupancy rate excluded comparison ... 105
Appendix F: Robustness checks... 107
Chapter 2 Transition ... 112
Chapter 2: Spatial heterogeneity in commercial repeat-sales indices ... 113
Abstract ... 113
8
Literature Review ... 117
Data ... 120
Analysis ... 124
Conclusion ... 181
References ... 185
Appendix A: EDC Instrumental variable first-stage regressions ... 189
Appendix B: Planning application refusal rate instrumental variable first-stages ... 190
Appendix C: Heckman corrections on hedonic regressions ... 191
Appendix D: Results of separately tested factors on repeat-sales... 198
Chapter 3 Transition ... 206
Chapter 3: Commercial real estate price indices: A comparative analysis of the London office market ... 207
Abstract ... 207
Introduction ... 208
Valuation-based price indices ... 210
Transaction-based price indices ... 217
Hybrid Indices ... 238
Data ... 244
Empirical comparison of alternative indices ... 252
Discussion ... 264
Conclusion ... 269
References ... 272
Appendix A: IPD UK ALL Annual ... 279
Appendix B: FTW level-based index time-weights ... 280
9
10
List of Tables
Table 1: Famous architect and awards ... 39
Table 2: Famous architect buildings in sample ... 41
Table 3: Tallest non-famous-architect office buildings in sample ... 42
Table 4: Tallest inner London office buildings not in sample ... 43
Table 5: Tallest proposed inner London office buildings with planning permission ... 44
Table 6: Conservation areas in primary central London boroughs ... 47
Table 7: Dependent variable is Floorspace/Curtilage ... 57
Table 8: Dependent variable is Floorspace/Curtilage ... 59
Table 9: Dependent variable is Total above ground floors ... 61
Table 10: Dependent variable is building Footprint area / Curtilage area ... 63
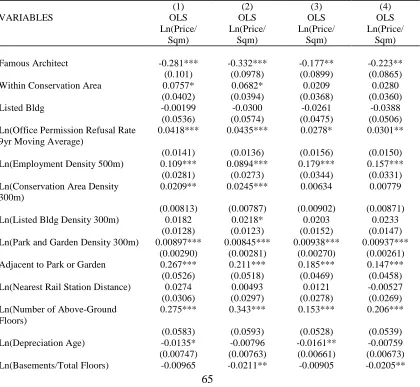
Table 11: Dependent variable is the natural log of (Price / Total floorspace sqm) ... 65
Table 12: Dependent variable is the natural log of (Price / Total floorspace sqm) ... 68
Table 13: Dependent variable is the natural log of (Price / Curtilage sqm) ... 71
Table 14: Dependent variable is the natural log of (Price / Curtilage sqm). ... 74
Table 15: City of London means and assumed values ... 79
Table 16: 2000-05 Average regulatory tax comparisons ... 85
Table 17: Descriptive statistics of data used on building size regressions ... 100
Table 18: Descriptive Statistics of data used on hedonic regressions ... 101
Table 19: Lifts per floor ... 104
Table 20: Testing whether a positive effect of famous architect on sale-price is ‘stolen’ by the occupancy rate ... 105
Table 21: Floorspace/Curtilage robustness check ... 108
Table 22: Total above ground floors robustness check ... 109
Table 23: Price/Curtilage robustness check ... 110
Table 24: Proportion of Sale and Repeat-sales floorspace sold in each postcode sector as a function of the proportion of total floorspace in the postcode sector. ... 131
Table 25: Probit of the probability of sale vs no-sale on employment density changes. ... 140
Table 26: Repeat-sales price Index including Previous Year Employment Density Changes. Dependent variable is the natural-log of the price-relative. ... 144
11
Table 28: Probit regression of Sales and Repeat-Sales on submarket location ... 160
Table 29: Repeat-sales regression with submarket dummy variables ... 162
Table 30: Proportion of First and Second Sales of Repeat-sales pair by year and submarket ... 165
Table 31: Repeat-sales and Instrumented Planning Refusal Rates ... 168
Table 32: Heckman’s corrected Repeat-sales indices: Naïve and Instrumented EDC ... 176
Table 33: Heckman’s corrected Repeat-sales indices: Submarkets and Instrumented EDC ... 179
Table 34: Dependent variable is Previous Year Employment Density Change ... 189
Table 35: Dependent variable is Planning Refusal Rate Average 1990-2008 ... 190
Table 36: Heckman’s correction of Non-Repeat-sales sample hedonic regression ... 192
Table 37: Heckman’s correction of Repeat-sales sample hedonic regression ... 195
Table 38: Probability of Repeat-sales outside the Congestion Charging Zone (CCZ) ... 199
Table 39: Congestion charge Repeat-sales regression ... 200
Table 40: Repeat-sales vs Sales on Occupancy rate probit ... 201
Table 41: Occupancy-rate Repeat-sales regression... 202
Table 42: Repeat-sales vs Sales on Sale-leaseback probit ... 204
Table 43: Sale-leaseback Repeat-sales regressions... 205
Table 44: Example 1, X-marks the sale. ... 223
Table 45: Example 2, Monthly sales data ... 228
Table 46: Repeat-sales price index heteroskedasticity correction comparison ... 249
Table 47: Repeat-sales price index WLS2 2nd stage ... 250
Table 48: UK Real Estate Securities ... 250
Table 49: Index Descriptive Statistics 1998-2010, all indices are unlevered ... 262
Table 50: Index Descriptive Statistics with TLI 2001-2010, all indices are unlevered ... 262
Table 51: Contemporaneous Cross-Correlation of Returns IPD UK All 1998-2010 ... 263
Table 52: Contemporaneous Cross Correlation of Returns TLI 2001-2010 ... 263
Table 53: Hedonic observations by year ... 266
Table 54: Hedonic regression fractional time-weightings ... 280
12
List of Figures
Figure 1: Stop and Search Record ... 5
Figure 2: London Submarkets according to Estates Gazette ... 21
Figure 3: Central London submarket and Local Planning Authority boundaries ... 22
Figure 4: Map of inner London boroughs and office locations (in red)... 46
Figure 5: The 546 postcode sectors ... 51
Figure 6: The 546 postcode sectors and 387 office locations ... 52
Figure 7: Construction costs only (per sqm) and net to gross ratios as a function of building height ... 77
Figure 8: Total land, construction and design costs per sqm as a function of building height ... 78
Figure 9: Total land, construction and design costs as a function of building height ... 78
Figure 10: Price per m2 for ‘average’ office in City of London compared with building costs. ... 80
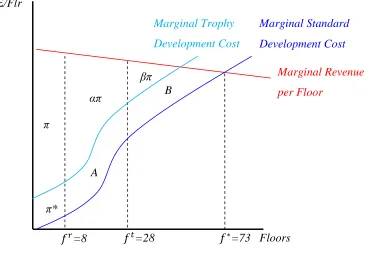
Figure 11: Profitability of trophy architects ... 82
Figure 12: Estimated regulatory tax (RT) by submarket ... 85
Figure 13: Postcode sectors of central (pink) and inner London (green) ... 122
Figure 14: Office building locations by postcode sector 2002 (central London only) ... 125
Figure 15: Office floorspace m2 by postcode sector 2002 (central London only) ... 126
Figure 16: Sales only - never repeat-sold (409 total, 2000-08, central London, 244 postcode sectors) ... 128
Figure 17: Repeat-sales only – second sale or more (173 total, 2000-08, central London, 244 postcode sectors) ... 129
Figure 18: Sales and Repeat-sales (582 total, 2000-08, central London, 244 postcode sectors) ... 130
Figure 19: Sales 2000-08 residual with respect to office stock. ... 133
Figure 20: Repeat-Sales 2000-08 residual with respect to office stock ... 135
Figure 21: Employment levels and Repeat-sales ... 136
Figure 22: Spatial distribution of London employment 2000-08... 137
Figure 23: OLS price index comparison ... 148
13
Figure 25: London Boroughs, Submarkets, and Repeat-sales Locations... 152
Figure 26: Annual IPD central London Submarkets Price-Index comparison 1980-2010 153 Figure 27: Central London office space completions 2002-2011 ... 156
Figure 28: IPD West End vs the City of London annual price-growth and price-level differences ... 158
Figure 29: Quarterly IPD London submarket price-index Dec 2000-Dec 2010 ... 159
Figure 30: Repeat-sales indices by submarket ... 163
Figure 31: Comparison of Naïve and Submarket-Corrected Repeat-sales price indices ... 164
Figure 32: Hedonic index model specification and results ... 247
Figure 33: IPD Inner London Index ... 253
Figure 34: Desmoothed IPD Inner London Index ... 253
Figure 35: Hedonic Index... 255
Figure 36: Repeat-sales price index heteroskedasticity corrections comparison ... 256
Figure 37: Repeat-Sales Index ... 257
Figure 38: Datastream REITs... 258
Figure 39: FTSE All Shares Index ... 259
Figure 40: IPD Transaction-Linked Index ... 260
Figure 41: Repeat-sales and Hedonic indices same sample comparison ... 266
14
Thesis Introduction
In contrast to many other areas of the economy, research into commercial property is frequently hindered by the scarcity of large high quality datasets. As a result of this deficit, many questions germane to effective policy and economic efficiency remain poorly understood or altogether unanswered. In an effort to in part address these deficiencies, this thesis utilizes a unique dataset which combines primary data collection from office sites in London with secondary sale-transaction and building stock information from some of the most prominent property-data providers in London.
Data on the London office market is of particular interest because London is one of the world’s premier financial and business centres, and while liquid and attracting high-profile investors from around the world, its real estate market is surprisingly opaque. This lack of transparency has often been cited as a critical barrier to the wider acceptance of real estate assets within the institutional investment community. Moreover, London is one of the world’s most highly regulated land markets; with undevelopable encircling green belts, zoning and height restrictions, expensive and uncertain planning controls, and ubiquitous historic preservation. Therefore questions of political economy can not only be analysed with some diversity, but the answers to these questions are liable to have a direct and material impact on the welfare of some 8 million citizens.
15
may make it possible to formulate policy which can improve the operation of the market and better respond to unanticipated economic shocks.
With these goals in mind, the first chapter of this thesis examines whether star architects are exceptionally allowed to build bigger office buildings in London, and therefore earn supernumerary returns on their land plots. Given that the extant literature has identified substantial economic rents generated by the strict land market regulations in force across London, this chapter extends the previous theoretical work of Krueger (1974) to test empirically whether famous architects are able to successfully engage in an aesthetic form of rent-seeking. Even though London currently sports some of the world’s most eccentric office building designs, the extent to which these designs and the famous architects who create them are able to influence the planning process has hitherto been unexplored. This research finds that outside protected conservation areas famous architects can not only build taller (by 20 floors), but that their designs have no net effect upon the ultimate sale price per m2 of buildings. For a given land plot however, the ability to build tall increases developer profits (by approximately 100%) even when accounting for the increased design fees charged by famous architects and building to their generally higher standards.
16
The second chapter investigates potential sources of bias in repeat-sales price indices of commercial property by constructing such an index for the central London office market and examining the sources of index change relative to the market as a whole. Repeat-sales indices are essentially a fixed-effects modelling specification and therefore implicitly control for all constant building and locational characteristics when estimating price-levels. Since commercial property is relatively heterogeneous and often difficult to model explicitly, in recent years the repeat-sales method has grown in popularity and practice. However, because the repeat-sales method does not model locational characteristics explicitly, its validity is sensitive to external changes in the environment of sampled buildings that are not representative of the market as a whole. Although the problem of sample selection bias in repeat-sales has been well explored in the context of residential property, the literature has yet to examine the existence of bias in repeat-sales of commercial property or to empirically investigate the potential sources of bias in these indices. This section finds evidence for bias in a commercial repeat-sales index of London caused by employment density changes and the restrictiveness of new development in the governing local authority. This discrepancy arises because repeat-sales occur disproportionately in areas where changes in these price determinants differ systemically from the office stock as a whole.
17
production of a hedonic time-series of commercial offices in London is not only feasible but likely to be superior to the more common method adopted by industry of repeat-sales. This result holds due to the reduction in effective sample size and the concomitant decrease in representativeness that occurs as a result of the need to exclude all property sales which do not occur in multiples over the study period. We can be confident in this result due to the introduction of a novel methodology for verifying the validity of our hedonic model: comparing the hedonic price index with a repeat-sales index consisting of the same sample of sales. With specific regard to repeat-sales, this paper finds that the 3SLS procedure conventionally used to correct for heteroskedasticity in housing is indistinguishable in commercial offices from an uncorrected OLS series.
Other notable findings include the fact that, contrary to previous research, real estate securities in the UK follow the movements of London office property more closely than the stock market as a whole, the method of desmoothing valuations introduced by Geltner (1993b) produces a mixed analogue to actual transaction-based series which could perhaps be improved with better calibration of the desmoothing parameter, and that the relatively new transaction-linked index methodology is extremely similar to its underlying uncorrected valuation index. Finally, this paper introduces an original fractional-time weighting procedure for repeat-sales that allows for simpler calculation of transformation-bias while maintaining a minimum of temporal aggregation bias.
18
Chapter 1: License to build: rent-seeking by design
Abstract
19
Introduction
“If you want to build a tall building, as long as you’ve got a world-class design and it is in one of two locations we will go along with it”2
Ken Livingstone, Mayor of London 2000-08.
London office towers make headlines worldwide with eccentric designs ranging from gherkins and cheese-graters to walkie-talkies and cans-of-ham. Although London has strict planning controls in place to monitor new and existing building developments, these restrictions are to a certain extent flexible and based on the discretion of local planners and politicians. The British use of the ‘development control’ mechanism to implement its planning system on a case by case basis, rather than a Master Plan or Zoning system, makes it possible in principle to obtain specific exceptions to these otherwise tight and binding regulations. Furthermore, there is now substantial evidence to suggest that supply restrictions across office (Cheshire and Hilber, 2008), retail (Cheshire et al, 2011) and residential (Hall et al, 1973; Evans, 1991; and Hilber and Vermeulen, 2010) property sectors in the United Kingdom are responsible for the creation of extensive market distortions, and these market distortions create the potential for savvy and organised market-actors to earn economic rents (Pennington, 2000). In a similar vein to Krueger’s (1974) seminal paper on the welfare implications of rent-seeking in the context of import licensing, the combination of semi-binding land-use controls and economic rents in London has meant that developers who can convince planning authorities to permit tall building designs can earn excess profits on their land investments. While the competition for such permits is by all accounts a deadweight social loss, unlike the case of Krueger, in the present context leveraging architectural design to exact special privileges may in fact lead to some ancillary social benefits in the form of better public architecture. This paper examines whether commercial office buildings in London designed and built by famous architects are able to exceptionally exploit the flexibility of the planning system in order to
2 The Observer, October 1st 2006, “High Hopes: ‘London will soon have 18-20 skyscrapers’”.
20
build larger buildings on a given plot of land, and to sell buildings for more compared to offices which lack an accomplished designer.
The London office market
London is perhaps the world’s premier financial centre attracting both international office occupiers and investors3. Its office market is frequently ranked as the world’s most expensive and has one of the highest turnover rates in the world4: containing nearly 20 million m2 of office space over 55 square kilometres. Although the geographic boundaries may differ slightly according to opinion, London is characterised by four main office submarkets. From West to East these are; the West-End, Mid-town, the City of London (City): centred around the Bank of England, and the modern business district of Canary Wharf (see Figure 2). The Canary Wharf and City office markets are predominantly tenanted by financial service firms, whereas the West End is distinguished by creative industries, hedge funds and private equity firms, and Mid-town is known for its legal, media and publishing tenants. Rents per m2 are highest in the West End. Mid-town office rents are some 20-30% lower than the West End, while rents in the City are some 15-20% lower, and rents in Canary Wharf are lower still. The West End is primarily administered by the City of Westminster, Mid-Town is divided between the City of Westminster, Camden Islington, and the City of London, the City of London submarket is predominately run by its namesake, and Canary Wharf is governed by Tower Hamlets (see Figure 3 and Figure 4).
3 By value, only 34% of investments between 2007-2011 in the City of London office market were
undertaken by UK-based investors, and over 50% of the office stock in the City of London is held by international investors (Lizieri, Reinhart, and Baum, 2011).
4 Total office turnover Q1 2007-Q2 2012; London US$163bn, Tokyo US$168bn, and New York US$180bn,
21
22
23
The history of building height regulation in London
There exists two layers of building size regulations in London, the first is building control which is statutory and fixed5, the second is planning control which is a matter of policy and therefore more flexible. The modern history of building size regulation in London begins with the London Council Act of 1890, which set a statutory limit of 27m plus two-storeys in the roof (Inwood, 2005). This was shortly followed by the London Building Act of 1894, which restricted maximum building height to 24m to the roof cornice, with an additional 6m allowed for a recessed roof (Simon, 1996). These height limits were billed as a matter of safety, as the London fire brigade did not have ladders long enough to reach exceptionally tall buildings6. These restrictions came right at the time that building very tall became not only possible technologically due the introduction of steel skeletons in the 1880s, but also profitable because of the arrival of passenger lifts (Turvey, 1998). As a result of the statutory height restrictions London produced no buildings which could be termed ‘skyscrapers’ throughout the first half of the 20th century7, though at that time many such structures were rising elsewhere across the industrialized world.
In addition to this statutory limit, further height restrictions were imposed in 1938 which specially protected views of St Paul’s Cathedral and the Monument from obstruction by new development in their vicinity. Although initially these protected sightlines were merely a ‘gentleman’s agreement’ among City developers, they were remarkably effective until such time as they were incorporated more formally into the City of London’s development plan. The current extent of the protected sightlines are broadly consist with their original 1938 manifestation, though they were extended in 1989 to include some Northern views of St Paul’s dome (City of London, 2007).
5
However special dispensations were exceptionally given to build in excess of statutory height limits, such as the 19-floor University of London Senate House built in 1937 and designed by Charles Holden: winner of the 1936 Royal Institute of British Architects (RIBA) Gold Medal.
6 Although legend has it that Queen Victoria balked at the construction of tall buildings after the construction
of the 12-storey Queen Anne’s Mansions in 1873 blocked her view of parliament from Buckingham Palace. At the time of construction this was the tallest residential building in Britain.
7 Turvey (1998) notes however that even with the widespread use of lifts it took several decades for a
24
However outside of these protected sight-lines, the statutory limit was finally rescinded by the London County Council (LCC) in 1956 due to the advent of fire-lifts, at which point the London County Council Plan of 1951 was the next highest layer of binding building size regulation. Although the regulations contained therein did not control height per se, it did control building height indirectly through allowable plot-ratios8 and minimum angles from the opposite pavement to the building’s cornice (usually 56°)9. The plot-ratio restrictions varied according to location. For most areas in London the maximum allowable plot-ratio was 5:1, for central areas of the City close to the Bank of England the permitted ratio was 5½:1, for other areas deemed sensitive to increased density the restriction was set at 2:1 (City of London, 2010). Although originally intended to be maxima in theory, these plot-ratios came to be regarded as minima in practice. For instance, loopholes in planning law such as the notorious Schedule 3 of the Town & Country Planning Act of 1947 allowed existing buildings to be redeveloped with 10% greater cubic capacity than the building which preceded it. Since old buildings have higher ceilings, thicker and more numerous walls, larger passages and the like, the rentable floorspace of such redeveloped structures could be increased considerably10. The removal of the statutory height limit in 1956 ushered forth a boom in the construction of tall buildings in the late 1950s and early 1960s, which finally saw Christopher Wren’s new St Paul’s Cathedral dethroned as the tallest structure in London after a reign of over 250 years11.
The LCC remained in charge of planning control until it was superseded by the Greater London Council (GLC) in 1965, at which point planning control was partly devolved to the local boroughs12. With the dissolution of the LCC, local boroughs initially maintained the old-LCC plot-ratio restrictions in force until such time as they produced new regulations of their own. In addition, in 1976 the GLC produced the Greater London Development Plan
8 The ratio of total building floorspace to total land-plot area: effectively a control on height.
9 This restriction was enforced to ensure that a certain amount of daylight filtered onto workers’ desks
(Marriott, 1989, pp. 30).
10 This regulation can explain for instance the disproportionate size of the 21-storey New Scotland Yard at 10
Broadway in the West End, built at an effective ratio of 7:1 in spite of the fact that the maximum plot-ratio supposedly allowed by the LCC at that site was 3½:1 (Marriott 1989, pp. 171).
11 The offending building was the BT Tower, see Table 4.
25
which continued plot-ratio controls at the central-level. These planning controls existed concurrently with the plot-ratio restrictions set by the local boroughs until the GLC was finally abolished in 1986 and the Secretary of State for the Environment’s Strategic Planning Guidance for London 1989 and the Planning and Compensation Act 1991 were published. These policy changes extended the power of local authorities to adopt their own development plans without direct permission from the Secretary of State (Pennington, 2000). In the case of the City of London, new development plans were implemented for local areas piecemeal, beginning with Smithfield in 1981 and continuing until 1989. Each local area plan contained distinct plot-ratios, and in the City of London these were used to guide new development until the publication of their Unitary Development Plan in 1994, at which point plot-ratios were removed in favour of the predominately discretionary system of planning controls seen across the City of London today (City of London, 2010).
At present London lacks a statutory height ceiling and local planning officials, “enjoy a considerable degree of discretion over the formulation of plans and the granting of individual planning permissions” (Pennington 2000, p.29). Though additionally, all buildings over 30m high must also receive central permission from the Mayor’s Office13 and buildings over 90m in height within the zone east of millennium bridge must be consulted with the London City Airport (City of London, 2010). Since the Greater London Authority Act 2007 the Mayor of London has also had executive power to overrule local councils and determine planning decisions unilaterally on any project which the mayor deems to be of strategic importance to London (Secretary of State for Communities and Local Government, 2008). A final layer of control rests with the Secretary of State for the Environment, who retains the right to overturn the decisions of local planning authorities through the national appeals system (Pennington, 2000).
13These restrictions do not apply to the City of London and areas adjacent to the Thames. In the City of
26
Historic designation
London has two regulatory designations for the protected status of buildings which apply to our sample; buildings located within a conservation area and listed buildings. Both buildings located within a conservation area and listed buildings cannot be altered externally without special planning consent that is rarely granted. Furthermore listed status buildings also cannot be altered internally without such consent. For failing to repair and maintain a listed building properly, owners may face criminal prosecution and the local council can compulsorily expropriate the building and recover repair costs from the owner. If a new building were to be built in a conservation area, it would automatically be given conservation status on account of the fact that it is located in such an area. On the other hand, listed status is given after a building is built, and therefore this designation cannot influence allowable building specifications at the development stage.
Conservation areas were first introduced to the United Kingdom with the Civic Amenities Act of 1967. This act made it the local planning authorities’ duty to identify and preserve or enhance areas of special architectural and historic interest. Before this legislation, historic protection was based solely on individual buildings rather than areas as a whole. The provisions of the 1967 Act were incorporated into the Town and Country Planning Act 1971, which has now been superseded by the Town and Country Planning Act 1990 and the Planning (Listed Buildings and Conservation Areas) Act 1990. The consequence of these regulations is that buildings located in conservation areas are subject to additional restrictions and more extensive planning controls. The City of London, for instance, an area where building tall is possible, expressly forbids the development of tall buildings in conservation areas14 (City of London, 2002). In central London roughly half of the total land area has been designated as a conservation area15.
14 The most notable modern exception to this rule was the 16-storey New Court Building at 4-7 St Swithin’s
Lane completed in 2010, and designed by Pritzger-Prize and RIBA Royal Gold Medal-winning architect Rem Koolhas. Although located in the Bank conservation area and deemed detrimental to the area’s architectural character, the City of London felt that the New Court building was an “exceptional piece of architecture” and that allowing Rothschild’s Bank to consolidate its staff into this location was key to maintaining the City’s position as a leading financial centre (City of London 2010, p. 35).
27
Although a limited number of historic structures were given protected status starting with the Ancient Monuments Protection Act of 1882, it wasn’t until after the Second World War that buildings were protected under listing due to architectural merit alone. The reason for this change was to distinguish between which buildings would and would not be allowed to be rebuilt as a result of damage caused by German air-raid bombings. The current listing practice began with the Town and Country Planning Act 1947. Generally, buildings under 30 years old are not listed unless deemed to be of outstanding quality and under threat, and buildings under 10 years old are not listed (Creigh-Tyte, 1998). At present there are 19,198 listed buildings and structures in Greater London.
The planning process
In the City of London the process of development control for new buildings generally begins with pre-application meetings and proceeds by undertaking assessments of the various envisioned impacts of the new structure deemed important. These assessments may include but are not limited to; viewing corridors, historical designation, effects on surrounding local character, congestion, light-blocking, wind-corridor effects, the effect on commercial and political interests in promotion of the financial ‘cluster’ located in the City, and of course architectural design16. This process involves reciprocal negotiation between the interests of the developers and the preferences of the City planners, with concessions generally meted out from both sides. As a rule however, buildings within conservation areas and strategic viewing corridors are not allowed to build taller than surrounding structures. Outside of these areas there may be considerable room for compromise. The assessment and negotiation process usually lasts a couple of years before a formal application is submitted, at which point it may still be rejected.
16As a comparison, for the recent large-scale office known as Columbus Tower (see Table 5), the Tower
28
Central to determining the social value of a proposed building is its design quality and height17. While design quality presents an unambiguous benefit to the surrounding area, the net benefits of building height are ambiguous, on the one hand bringing economic efficiency, higher employment densities, and possible prestige, but on the other potentially adversely altering the skyline, casting large shadows, increasing local congestion, and creating wind-tunnel effects18. As a result of these potentially negative consequences tall buildings face greater scrutiny at all planning stages, and are usually required to make substantial section 106 contributions to the local community and infrastructure19. However, local city planners in London do have an official mandate to promote and preserve the built environment, and architectural quality and iconic design are often cited as the main contributors to the success of planning applications20.
With these trade-offs in mind, it is plausible that a tall building which might otherwise be rejected by the planning commission could be approved if it additionally offered the surrounding areas views of world-class design. However assessment of the architectural merit of new development is by its very nature both subjective and speculative. For instance, in judging good design the City of Westminster calls its city planners to;
[H]ave regard to such matters as height, bulk, massing, relationship to existing building lines, and historic plot widths. The scale, proportions, vertical and horizontal emphases, solid-to-void ratios of the facades, the richness of detailing and modelling… and the light and shade this gives to the façade. (City of Westminster, 2004, p.17).
17See ‘Appendix A: Policy on the location and design of tall and large buildings’ for the Mayor’s official
policy regarding tall and large buildings.
18
The wind-tunnel effect is more formally known as a ‘rolling eddy’ and is caused by tall ‘slab’ buildings. Notorious examples include the Merrion Centre in Leeds opened in 1963 and the Croydon Centre in Croydon, Greater London. The problem was dealt with in both cases by securing a roof above the affected area to protect pedestrians. In London this phenomenon can also be observed at Shell Tower on the Southbank, at the Elephant & Castle, and by the Stag Brewery development in Victoria (Marriott 1989, pp. 244-5).
19
Usually amounting to around 2% of total building construction costs.
20 The importance of good design in planning permission is explicitly recognised in Planning Policy
29
Clearly substantial architectural training and experience would be required in order to evaluate proposed developments along these aesthetic criteria with any competence. On the main, planners do not possess such training and/or cannot quantify all the relevant trade-offs inherent in a given development decision. Therefore, to a considerable degree planners must rely instead upon their own value judgments (Cheshire and Sheppard, 2004). Due to the inherent uncertainty, difficulty, and subjectivity involved with assessing the aesthetic impacts of a building, particularly in the case of new developments, architectural fame may provide one of the few ‘concrete’ signals of design quality available to planners. As such it is plausible that planners pay particular attention to the reputation of architects, and afford preferential treatment in the planning process to buildings designed by prominent architects regardless of actual design.
Political incentives
While it is clear that, as profit maximisers, developers will wish to keep building taller so long as each additional floor contributes more to final sale prices than it subtracts in costs, it is not necessarily obvious what incentives the planners and politicians on the other hand face for permitting exceptionally tall buildings. As mentioned in the previous section, there are direct benefits and positive externalities arising from the economic efficiencies and higher employment densities that tall buildings make possible. Although it might be seductive to imagine that politicians would strive to tap all potential founts of additional public welfare, as public choice theory instructs us, this need not be the case (Olson, 1965). For example, the report of a Committee of Inquiry into the Greater London Development Plan in 1973 commented that it did not accept the statement that, “the improvement of London depends on the Londoner’s well-being” (Foster and Whitehead, 1973)21. Therefore, it cannot be naively assumed that the mere existence of potential social benefits is sufficient for political action. Rather the direction of policy is necessarily dictated by political incentives, which may or may not be aligned with economic ones.
30
One potential source of these political incentives is increased government revenues. At the municipal level, local authorities and the mayor’s office have limited scope for increasing revenue collection and lack fiscal independence due to heavy reliance on the national government for funding (Sweeting, 2003; Travers, 2004, Gordon, 2006). However, Section 106 of the Town and Country Planning Act 1990 allows local governments to extract substantial concessions from developers in exchange for granting planning permission22. Although used for all manner of social initiatives, these appeasements have been most notably used for the financing of large-scale infrastructure improvements. For instance, the mayor recently invoked his veto privilege to permit the construction of Columbus Tower in view of the contribution this project was slated to make to the London Crossrail project23. Uniquely, the City of London also has special permission from the central government to retain a small percentage of the revenues it generates from commercial property taxes. Therefore, the City of London in particular has a special interest in allowing developments which will increase the commercial rents charged under its purview.
A further political impetus for building tall in London may rest in the maintenance of a vibrant business community. It is certainly the case that many top financial firms prefer among other things; the consolidation of office functions in a single building, large floorplates, and fiber optic cabling. Buildings which cannot be so retrofitted are for all practical purposes indefinitely obsolete. Therefore the acceptance of new buildings and in particular tall buildings is a way for politicians to promote the continued vibrancy of their business community, and perhaps secure campaign contributions for re-election. Modern physical characteristics aside, tall buildings built by famous architects may also add an aura of prestige to cities which may attract businesses to London and business to London businesses. The London Docklands Development Corporation24 and the City of London in particular see a large part of their remit as developing and maintaining the financial clusters within their borders, and recognise that investments in state-of-the-art office buildings are
22
Naturally, the very existence of ‘planning gain’ to begin with is a red flag that there are economic rents to be had from flexing these regulations.
23 See Table 5.
31
crucial for London’s international business reputation. For instance both Rothschild’s Bank and the insurer Swiss RE considered vacating the City of London if their controversial New Court25 and 30 St Mary Axe26 buildings, respectively, were not granted planning permission in a timely fashion (Sudjic, 2001; City of London, 2010).
The goal of promoting financial clusters could also explain why tall modern buildings in London are almost exclusively designed as office space. Although there is nothing which overtly prohibits developers from enlisting famous architects to flex height regulations for a tall apartment building, acceptable locations to build high outside of conservation areas and protected sightlines in central London are relatively scarce. And since the economic spill-over benefits and added commercial caché of an office as opposed to a residential building are likely greater, business-conscious local authorities such as the City of London and the Docklands may discriminate in favour of tall building applications for offices.
Pecuniary interests aside, there is also a cogent argument to be made that iconic architecture becomes a tourist attraction in own right, providing direct benefits to the local hospitality industry. By way of example, there is no doubt that Frank Gehry’s Guggenheim museum in Bilbao or the Sydney Opera House by Jorn Utzon have increased the appeal of these cities to tourists, to say nothing of the aesthetic value these structures may confer on their citizens (Plaza, 2000; Evans, 2003)27. Making grand architectural statements per se may also be a direct goal of politicians regardless of any attendant commercial effects. History is filled with examples of political leaders who are either directly or indirectly responsible for the erection of monumental architecture (often for personal glory), and London may be no exception. In addition to the structure itself, politicians may also appreciate the positive association they gain by dint of having collaborated with famous architects. Of course, championing new architectural landmarks in this way also carries significant political and reputational risk. Particularly for tall buildings, which, if critically
25
At 20 St Swithin’s Lane.
26 See Table 2.
27 The benefits of tourist attractions however suffer from the fallacy of composition, not all cities can increase
32
received, are on view for the entire voting population for likely the remainder of their political career28.
Perhaps the most cynical view is that politicians and planners are motivated to expedite the applications of famous architect buildings (tall and squat alike) merely in order to expand their regulatory empire. Buildings protected from refurbishment and demolition require additional staff to monitor status and approve changes. Thus, by increasing the number of buildings which are under their purview, politicians can both preserve favoured jobs and expand the number of subordinates in their employ. However, in London this causal chain would not be quite so direct, as any building built by a famous architect would, like other protected structures, take 30 or more years to attain listed status. If however additional staff are required to assess hopeful tall building applications or to monitor various aspects of these buildings prior to listing, then the empire expansion argument could still hold.
On this point of regulatory expansion, Glaeser (2011) suggests that due to the costs involved with protecting buildings and the concomitant productivity losses which arise due to the prohibition of all future redevelopment, the number of buildings granted protected status in any given city should be capped. Therefore, according to Glaeser’s proposal, in order to put an additional building on the protected roster, a less significant structure would have to be likewise removed. Without such limits the implicit goal of historic conservation groups is evidently to create a city where all physical structures therein remain utterly sacrosanct and new development is impossible. Such a situation would of course be catastrophic for any such economy, and with more than half of all buildings in central London granted either listed or conservation status, we are currently not so far removed from this hypothetical world.
28 It is perhaps ironic however how nearly every structure in the world which is critically condemned upon
33
Interest groups
Although developers can be expected to oppose size restrictions being enforced upon their own designs, it could also be argued that, on the whole, they may prefer the present semi-binding height restrictions to a world of laissez-faire. Entrenched developers with specialized (and costly) local and procedural knowledge will outcompete new entrants that lack resources to surmount these obstacles. These entry barriers serve to reduce competition and likely raise the return to development activity in London in general. Developers may therefore support political candidates who are favourably inclined to the current regulatory barriers.
Property investors as well have no less of a vested interest in the current regulatory regime. Naturally, any investor who currently holds property in London would be subject to a large capital loss should development regulations be relaxed in any meaningful way (Cheshire, 2005). It is also possible that new investors may prefer markets with potential for both real rental and capital growth, and since such growth is more likely to occur in heavily supply restricted markets, investors may support development regulations as well. A counterpoint however is that, at least in housing markets, supply restrictions may add to the volatility of returns, which deters investment (Glaeser, Gyourko and Saiz, 2008). Since stable supply in face of demand shocks means unstable (but possibly growing) prices, it is not immediately clear whether new investors to the London market prefer regulatory barriers or not. Incumbent investors on the other hand would almost universally prefer the maintenance and indeed the expansion of development restrictions.
Literature Review
34
for ‘good’ architecture, but only if the building is also ‘new’. Hough and Kratz attribute this discrepancy to the fact that the dummy variable they used to indicate ‘good’ architecture prior to 1930 was simply an indicator for those buildings which had also been marked for conservation, and were therefore subject to abridged property rights on top of the architectural benefits they were attempting to isolate.
Later work by Asabere and Huffman (1991) confirms the apparent tension evident in Hough and Kratz between the positive influence of good architecture on the one hand, and the ostensibly negative influence of historic designation on property rights on the other, by failing to find a net premium on landmarked commercial and industrial properties. Vandell and Lane (1989) on the other hand produce a measure of architectural quality independent of historic status and find similar rental premiums for good architecture as Hough and Kratz do for good and new architecture. A more recent study by Fuerst et al (2011) examined the effect of ‘signature’ architects; defined as winners of the Pritzger Prize or American Institute of Architects Gold Medal, on US offices and concluded that these buildings yielded a rental premium of 5-7% and a sale price gain of 17%. However their sale price gain disappeared when they reran the model with a sample of counterfactuals statistically chosen to be similar to their famous architect buildings, and their sample choice of signature architects was heavily weighted towards a single architectural firm whose inclusion was questionable. The rent results were also sensitive to this new comparison and to the definition of their treatment group (i.e. signature architect).
In addition to internal price effects, good architecture may also confer important externalities. Although the literature abounds with studies on the positive spill-over effects of good architecture on residential property29, the author was unable to locate any such studies examining office buildings explicitly. It may therefore be the case that any such positive effects are small or simply too difficult to disentangle. Furthermore, for
35
commercial property in particular, the putative benefits of good architecture are unlikely to be universally viewed as such30.
Although the literature lacks studies on the positive externalities of good office architecture, Thibodeau (1990) documents the negative externality associated with high-rise office construction near residential properties. He estimates that these non-conforming structures exact as much as a 15% discount on neighbouring homes, whereas houses more than 1,000m away enjoyed a 5% price premium. Since the number of houses in a residential neighbourhood roughly increases as the square of distance31, the net effect of the externalities observed by Thibodeau increased total housing values in the vicinity by 1%. In a similar vein, tall modern office buildings in London may represent a non-conforming use to the surrounding low-rise period structures in the same way that Thibodeau found for high-office buildings on residential property.
As opposed to the variable effect of good architecture on sale prices outlined above, building height exhibits an unambiguously positive influence on building price other things equal. Of course, building higher allows developers to build more total floorspace on a given land area. But even controlling for the amount of floorspace, higher floors also tend to be more valuable than those below32. The reasons given for the price advantages of building higher are often cited as greater prestige, productivity increases associated with greater intra-building face-to-face contact, and better views. To gain perspective on the magnitudes involved, one of the most recent studies by Koster, Ommeren, and Rietveld (2011) used the presence and height of pre-WWII buildings as an instrument to show that office rents increase by 4% for every 10m height increase in the building, and that prestige effects account for 17.5% of the total rents paid for buildings six-times the average height in Holland.
30 For instance the London Shard built by famed architect Renzo Piano has been criticized by English
Heritage and UNESCO.
31πr2, assuming uniform average residential plot areas.
32 For instance see Colwell et al. (1998) for the effect of height on transaction prices, and for the effect on
36
Looking at the profit-maximising height of new office developments, Helsley and Strange (2008) argue that agglomeration economies and economies of scale are insufficient to explain the extreme stature of many of the world’s tallest skyscrapers. They posit that there is a valuable reputation effect for being the tallest building, and that developers compete to attain this recognition. The consequence of their game theoretic model is a stock of office buildings that are taller than profit-maximisation would imply. Although Helsley and Strange only cite historical anecdotes to underpin their theoretical model, Barr (2012) empirically tests the incidence of office overbuilding historically in New York, and indeed finds that developers have engaged in profit-dissipating height competition. In contrast to offices however, other research by Chau et al (2007) did not find a significant disparity between the theoretical profit maximising height of residential high-rises in Hong Kong and their actual heights. It may therefore be the case that benefits outside the normal calculus of project-development profits accrue more readily to firms than individuals from being associated with an exceptionally tall building.
With regard to political incentives and disincentives to build taller in London, Cheshire and Hilber (2008) discuss some pertinent differences in the political forces at work in the administrative boroughs which divide London. In their paper on office supply restrictions in Britain they provide evidence that the peculiar tax structure of the City of London33 and the fact that the it is run by the local business community and its interests, has incentivized the City to relax office space supply restrictions and encourage new development relative to other boroughs. Cheshire and Hilber also suggested that ‘trophy’ architects might help developers to bend these lax rules even further. Similarly, they argue that since political control of the Docklands is also held by the London Docklands Development Corporation and not the voting population, the Docklands has quelled ‘NIMBY34’ interests in favour of high-rise commercial space and economic growth. Conversely other areas of London, in particular the West End, have much stronger planning protection and height restrictions that
33
Wherein the City of London is uniquely allowed to levy an additional business rates tax (tax on commercial property rents) and retain the revenues so generated, rather than have all revenues pooled at the central government level and reallocated to local authorities by formula grant.
37
are practically impossible to breach, and as a result a less malleable office stock and higher building price to construction-cost ratios. Moreover, at a glance it is apparent that the West End of London has nearly no tall buildings35, while both the City of London and Canary Wharf (Docklands) exhibit the only clusters of tall buildings in London.
This paper continues with an overview of the data collection methodology and how variables were constructed from this data. It then applies this data to test the hypotheses that; (i) famous architects are allowed to build bigger outside conservation areas, (ii) if this is indeed because they can build taller, and (iii) whether building bigger allows famous architects to erect buildings which sell for more on a given quantity of land. Finally the paper concludes with a discussion of these results.
Data
Building Sample
Data on office building characteristics and sale prices were acquired from Estates Gazette (EG) and Real Capital Analytics (RCA). Combined, the EG and RCA data sum to 2,932 unique sale instances in central and outer London between 1998 and 2011. This dataset was then culled with the following methodology.
1. Removed non-central36 London buildings, as defined by EG and RCA. There were less than 100 such observations and this was done in order to make data collection more manageable and preserve the study focus.
2. Removed all portfolio sales, as there is no way to correctly allocate portions of the composite sale price to each sold building.
3. Removed all buildings whose primary use was not office space.
4. Removed all sales of buildings which had been rebuilt, refurbished, or otherwise altered since last transacted. This was done to ensure that each building when visited was essentially identical to the building which had been sold.
35 Notable exceptions include the 37-storey BT Tower at 60 Cleveland Street commissioned by the
Government General Post Office to support microwave aerial antennae for telecommunications and the 33-storey Centre Point at 103 New Oxford Street which was exceptionally granted planning permission in exchange for land concessions of the surrounding area to the LCC for road improvements (Marriott, 1989, pp.114).
36 The EG and RCA ‘Central London’ boundaries actually correspond more closely to the standard definition
38
5. Removed sales which lacked any required data needed for the hedonic estimation. 6. Removed sales which occurred less than 12 months after the previous sale37.
This data was then supplemented with information collected from on-site-visits to the remaining 575 properties in the sample between July and September 2011, and internet research between October 2011 and Jan 2012. Required hedonic data was successfully collected on all characteristics for 387 properties which covered a total of 513 sales (126 repeat-sales).
Famous Architect
Central to the question of this paper is the definition of what constitutes a famous architect. Although architectural excellence is necessarily a subjective judgment, there is considerable consensus within the architectural community that awards from the Royal Institute of British Architects (RIBA), the American Institute of Architects (AIA), and the Pritzker Prize are the most prestigious. Among the awards conferred by these bodies, the RIBA Royal Gold Medal, AIA Gold Medal, and the Pritzger Prize are the most esteemed as they are given annually for a lifetime body of work. Buildings which have been built by architects which have won an award from any of these three bodies are considered to be famous architects for the purposes of this study38. Given the exclusivity of these awards the number of potential candidates and buildings are limited. The architects who fall into this list and whose buildings were successfully surveyed consist of Cesar Pelli, Norman Foster, Terry Farrell, Aston Webb, Edward Lutyens, and Joseph Emberton consisting of ten buildings39,40. Four of these buildings are located outside of a conservation area, and each
37 These so called ‘flips’ may have a distorting effect on price indices (Clapp and Giacotto, 1999), and the
hedonic model F-statistics tested here improved markedly with their exclusion.
38 Cesar Pelli, Norman Foster, Terry Farrell, and Edward Lutyens built each of their buildings in the sample
after winning one of these architectural awards. Sir Aston Webb’s 23 Austin Friars was constructed before the imposition of height controls, and Edward Lutyens Banking Hall and Lutyens House and Joseph Emberton’s Summit House were constructed during the period of statutory height controls.
39The architect Richard Seifert’s notoriously tall Centre Point building at 103 New Oxford Street is included
39
of these was either designed by Cesar Pelli, Norman Foster or Terry Farrell (see Table 2 below). We define ‘modern’ buildings as those buildings built after the retraction of statutory height restrictions in 1956, and ‘pre-modern’ as buildings built before. As we can see from Table 2 below there is in fact a 54 year gap between the completion dates of the closest modern and pre-modern famous architect buildings in our sample. Sales of the 6 modern famous architect buildings were observed a total of 10 times, and sales of the 4 pre-modern famous architect buildings were observed 6 times41.
Table 1: Famous architect and awards
Architect Awards Won Year Awarded
Cesar Pelli AIA Gold Medal 1995 Norman Foster Pritzker Prize, RIBA Royal Gold Medal, AIA Gold Medal 1983-1999 Terry Farrell RIBA Award, AIA Award 1978-2010 Edward Lutyens RIBA Royal Gold Medal 1921 Aston Webb RIBA Royal Gold Medal 1905 Joseph Emberton RIBA Award 1930
The validity of using awards from these three bodies as indicators of architectural fame is potentially reinforced by noting that all of the four buildings in our sample built by pre-modern famous architects have been listed by the Historic Buildings and Monuments Commission for England for possessing special architectural or historical interest; assuming of course that these buildings are not listed ipso facto of being built by a prominent architect. All modern buildings in the sample, on the other hand, are not yet eligible for listing as buildings as they are under 30 years of age (see Historic designation above). All pre-modern buildings built by famous architects are also located in conservation areas. Although it can be noted from Table 2 that the two tallest buildings in the sample were built by architects that this paper regards as famous, the criterion used by this paper for being deemed a famous architect was chosen blind of the data.
A caveat to bear in mind with our famous architect metric is that it does not directly test for good architecture, but rather asks the simpler and more objective question of whether a
40 The tallest building in Europe, the London Bridge ‘Shard’ designed by Pritzker-Prize, RIBA Royal Gold
Medal, and AIA Gold Medal-winning architect Renzo Piano is not part of the sample, see Table 4.
40
building’s architect has been recognized for excellence by the most prestigious architectural-bodies. This simplification comes at a cost however. Although plausible, it may not be a valid inference to say that the particular buildings built by famous architects in this sample are also examples of good architecture. To be sure that this is the case would require independent evaluation of each building’s actual architectural merits, ideally by a panel of experts. However, for the purpose of assessing the impact of mere architectural fame on the willingness of planners and politicians to allow extra building height at the application stage, this metric is sufficient.
The following four Tables describe (i) the Famous architect office buildings in the sample. (ii) Tallest non-famous-architect office buildings in the sample, (iii) Tallest London office buildings not in the sample, and (iv) Tallest London office buildings not yet completed but with planning permission. Unsurprisingly, a notable feature of existing modern and permitted tall office buildings in London is the preponderance of buildings designed by famous architects. Furthermore, only one of these ‘tall’ office buildings in our sample (14-storey 12 Throgmorton Avenue) was built while in an active conservation area42.
42
41 Table 2: Famous architect buildings in sample
Building Name Address Architect Floors† Year Built
Borough Conservation Area
Listed Sales
- 25 Canada Square Cesar Pelli 43 2002 Tower Hamlets NO NO 2
‘The Gherkin’ 30 St Mary Axe Norman Foster 40 2003 City of London NO NO 1
Bishops Square 10 Bishop Square Norman Foster 13 2005 Tower Hamlets NO NO 2
- 10 Gresham Street Norman Foster 8 2004 City of London YES NO 1
Alban Gate 125 London Wall‡ Terry Farrell 19 1992 City of London NO NO 3
Sugar Quay ͨ Lower Thames
Street
Terry Farrell 6 1979 City of London YES NO 1
Lutyens House 1-6 Finsbury Circus
Edward Lutyens 9 1923 City of London YES YES 1
Banking Hall 27-35 Poultry Edward Lutyens 6 1925 City of London YES YES 3
- 23 Austin Friars Aston Webb 6 1888 City of London YES YES 1
Summit House 12 Red Lion Square
Joseph Emberton 5 1925 Camden YES YES 1
†Floors refers to all above-ground levels including the ground floor but not including basements. ‡Alban Gate replaced the 18 floor Lee House designed in 1962 by Burnet, Tait and Partners.
ͨ
42 Table 3: Tallest non-famous-architect office buildings in sample
Building Name Address Architect Floors Year Built
Borough Conservation Area
Listed Sales
Centre Point 103 New Oxford Street
Richard Seifert 33† 1965 Camden YES* YES 1
Empress State Building
Empress Approach Stone, Toms & Partners
30‡ 1961 Hammersmith NO NO 1
Commercial Union Tower
1 Undershaft Gollins, Melvin, Ward
26 1969 City of London NO NO 1
New Scotland Yard
10 Broadway Chapman, Taylor and Partners
21 1962 Westminster NO NO 1
City Tower 40 Basinghall Street
Burnet, Tait and Partners
21 1957 City of London NO NO 0ª
Angel Court 1 Angel Court Fitzroy Robinson and Partners
19 1980 City of London YES* NO 1
Plantation Place 30 Fenchurch Street
Arup Group 15 2004 City of London NO NO 1
Landmark House Hammersmith Bridge Road Thomas Saunders Partnership
15 1973 Hammersmith NO NO 2
Drapers Gardens
12 Throgmorton Avenue ͨ
Foggo Associates 14 2009 City of London YES* NO 1
- 280 Bishopsgate Foggo Associates 13 2001 Tower Hamlets NO NO 2
*Centre Point, Angel Court, and the original Drapers Gardens building at 12 Throgmorton Avenue were granted planning permission before their surrounding areas were given conservation area designation.
†Centre point was permitted to be taller than would normally be allowed by the London County Council because the developer Harry Hyams consented to fund the creation of a needed road junction under and around the building.
‡This figure includes three floors added to the top of the building during a renovation in 2003 at a cost of £80m.
ͨ
12 Throgmorton Avenue replaced the 29 floor building known as Drapers Gardens originally designed by Richard Seifert in 1962.
43 Table 4: Tallest inner London office buildings not in sample
Building Name Address Architect Floors Year Built
Borough Conservation Area
Listed
‘The Shard’ 32 London Bridge Street
Renzo Piano* 95 2012 Southwark NO NO
One Canada Square 1 Canada Square Cesar Pelli* 50† 1991 Tower Hamlets NO NO
Tower 42 25 Old Broad Street Richard Seifert 47 1980 City of London NO NO
Heron Tower 110 Bishopsgate Kohn Pedersen Fox‡* 46 2011 City of London NO NO
HSBC Tower 8 Canada Square Norman Foster* 45 2002 Tower Hamlets NO NO
Broadgate Tower 201 Bishopsgate Skidmore, Owings, and Merrill
33 2009 City of London NO NO
- 25 Bank Street Cesar Pelli* 33 2003 Tower Hamlets NO NO
- 40 Bank Street Cesar Pelli* 33 2003 Tower Hamlets NO NO
One Churchill Place 1 Churchill Place HOK International 32 2004 Tower Hamlets NO NO
- 10 Upper Bank Street
Kohn Pedersen Fox* 32 2003 Tower Hamlets NO NO
*Denotes famous architect according to this paper’s definition.
†To comply with air-traffic safety regulations for London City Airport the architect removed 5 floors from the original design of One Canada Square. ‡Kohn Pedersen Fox was Winner of the AIA Architectural firm award in 1990, and William Pedersen has received 5 AIA Awards between 1984-2003.
ͨ