2016 International Conference on Electronic Information Technology and Intellectualization (ICEITI 2016) ISBN: 978-1-60595-364-9
In-tube Oxide Scale Plugging Warning of
Supercritical Boiler Based on Data Stream
Outlier Mining Technology
Zhigang Chen, Danjue Yuan, Hua Li, Zhending Zhang,
Weiwen Ye, Dingping Liu* and Kaihua Xu
ABSTRACT
As supercritical boiler(SCB) works chronically under high temperature and high pressure, oxide scales easily generate and peel off inside heating surface tubes, which ends up in plugging. Aiming at massive amounts of real-time data produced in the operation of SCB, a novel algorithm, based on data stream outlier mining technology, was proposed for detecting wall temperature stream outliers in this paper to implement oxide scale plugging warning timely. By modeling and calculating, data stream labels were used to mark the abnormal frequent items. The warning would be triggered if they were marked three times continuously. The comparison of the experimental results and the real data streams proves that the algorithm has higher reliability and better accuracy.
INTRODUCTION
During the operation of SCB, metal surfaces are easily oxidized by flowing steam under high temperature and high pressure. That is why oxide scale presents inside heating surface tubes. However, when reaching a certain thickness, it will peel off and even block these tubes, bringing the following impacts:
________________________
Zhigang Chen, Hua Li, Zhending Zhang, Weiwen Ye, Kaihua Xu. Guangzhou Special Pressure Equipment Inspection and Research Institute, Guangzhou, Guangdong 510100, China
The peeling oxide scales lead to the internal plugging of heating surface tubes. The accumulation of oxide scales reduces the volume flow rate of steam, in addition, since the cross-sectional flow area inside a tube decreases, the presence of oxide scales also significantly degrades the total heat transfer, causing local overheating phenomenon and tube explosion accidents.
The peeling oxide scales erode the blades, which are rapidly rotating in the circulation area of turbine, and further influence the turbine stage efficiency once entering it[1].
The response to in-tube oxide scale plugging is a fundamental task for the safety analysis of SCB after severe accidents. By detecting outliers in data streams and analyzing the correspondence between data and modeling, hidden but valuable information can be extracted. Thus, outlier mining technology can be applied to controlling and warning directly.
This paper presents a new algorithm based on outlier mining technology, which can be used for implementing oxide scale plugging warning online and offers new tools for the safety operation of thermal generator set.
RELATIONSHIP BETWEEN OXIDE SCALE PLUGGING AND WALL TEMPERATURE
If temperature or pressure fluctuates sharply in the operation of SCB, oxide scale will crack and peel off owing to the fact that its thermal expansion differs from that of matrix material. The continually peeling oxide scales will then accumulate until plugging occurs. At the start-up initial stage of SCB, the temperature and the velocity of flue gas are relative low, so the heat transfer inside a heating surface tube is mainly vapor convection heat transfer. The flow area of vapor will reduce significantly once plugging occurs in a tube, consequently, its wall temperature will be abnormally lower than those unplugged ones. However, with the increase of combustion intensity, the temperature and the velocity of flue gas rise accordingly and a large amount of radiant heat released by flue gas will be absorbed by heating surfaces. In such case, the wall temperature of plugged tubes will rise so sharply, much higher than that of unplugged ones at the same time. Tube wall temperatures rise continuously, forming a vicious cycle of “over temperature-oxide scale growing rapidly and plugging-over temperature”. Once the tube wall temperature exceeds its allowable temperature, tube explosion accidents will occur.
IN-TUBE OXIDE SCALE PLUGGING WARNING MODELING
Modeling Selection
As an important branch of data stream mining technology, frequent pattern mining, which refers to a course of finding data items whose frequency exceeds the
preset threshold, can be described as: for a ordered data streamDS
T T1, ,...., ,...2 TN
,N denotes the quantity of T in current data stream, Tiis made up of item sets in an
attribute set I
i i1, ,....,2 im
, namely, TiI . The support set of a pattern( )
X X I in DS is denoted bysup(X) , which consists of all the transactions
containing X. X is called a frequent pattern when it meets the condition sup( ) /X N s
, where s(0,1)is the user defined minimum support [2].
On the basis of frequent pattern mining, in-tube oxide scale plugging warning was modeled for SCB in this work. By analyzing the abnormal frequent items among wall temperature streams, we may discover not only in which tube but when anomaly occurs.
Related Definition
A series of in-time measured wall temperatures can be deemed a data stream, the set of which is designated asX{X(1),X(2),X( )n}, where the wall temperature set of tube jis ( )( 1( ), 2( ), , ( ))
j j j j T
t
X x x x . Additional definitions are also concretely given as
below:
Definition 1: A dynamic test condition for detecting whether abnormal data exist in data streams is proposed andC i( )denotes the condition at timei.
Definition 2: Data stream labels are used to mark the abnormal frequent items in data streams. Given condition C i( )at timei, markxi( )j as 1 if it meetsC i( ). Or, it is marked as 0 instead.
Definition 3: Data stream distance is proposed to describe the difference between two adjacent data streams. Given two data streams X( )k and X( )j , their
distance, in other words, their value difference at timei is denoted byxi( , )k j .
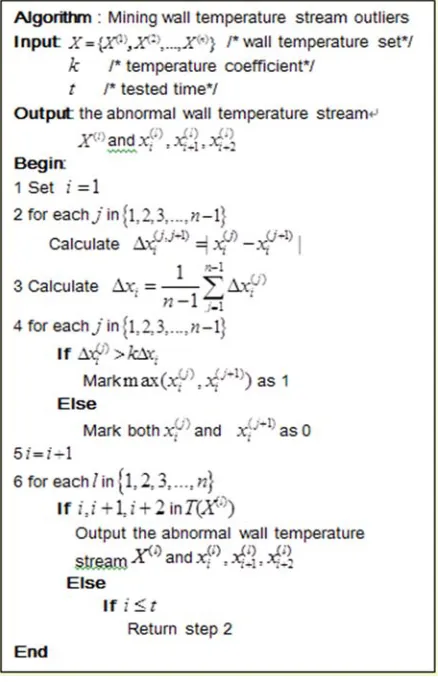
Algorithm Description
A new algorithm for in-tube plugging warning is shown in Figure 1.
In step 2, data stream distance at timeiis defined asxi( , 1)j j |xi( )j xi( 1)j |. To clarify, the distance between two adjacent data streams instead of two arbitrary ones is calculated, reducing the calculation work remarkably.
[image:4.612.188.407.238.579.2]In step 4, a dynamic test condition C i( ):xi( )j k xiis presented, where K is temperature coefficient, around 2.0 in general. The warning will be insensitive with
Figure 1. Warning algorithm.
a larger K while it will be oversensitive with a smaller K.
SIMULATION AND DISCUSSIONS
Case Description
For a 600MW SCB, more than fifty thousand data streams were obtained. By analyzing these extensive data streams, five wall temperature streams of platen super heater (one wall temperature stream of which is abnormal), ten wall temperature streams of low temperature super heater(one wall temperature stream of which is abnormal) and ten wall temperature streams of high temperature heater (two wall temperature streams of which are abnormal) were selected for modeling calculation. Several cases with various temperature coefficients were experimentally investigated using MATLAB codes.
Experimental Results
EFFECTS OF VARIOUS TEMPERATURE COEFFICIENTS ON WARNING
The temperature coefficients were respectively set to 1.5, 1.8, 2.0 and 2.2. The results are shown in TABLE I, TABLE II and TABLE III.
In the first test, the actual abnormal wall temperature stream of platen super heater is No.2. When K equals to 1.5, 1.8, 2.0, 2.2 respectively, the tested abnormal wall temperature stream remains No.2, matching the reality well.
In the second test, if K is 1.5 or 1.8, the warning is oversensitive compared to the actual abnormal wall temperature stream. However, if K is 2.2, none of the tested streams are abnormal, causing an insensitive warning.
In the last test, the actual abnormal wall temperature streams of high temperature heater are No.2 and No.5. The results under various values of K match the reality well.
Temperature coefficient K significantly affects the sensitivity of the warning model. The results suggest that: when K equals to 2.0, the accuracy of the proposed model is better achieved.
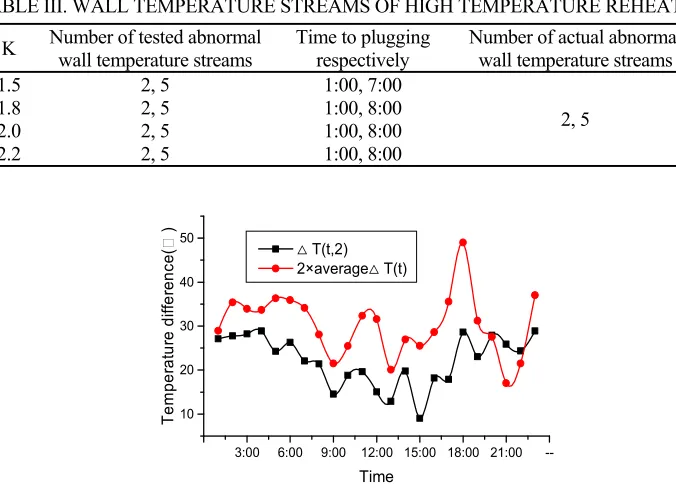
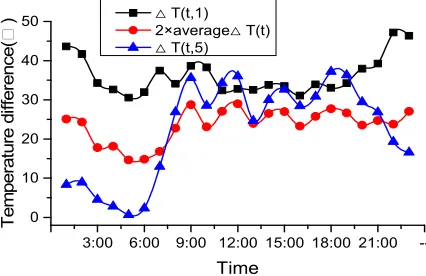
COMPARISON OF WALL TEMPERATURE DIFFERENCES
The temperature differences between any two adjacent tubes at each moment were clearly detected, absolutely in time. Figure 2, Figure 3 and Figure 4 show the temperature difference curves of each plugged tube in platen super heater, low temperature super heater and high temperature heater during a day. Setting K as 2.0, the curves of twice the average temperature difference is also shown.
In Figure 2, deltaT(t,1) exceeds twice the average temperature differences at three successive hours 20:00, 21:00 and 22:00. So continuous plugging happened in the No.2 tube since 20:00.
twice the average temperature differences at 16:00 and 20:00. So continuous plugging happened in the No.2 tube from 16:00 to 22:00.
[image:6.612.126.469.164.236.2]In Figure 4, deltaT(t,1) exceeds twice the average temperature differences during
TABLE I. WALL TEMPERATURE STREAMS OF PLATEN SUPER HEATER.
K Number of tested abnormal wall temperature streams plugging Time to Number of actual abnormal wall temperature streams
1.5 2 1:00
2
1.8 2 20:00
2.0 2 20:00
[image:6.612.93.502.275.346.2]2.2 2 20:00
TABLE II. WALL TEMPERATURE STREAMS OF LOW TEMPERATURE SUPER HEATER.
K Number of tested abnormal wall temperature streams Time to plugging respectively Number of actual abnormal wall temperature streams 1.5 2, 5, 6, 7, 9 9:00, 2:00, 1:00, 12:00, 7:00
2
1.8 2, 5 , 6 ,7 10:00, 2:00, 1:00, 13:00
2.0 2 16:00
[image:6.612.125.463.372.620.2]2.2 – –
TABLE III. WALL TEMPERATURE STREAMS OF HIGH TEMPERATURE REHEATER.
K Number of tested abnormal wall temperature streams Time to plugging respectively Number of actual abnormal wall temperature streams
1.5 2, 5 1:00, 7:00
2, 5
1.8 2, 5 1:00, 8:00
2.0 2, 5 1:00, 8:00
2.2 2, 5 1:00, 8:00
3:00 6:00 9:00 12:00 15:00 18:00 21:00 --10
20 30 40 50
Tem
per
at
ur
e
di
ffer
ence
(
)
Time △
T(t,2)
△
[image:6.612.199.402.447.614.2]2×average T(t)
3:00 6:00 9:00 12:00 15:00 18:00 21:00 ---5 0 5 10 15 20 25 30 35 Tempe rat ur e di ffer enc e( ) Time △ T(t,2) △ 2×average T(t) △ T(t,1)
Figure 3. Temperature differences of plugged tubes in low temperature super heater.
3:00 6:00 9:00 12:00 15:00 18:00 21:00 --0 10 20 30 40 50 Tem per at ur e di ffer enc e( ) Time △ T(t,1) △ 2×average T(t) △ T(t,5)
Figure 4. Temperature differences of plugged tubes in high temperature reheater.
Almost the whole day from 1:00 to 23:00 while deltaT(t,5)exceeds twice the average temperature differences from 8:00 to 21:00. In both of the two tubes, plugging happened continuously for a long time.
CONCLUSIONS
In-tube oxide scale plugging of SCB was modeled on the basis of data stream frequent pattern mining. Several cases with various temperature coefficients were investigated using MATLAB codes. The warning effects were then discussed in detail. The main conclusions are as follows:
[image:7.612.196.409.279.417.2]Temperature coefficient K significantly affects the sensitivity of the proposed model. The experimental results are consistent well with the real wall temperature streams when K is 2.0.
Rapid and accurate warning effects are achieved by marking the abnormal temperature streams three times continuously.
ACKNOWLEDGEMENTS
This work was financially supported by the AQSIQ National S&T Planed Project(2015QK169).
REFERENCES
1. Dingping Liu. 2012. “Research on Formation and Exfoliation Mechanism of Oxide Scale to High-temperature Heating Surface and Its Over-temperature or Explosion-proof in the (Ultra-) Supercritical Boiler”. South China University of Technology.
2. Yunhe Pan, Jinlong Wang, Congfu Xu. 2006. “Progress in Data Stream Frequent Pattern Mining”. Acta Automatica Sinica, 04: 594-602.
3. Jiawei Han, Hong Cheng, Dong Xin, Xifeng Yan. 2007. “Frequent Pattern Mining: Current Status and Future Directions”. Data Mining and Knowledge Discovery, 1.
4. Huan Zhou. 2010. “Outlier Mining Process Model and Its Application”. International Colloquium on Computing, Communication, Control and Management (CCCM2010), August 20, 2010.
5. Singh, Karanjit, Upadhyaya, Shuchita. 2012. “Outlier Detection: Applications and Techniques”. EN, 91.
6. Anrong Xue, Lin Yao, Shiguang Ju, Weihe Chen, Handa Ma. 2008. “Summary of Outlier Mining Methods”. Computer Science, 11: 13-18+27.
7. R. Viswanathan, J. Sarver, J.M. Tanzosh. 2006. “Boiler Materials for Ultra-supercritical Coal Power Plants-Steamside Oxidation. Journal of Materials Engineering and Performance”, 3. 8. Han Jiawei, Micheline K. 2006. “Data Mining: Concepts and Techniques (2nd edition)”. San
Francisco: Morgan Kaufmann Publishers.