2016 Joint International Conference on Artificial Intelligence and Computer Engineering (AICE 2016) and International Conference on Network and Communication Security (NCS 2016)
ISBN: 978-1-60595-362-5
Computing Eye Tracking Metric for a Radar Display
Using a Remote Eye Tracker
Hong-Jie WEE
1,a, Sun-Woh LYE
1,b,*, Jean-Philippe PINHEIRO
2,c1School of Mechanical and Aerospace Engineering, Nanyang Technological University,
50 Nanyang Ave, Singapore
2Thales Air Systems, 3, Av Charles Lindbergh - BP 20351, 94628 Rungis Cedex - France
a[email protected], b[email protected], c[email protected]
*Corresponding author
Keywords: Eye Tracking, Eye Tracking Device, Air Traffic Control, Air Traffic Controllers, Radar Display, Human Computer Interaction, Human Factors.
Abstract. Eye movement tracking is a commonly used method for researchers to study the cognitive process of individuals in the Human Computer Interface (HCI) domain. By tracking the eye movement of the test subjects, researchers are then able to investigate into the cognitive processing of the participants. This method is also used widely in the field of Air Traffic Control (ATC), many involving the use of wearable device and multiple displays. However, work on the eye movement activity on a single screen, the radar screen, with the use of a remote eye tracker is sparse. This paper presents an algorithm for computing some eye tracking metric for such a study and together with some results from an experiment. These metrics are shown to be effective and useful, allowing it to serve as a good basis for further work in this domain.
Introduction
Eye-movement tracking is an increasingly popular method being adopted by many researchers in their field of study to better understand the usability issues in the Human-Computer Interaction (HCI) environments. Eye-tracking is a technique whereby an individual’s eye movements are measured so that the researcher can identify both where the test subject is looking at any given time, as well as the sequence in which their eyes are shifting from one point to another [1]. By tracking the eye movements of the test subject, a better understanding of the visual and display-based information processing can be achieved. In this case, one can investigate into the level of information processing that the participant is subjected to.
It is interesting to note that such technology actually developed from over 100 years ago from reading research [2]. Over the years, eye tracking technology have improved from using electrodes mounted around the skin of the eye (Electro-Oculograhic Technique), wearing of large contacts lenses that covers the cornea and sclera [3] to modern remote eye tracker technology and wearable glasses technology which is deemed to be more comfortable and less invasive. Eye tracking research has been used for many applications. They are used to provide more insights to problem solving, visual search strategies and many more [4, 5]. As eye movements is able to provide further insights on the cognitive processes of individuals, it is seen as a rich research tool in HCI related topics, with human factors (HF), being one of them [6].
In the context of Air Traffic Control (ATC), eye tracking devices have been deployed for many uses. Many of such uses involve the use of a wearable eye tracking device and also multiple displays, to test the usability of some displays and also the situational awareness of ATC training [7, 8].
ATCo most of the time and also the lack of an accurate, non-intrusive eye tracker to trace the eye movement behaviour of the ATCo.
Objective
The objective of this paper is to create an algorithm for a remote eye tracker to trace the different eye movement behaviour of the ATCo while looking at the events happening at the radar display.
A study was done to determine the effectiveness and sensitivity of the eye metrics computed from the algorithm in detecting the changes of eye movement activity. The participants who took part in this study are novice ATCo with no experience in ATC.
Approach
Eye Tracking Metric
[image:2.612.88.522.293.500.2]The following eye tracking metrics are identified, showed with its definitions and meanings, as shown in Table 1.
Table 1. Eye tracking metric used.
Eye Tracking Metric Description
Fixation Eye movements which stabilise the retina over a stationary object of interest for more than 250[ms] [9] AOI Area on the display where all fixations are functionally equivalent [10] Fixation Count Count of the number of fixations A measure of underlying processing efforts [11]
Fixation Count per AOI
Fixation within the defined AOI
Frequency indicates the need to monitor that AOI, indicating importance [6]
Fixation Duration A longer fixation duration indicates the longer processing time is needed to extract information [12]
Gaze Duration per AOI
Sum of all successive fixations
Processing time used for perceiving the information, measure of difficulty in processing information by ATCo [13]
Used as a measure of anticipation for SA, if longer gaze falls on AOI before event occurs [7]
Experimental Setup
The equipment used to perform this study are the remote eye tracker, Tobii X2-30, a real time air traffic control simulator, NARSIM. A post processing tool, TopSky-HF, is used to record and post process the eye tracking data. The setup is seen in Figure 1 with the radar display, displayed on a 2K screen. The eye tracking metrics used for this experiment are fixation count per AOI and gaze duration per AOI.
[image:2.612.215.381.587.717.2]Experiment Design
The dependent variables (observations) of the experiment are total fixation count per AOI and total gaze duration per AOI. The experiments are divided into the ER and TMA scenarios, to study if such metrics are useful to detect any changes in the eye movement behaviours of the participants. Every run of the simulation lasted for one hour.
For the ER scenario, the independent variables are number of conflicts, number of FL and number of aircraft. This study used a 3 (number of conflicts: no crossing, no conflict, crossing, no conflicts, crossing, conflicts) x 3 (number of FL: 4, 6, 8) x 3 (number of aircraft: 40, 60, 80), single replicate design. For TMA scenario, the independent variables are the number of flight merging paths, number of holdings and number of aircraft. This study used a 3 (number of merging paths: 0, 1, 2) x 3 (number of holdings available: 0, 1, 2) x 3 (number of aircraft: 40, 50, 60), single replicate design.
Procedure
Before the experiment began, the participants were briefed on what they are supposed to do as the ATCo and the pseudo pilot, followed by instructions on how to use the equipment. The participant playing the role of the ATCo will be required to adjust his sitting posture correctly and also to calibrate his eyes to the center of the screen, to ensure that the eye tracking data collected is consistent. They will not be informed of the type of scenario so as to prevent any biasness in the results.
Method (Processing Eye Tracking Data)
The eye tracking data are collected from the Tobii X2-30 server and the radar screen loggings from the NARSIM logging simulator. The computation of the final eye tracking metric, total fixation count per AOI and total gaze duration per AOI for data analysis is shown in the different phases of calculation below.
Phase 1: Post Processing of Eye Tracking Logging
Values that are being recorded as loggings are the X and Y pixel value of the eye movement’s retina stabilization [Px, Py], the timestamp of the fixation in terms of unix time [ms] (13 digit time starting from 1/1/1970), line by line, in ascending
order of the time from the start to end of the simulation.
Table 2 shows the steps to determine the fixations and their respective fixation duration, for the one hour simulation duration. It is also necessary to convert the timestamp values from unix time to absolute simulation time in seconds in order to compare with the radar loggings.
Table 2. Steps to determine fixations and respective fixation durations. Steps Description
1 Calculate the time interval between each retina stabilisation by taking the difference of timings between the current row and the row right after.
2 Filter out Px and Py values that are out of the range of the 2K display
3 Filter out those timings with no fixation present, t 250[ms] , to determine the fixation location and its respective fixation duration
Phase 2: Post Processing of Radar Screen Logging
Table 3. Commands traced in NARSIM radar screen loggings. Commands Meaning of the values shown with units included
rng Range of the radar display, from center of the screen to the 4 corners. [NM] OFC Position of center of the screen. [Latitude (Lat) [Deg], Longtitude (Lon) [Deg]]
Table 4. Commands traced in NARSIM radar screen loggings (Cont.). Commands Meaning of the values shown with units included
Track Update Indicates the position of the aircraft’s track on radar display, together with the callsign of the aircraft. [Lat [Deg], Lon [Deg]]
CreateLabel / MoveLabel
Indicates the point where the track label starts, in relative position to the aircraft’s track position, together with the respective callsign [Pixel X (Px), Pixel Y (Py)]
SAA Indicates the aircraft
UCO Indicates the aircraft taken under control by the ATCo
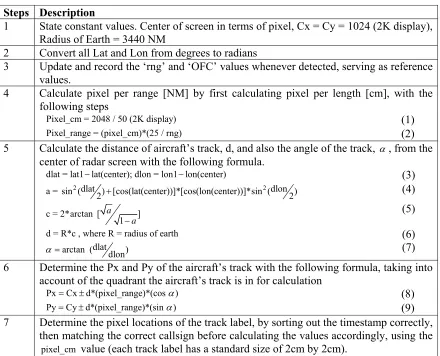
[image:4.612.88.528.357.713.2]The main aim of this phase is to determine the location of the aircraft’s track position in terms of pixel data so that it can be compared to the eye tracking metric values from the eye tracker. In addition, information like ‘rng’ and ‘OFC’ are crucial in determining the effective AOI of the radar screen. Table 5 shows the steps needed to determine the aircraft track and its respective track label in terms of Px and Py.
Table 5. Steps to determine the aircraft's track and label in Px and Py. Steps Description
1 State constant values. Center of screen in terms of pixel, Cx = Cy = 1024 (2K display), Radius of Earth = 3440 NM
2 Convert all Lat and Lon from degrees to radians
3 Update and record the ‘rng’ and ‘OFC’ values whenever detected, serving as reference values.
4 Calculate pixel per range [NM] by first calculating pixel per length [cm], with the following steps
Pixel_cm = 2048 / 50 (2K display) (1)
Pixel_range = (pixel_cm)*(25 / rng) (2)
5 Calculate the distance of aircraft’s track, d, and also the angle of the track, , from the center of radar screen with the following formula.
dlat = lat1 lat(center); dlon = lon1 lon(center) (3)
2 dlat 2 dlon
a = sin ( 2) [cos(lat(center))]*[cos(lon(center))]*sin ( 2) (4)
c = 2*arctan [ ]
1 a
a
(5)
d = R*c , where R = radius of earth (6)
dlat arctan ( dlon)
(7)
6 Determine the Px and Py of the aircraft’s track with the following formula, taking into account of the quadrant the aircraft’s track is in for calculation
Px Cx d*(pixel_range)*(cos ) (8)
Py Cy d*(pixel_range)*(sin ) (9)
7 Determine the pixel locations of the track label, by sorting out the timestamp correctly, then matching the correct callsign before calculating the values accordingly, using the
Phase 3: Determining Fixation Count per AOI and Gaze Duration per AOI
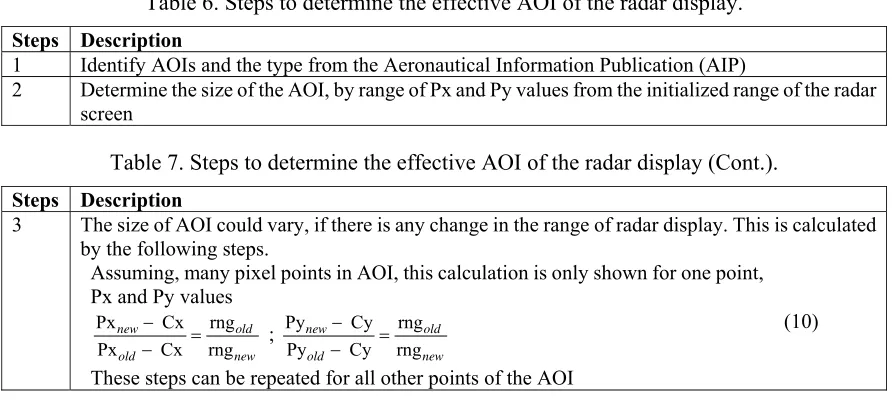
Table 6 shows the steps to determine the effective AOI, while
Table 8 shows the steps to determine the metrics measured in this experiment, total fixation count per AOI and total gaze duration per AOI.
Table 6. Steps to determine the effective AOI of the radar display.
Steps Description
1 Identify AOIs and the type from the Aeronautical Information Publication (AIP)
2 Determine the size of the AOI, by range of Px and Py values from the initialized range of the radar screen
Table 7. Steps to determine the effective AOI of the radar display (Cont.).
Steps Description
3 The size of AOI could vary, if there is any change in the range of radar display. This is calculated by the following steps.
Assuming, many pixel points in AOI, this calculation is only shown for one point, Px and Py values
Px Cx rng
Px Cx rng
new old
old new
;
Py Cy rng
Py Cy rng
new old
old new
(10)
These steps can be repeated for all other points of the AOI
Table 8. Steps to compute total fixation count per AOI and total gaze duration per AOI. Steps Description
1 Convert the posix time of eye tracking loggings to absolute simulation time [s] 2 Align the timings of the radar display loggings and eye tracking loggings
3 Determine if the fixation values are within the AOIs defined and also if the aircraft track and aircraft track label is within.
4 Determine the total fixation count per AOI by counting the total number of fixations within the AOI in the whole simulation duration
5 Determine the gaze duration per AOI by summing up the fixation duration of consecutive fixations within the AOI
6 Determine the total gaze duration per AOI by summing up all the gaze duration per AOI for each AOI
After computing all the total fixation count per AOI and total gaze duration per AOI, these values can then be tabulated across different simulations for further data analysis.
Results and Analysis
Table 9. Results of increase in number of merging on total fixation count per hotspot AOI. 40 aircraft & 0 holding scenario No merging 1 merging at ILS
% Total fixation count on ILS merging AOI 61% 67%
% Total fixation count on non ILS merging
AOI 39% 33%
Subsequently, an increase in number of holdings results in an increase in total hotspot gaze duration, as seen in Table 10. This shows that with more holdings utilized, there is more information processing done by the novice ATCo.
Table 10. Results of increase in number of holding on total gaze duration per hotpsot AOI. 1 merging & 50 aircraft scenario 0 holding 1 holding 2 holding
Total gaze duration on holding AOI [ms] 1142457 1301206 1653624
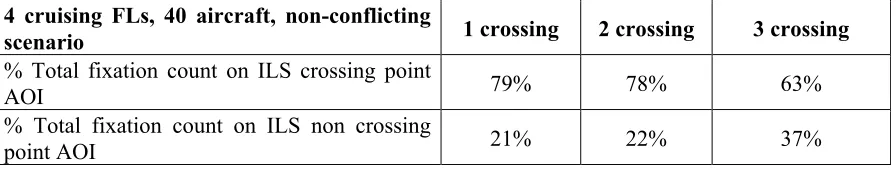
[image:6.612.85.533.345.430.2]For ER scenarios, an increase in the number of crossing results in an increase of total fixation counts at non-crossing AOIs, as seen in Table 11. This shows that novice ATCos plan for conflict detection. As a result, there is an increase in the non-crossing point AOIs.
Table 11. Results of increasing the number of crossing on total fixation count per hotspot AOI. 4 cruising FLs, 40 aircraft, non-conflicting
scenario 1 crossing 2 crossing 3 crossing
% Total fixation count on ILS crossing point
AOI 79% 78% 63%
% Total fixation count on ILS non crossing
point AOI 21% 22% 37%
Conclusion
This study shows that such eye tracking metrics can be derived in such a manner is effective and sensitive enough to detect any changes in the eye movement behaviour of the ATCo, as seen in the results presented. Therefore, this can then serve as a good starting point for researchers who wish to study the eye movement behaviours, relating to the cognitive process of ATCos.
Further work can be done to implement more eye tracking metrics to test their effectiveness similarly. Subsequently, more work can be done to determine the limit of the zooming action and the effectiveness of the AOIs pre-defined.
Acknowledgement
This research was conducted in the Air Traffic Management Research Institute (ATMRI) of Nanyang Technological University (NTU), using the radar lab of ATMRI. The author would like to thank the staff at ATMRI for helping out with the setting up of the radar lab to ensure that the simulations of the experiment can run smoothly.
[1] R. Jacob and K.S. Karn, “Eye tracking in human-computer interaction and usability research: Ready to deliver the promises,” Mind, vol. 2, p. 4, 2003.
[2] H.E. Blanchard, A. Pollatsek, and K. Rayner, “The acquisition of parafoveal word information in reading,” Perception & Psychophysics, vol. 46, pp. 85-94, 1989.
[3] A. Duchowski, Eye tracking methodology: Theory and practice vol. 373: Springer Science & Business Media, 2007.
[4] L.J. Ball, E.J. Lucas, J.N. Miles, and A.G. Gale, “Inspection times and the selection task: What do eye-movements reveal about relevance effects?,” The Quarterly Journal of Experimental Psychology, vol. 56, pp. 1053-1077, 2003.
[5] G. Zelinsky and D. Sheinberg, “Why some search tasks take longer than others: Using eye movements to redefine reaction times,” Studies in visual information processing, vol. 6, pp. 325-336, 1995.
[6] A. Poole and L.J. Ball, “Eye tracking in HCI and usability research,” Encyclopedia of human computer interaction, vol. 1, pp. 211-219, 2006.
[7] G. Hauland, “Measuring team situation awareness by means of eye movement data,” in Proceedings of HCI International, 2003, pp. 230-234.
[8] U. Ahlstrom and F.J. Friedman-Berg, “Using eye movement activity as a correlate of cognitive workload,” International Journal of Industrial Ergonomics, vol. 36, pp. 623-636, 2006.
[9] S.C. Sereno and K. Rayner, “Measuring word recognition in reading: eye movements and event-related potentials,” Trends in Cognitive Sciences, vol. 7, pp. 489-493, 2003.
[10] C. Moehlenbrink and A. Papenfuss, “Eye-data metrics to characterize tower controllers' visual attention in a Multipe Remote Tower Exercise,” 2014.
[11] X.P. Kotval and J.H. Goldberg, “Eye movements and interface component grouping: an evaluation method,” in Proceedings of the Human Factors and Ergonomics Society Annual Meeting, 1998, pp. 486-490.
[12] M.A. Just and P.A. Carpenter, “Eye fixations and cognitive processes,” Cognitive Psychology, vol. 8, pp. 441-480, 1976.
[13] C. Mello-Thoms, C.F. Nodine, and H.L. Kundel, “What attracts the eye to the location of missed and reported breast cancers?,” in Proceedings of the 2002 Symposium on Eye Tracking Research & Applications, 2002, pp. 111-117.