1
Improving the Building Performance and Thermal Comfort of an Office Building to Reduce
Overheating Risk
Heba Elsharkawy
1, Sahar Zahiri
1, Bertug Ozarisoy
11
Department of Architecture and Visual Arts, School of Architecture, Computing and Engineering
(ACE), University of East London, London, E16 2RD, UK
Abstract
In recent decades, efficient design of office buildings has become increasingly important due to its direct impact on occupants’ health, wellbeing, and productivity. Research found that issues within the indoor environment of the workplace, such as poor ventilation, lighting, and high levels of harmful gases and air borne particles has a significant influence on reduced productivity. This study aims to investigate the issues of overheating and propose strategies for retrofit of a modern office building in London as a case study. To achieve the research aim; a quantitative research methodology is adopted comprising three methods of data collection and analysis; a survey questionnaire, indoor data monitoring, and dynamic thermal modelling and simulation. The results show a significant improvement in the building thermal performance by retrofitting the building roof envelope where the indoor air temperature reduced from 29.3 to 26.9°C hence potential improvement of occupants’ thermal comfort.
Introduction
The quality of the indoor environment has an important role in providing thermal comfort and improve productivity of the users especially in educational and office buildings (Hauge et al., 2011). The British Council for Offices (BCO) reported that twenty three million days were lost in 2014-2015 as a result of employees’ illnesses caused by or caught at work (BCO, 2015). In a study by Niemela (2017), the cost effectiveness of different retrofit strategies on a 1980s office building was undertaken based on occupant productivity upsurge. The study found that the comfort of occupants and their productivityy were stongly correlated; hence investing in occupant comfort had a significantly positive economic effect.
Improved building regulations may result in over-insulated and airtight building envelopes to reduce the heating energy use. However, the risk of overheating can also increase if the building designs are not fit for purpose (Shrubsole et al., 2014). It has been suggested that including shading and natural ventilation requirements in the building regulations would prove effective to achieve better indoor environmental quality (Chappells & Stove 2005). Moreover, a study conducted by monitoring the potential indoor overheating in summer in London demonstrated that the risk of overheating under the current climate and future climate scenarios is becoming considerably high (Pathan et al., 2017). Hence, the study asserts that incorporating climate change adaptation strategies in building design and retrofit is vital in order to reduce overheating risks in buildings.
To reduce the overheating risk, it is vital to use the design strategies appropriate to particular climatic regions. It is also important to consider the local microclimate and the local architecture in building design when considering overheating risk in buildings (Liu et al., 2017). These design strategies include appropriate shading devices, building orientation, thermal insulation, thermal mass as well as appropriate glazing type and allowing for natural ventilation. In addition, reducing the overall heat gain from the occupants, electronic appliances and solar radiation in indoor environment may also significantly reduce overheating problems (Costanzo and Donn, 2017). A well-insulated building envelope has a positive impact in providing a comfortable indoor thermal condition (Costanzo and Donn, 2017). However, studies show that the internal heat gain cannot discharge from indoor spaces if the building has abundant thermal insulation, which may contribute to overheating in warm seasons (Aste et al., 2015). A recent research on overheating risk in office buildings shows that if a building has a lightweight structure with a significant internal heat gain and a minimum heat capacity, the internal air temperature may rise considerably with the rise of external air temperature (Brambilla and Jusselme, 2017), resulting in increased indoor air temperature over the maximum thermal comfort band. In order to prevent the overheating in indoor environments, it is important to consider the capacity of the building materials in retaining the internal heat (Aste et al., 2015) which varies with different building materials in diverse climatic regions.
A recent study undertaken by Costanzo and Donn (2017) on the effect of natural ventilation on thermal comfort of office building occupants shows that natural ventilation is a very effective way to improve the indoor thermal comfort. The effectiveness of natural ventilation on thermal comfort can increase when optimising the window characteristics including the size, the position, the transmission value, U-value and the type and location of shading devices. The performance of the building material with regards to the heat capacity can be improved using the night-time ventilation during the warm seasons to flush the heat tranferred and retained within the building fabric during the day time (Aste, Angelotti and Buzzetti, 2009). The current study aims to investigate how occupants’ thermal comfort, and building thermal performance interact in a modern office building in East London as a case study.
Case study
2 (Fig. 1, 2, 3) has been selected as the research case study
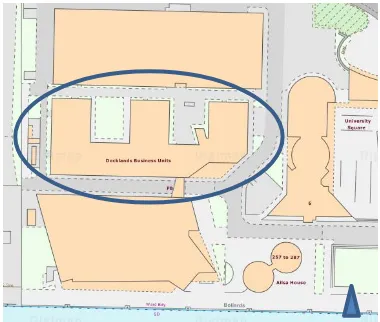
[image:2.595.76.266.202.363.2]where there have been a number of complaints from the occupants regarding issues with thermal comfort and overheating of some of the offices in the summer. The study explores the underlying issues causing occupants’ complaints of excess heat in the summer to develop a retrofit intervention that reduces the risk of overheating and improves thermal comfort. If the business unit areas are not thermally comfortable, it can reduce the productivity of the occupants during the working hours.
[image:2.595.58.260.405.492.2]Figure 1: The location of the office building on the university campus (Digimap, 2018)
Figure 2: Ground floor plan of the building showing the problematic block under study. Note fire doors separate the block from the building
Figure 3: External southeast elevation of the building demonstrating the metal cladding and fenestrations. The building was built in 2006 with steel frames and metal cladding and was refurbished at a later date. The block under study comprises three floors with 6278 square metres of office space with 75 businesses based in the offices. The offices are generally occupied from Monday to Friday between the hours of 9am to 6pm. The building
is surrounded by a four-storey high library to its south, a 3-storey building further away from its east and a 2-storey building from its north. The block studied is thermally seperated from the rest of the building with a double fire door on each floor.
Research methodology
A quantitative research methodology is adopted to address the research aim comprising three methods of data collection and analysis. An online survey questionnaire was designed and distributed to the building users during summer 2017 to gain insight into occupants’ patterns of using the offices, comfort and satisfaction levels, and overall experience with the indoor environment of their offices throughout the warm and cold seasons. Secondly, data loggers were fitted on all 3 levels of the building to record air temperature and relative humidity (RH) for the duration of summer 2017 to facilitate a comprehensive analysis of indoor environmental conditions. Finally, dynamic thermal modelling using Integrated Environmental Solution Virtual Environment (IES-VE) was employed for in-depth investigation of the building thermal performance and to facilitate data triangulation with the survey analysis and indoor monitored data. The survey results showed that many occupants suffered thermal discomfort in their offices.
[image:2.595.58.283.539.664.2]3
Results and discussion
Survey questionnaire
As mentioned, a questionnaire-based survey was conducted in the case study building during the summer while the indoor thermal comfort variables for summer months were being monitored. Overall, 37 responses were collected which represents a 25% response rate. The results show that 81% of respondents usually felt warm, or slightly warm during the working hours in the summer in their offices. Sixty eight percent would prefer to feel cooler, or much cooler than they currently feel in the summer.
Figure 4: How do you generally feel in your office during the summer season? (Carter et al., 2017)
[image:3.595.318.533.78.186.2]In response to the question concerning air movement in the offices while the windows are open in the summer, 54% felt it was either very still or still while only 14% reported it was breezy. It should be noted that the vast majority of respondents stated that they opened their windows at all times during the summer where around 80% would normally keep their office windows open during the working hours of the day. However, windows are top hinged and can only open at 30 degrees which casue a limitation to the amount of air flow in the offices.
Figure 5: How would you rate the air movement in your office during summer with windows open? (Carter et al., 2017)
[image:3.595.64.278.223.329.2]Moreover, there were mixed responses to the question concerning people’s experience with relative humidity in their office during the summer with 41% reporting they would rate it as very humid or humid, 16% rated it as dry or very dry, while 43% reported it as neutral.
Figure 6: How would you rate the air humidity in your office during the summer season? (Carter et al., 2017) Furthermore, the majority of the offices used secondary cooling systems; 63% portable fans while 18% used portable air conditioning units. When asked how they would suggest thermal comfort in their offices could be improved in the summer; nearly half the respondents suggested the installation of mechanical cooling systems, 16% suggested to have more local control over the internal office environment, while 16% suggested more openable windows would help enhance air flow.
Indoor data monitoring
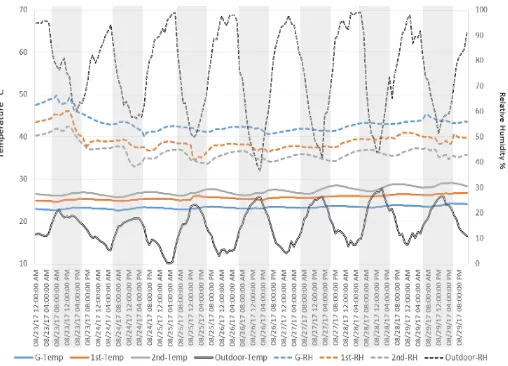
The indoor air temperature and RH levels have been monitored using data loggers fitted in the central corridor of the three floors of the building to monitor, and evaluate the indoor environmental conditions associated with occupants’ thermal comfort. The results shown in Figure 7 demonstrate the hottest week of the summer. The graph reveals fluctuations of indoor air temperature, where the range recorded was between 23°C (on the ground floor) and 29°C (on the second floor) whereas the external air temperature reached its highest at 28°C. However, the Chartered Institution of Building Services Engineers (CIBSE) in their Guide A (CIBSE, 2015) recommend that (in naturally ventilated buildings the temperature will be acceptable if) for sedentary areas such as offices an inside dry resultant temperature of 25°C is not exceeded for more than 5% of the annual occupied period (typically 125 h).
Figure 7: Indoor air temperature and RH of the Business Unit ground, first and second floors during the hottest week of August 2017
3% 3% 5% 0% 8%
18% 63%
0% 20% 40% 60% 80% 100%
Cold Cool Slightly cool
Neutral Slightly warm
Warm Hot
24% 30% 32%
11%
3% 0%
20% 40% 60% 80% 100%
Very Still Still Neutral Breezy Very breezy
8% 8%
43%
14%
27%
0% 20% 40% 60% 80% 100%
[image:3.595.63.277.484.588.2] [image:3.595.300.554.549.732.2]4 As for the measured RH levels, those have been found to
be normally within the comfort range (40-70%). The results of the field measurements show that the main areas of concern, with regards to thermal comfort of occupants, are the offices on the second floor followed by those on the first floor. Initial building survey results demonstrate a lack of appropriate natural ventilation coupled with the east-southeast orientation of most of the offices in which the façade is characterized by 40% window to wall ratio with no effective solar protection (overhangs or external louvers) other than internal blinds. In addition, the data loggers validated occupants’ experiences where peaks in indoor air temperatures have been recorded throughout the summer months. The results are also corroborated by IES dynamic thermal modelling of the building that helped understand the building cooling demands and investigate potential retrofit interventions.
Simulation and analysis
[image:4.595.308.536.118.242.2]Integrated Environmental Solutions Virtual Enviromnment (IES-VE) software was employed in the study due to its recognized reliability as a research-informed tool with minimal error margins (Crawley et al., 2006). The applications used are Apache-Sim for energy simulations, Sun-Cast to simulate solar heat gain on the building envelope, and the Vista-Pro/Comfort settings for assessing the adaptive comfort according to CIBSE Technical Memorandum 52 (CIBSE ™ 52) guidelines. London/Gatwick Airport - ASHRAE Climate Zone:4 weather file was used in the model as the case study location is east London. Table 1 demonstrates the building geometric and technical specifications used to set up the model. All the specifications have been provided in detailed drawings from the university facilities department.
Table 1. Building features and thermal characteristics of the construction elements in the simulated model.
Internal gross floor area (m2) 6278.79
Total volume 17174.41 (m2)
Number of floors 3
Area-to-volume ratio [m-1] 0.33
Floor surface of a typical tested room 42.5 (m2)
Room volume of a typical tested
room 102.7 (m
3)
Window size 1.5 x 1.2 (m2) per
window pane Partition wall: U-value 2.7 W/(m2K)
External wall: U-value 0.68 W/(m2K)
Roof: U-value 2.17 W/(m2K)
Floor/ceiling: U-value 2.8 W/(m2K)
Glass U-value 2.7 W(m2K)
Lightweight metal cladding 1.13(m2K)
Solar-shading system Internal blinds with
shading factor 0.2
Mechanical ventilation No
The occupancy schedules for offices under risk of overheating in the summer was obtained from the occupants’ survey. The occupancy model used consists of five persons in each office space based on the maximum capacity of offices. Table 2 illustrates the occupancy
[image:4.595.306.539.435.554.2]schedules and internal heat gains of the office building used in the model.
Table 2. Main data concerning typical office room in the simulated model.
Simulation period 1st January - 31st December Occupancy rate 0.12 (people/m2)
Occupants number 5 occupants
Occupancy time 09:00-18:00
People sensible thermal
load 60 (W/person)
Equipment (computers
and desk lights) 100 (W/each)
Lights 8 (W/m2)
Infiltration rate 0.2778 l/(m2s)
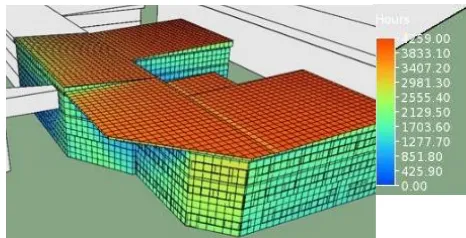
The Suncast simulation analysis (Figure 8) demonstrates that the annual maximum number of hours of exposed surfaces to solar radiation is on the roof surface (approximately 4200 hours) followed by the southeast façade of the building (approximately 2800 hours). From the survey results and indoor monitoring, it has been confirmed that the most susceptible floor to overheating is the second floor, followed by the first floor, with the ground floor having the least/no issues with thermal comfort. The following stage of the analysis will focus on the office spaces on the ground (office 1), first (office 2) and second floor (office 3) in the southeast corner of the building.
[image:4.595.56.291.506.702.2]5 high radiation gains combined with lightweight metal
cladding results in more overheating risks in Office 3 when compared to Office 1. This is not entirely due to solar gain as it is the most susceptible to conduction gains due to its higher roof absorptivity characterised by a high thermal transmittance value (2.17 W/(m2K).
[image:5.595.68.277.207.344.2]As illustrated in figures 9, 10 and 11, the cooling load in August increases from 1.7 kW in office 1 on the ground floor, to 1.8 kW in office 2 on the first floor, to 3.0 kW in office 3 on the second floor.
[image:5.595.67.278.391.530.2]Figure 9: Cooling load of ground floor office space in August reaches a maximum of 1.7 kW
Figure 10: Cooling load of first floor office space in August reaches a maximum of 1.8 kW
Figure 11: Cooling load of second floor office space in August reaches a maximum of 3.0 kW
Overheating in Office 3 can be seen to be significantly higher than in Office 1 and 2 with the indoor air temperature recorded on data loggers (Figure 7) and also simulated in the model (Table 5) to be above the maximum comfort level for prolonged hours in the summer months. The results demonstrate that temperatures rose above 26.8°C in Office 1 and 29.3°C in Office 3. One note that high summer temperatures are observed in zones facing south with highly glazed facades without any external shading devices but not generally for prolonged periods. The ground floor office 1 with much lower values of solar gains, easily meets the CIBSE ™ 52 overheating criteria. Although, in Office 1 there is also significant risk for all other occupied rooms on the same floor to overheat in current conditions. As previously mentioned that the solar gains are relatively during the hottest months of the summer – in this case during August.
Optimisation Studies
The following step has been the evaluation of potential roof envelope retrofit strategies to help reduce overheating risk and optimise occupants’ thermal comfort of the case under study with a focus on the second floor Office 3. In order to compare the overheating and thermal comfort of various roof retrofit scenarios when there is no Heating, Ventilation and Air Conditioning (HVAC) system for each scenario, the thermal performance of Office 3 was studied comparing the hours of discomfort by using CIBSE ™ 52. For this analysis, three selected strategies were tested in order to assess the efficiency of the each as a potential retrofit proposal. The three systems chosen to retrofit the existing metal clad roof have been selected according to lower U-values, and feasibility of retrofit. The first strategy (S1) is a 273mm layer of felt and membrane insulation, batt insulation and roof felting where the total U-value is 0.4 W/m2K. The second strategy (S2) is a 109mm layer of Polyvinyl Chloride / Thermoplastic Polyolefin Elastomer (PVC/TPE) with roofing felt specified by a total U-value of 0.48 W/m2K. The third and last strategy (S3) is a 249mm thick green roof composed of mineral fibre, cavity, thermalite turbo and vegetation (U-value 0.53 W/m2K). Table 3 illustrates the assigned construction properties of the base case roof envelope and the three strategies applied in the simulation.
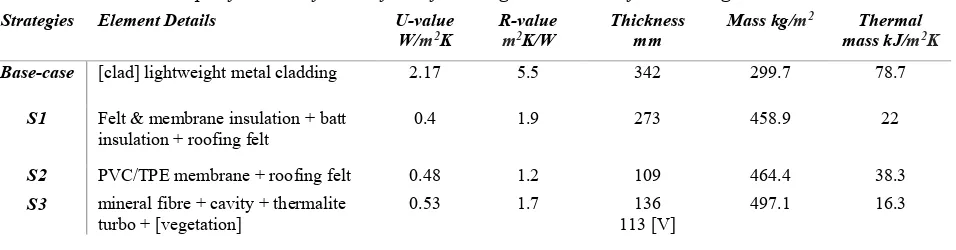
[image:5.595.66.279.577.721.2]6 Table 3. Specifications of the roof retrofit strategies and those of the existing base-case.
Strategies Element Details U-value
W/m2K R-value m2K/W Thickness mm Mass kg/m
2 Thermal
mass kJ/m2K
Base-case [clad] lightweight metal cladding 2.17 5.5 342 299.7 78.7
S1 Felt & membrane insulation + batt
insulation + roofing felt 0.4 1.9 273 458.9 22
S2 PVC/TPE membrane + roofing felt 0.48 1.2 109 464.4 38.3
S3 mineral fibre + cavity + thermalite
turbo + [vegetation] 0.53 1.7 113 [V] 136 497.1 16.3
Overheating
Table 4. Optimisation-based summer time overheating results of the case study office building.
Strategies Occupied days (%) Criteria 1 (%Hrs
Top-Tmax≥1K) Criteria 2 (Max. Daily Deg.Hrs) Criteria 3 (Max. DeltaT) Criteria failing
Base-case 71.2 1.7 9 2 2
S1 71.2 0.3 2 1 -
S2 71.2 0.5 1 1 -
S3 71.2 0.3 2 1 -
Thermal Comfort
Table 5. Simulation based thermal comfort of the occupied rooms of the case study office building.
Temperature Relative Humidity PPD
Room Name Max°C Min°C Max % Min % Max % Min %
Base-case 29.3 19.0 74.4 18.4 52.6 5
S1 28.4 19.0 76.2 18.4 41.2 5
S2 26.9 19.0 78.6 17.2 36.1 5
S3 27.4 19.0 80.0 18.9 37.1 5
* The PPD max limit value is 15% - PPD is the percentage of people that will find the room thermally uncomfortable.
Dissatisfied (PPD) which, according to CIBSE ™ 52, should not exceed 15%. As can be seen in Table 5; PPD reduces from 52% in the base-case scenario to 36% in S2 which is a significant improvement, yet, still unacceptable and prompts for more building performance optimisation interventions.
Conclusion
The study sought to undertake an in-depth investigation into the building thermal performance and occupants’ thermal comfort of the Business Unit in an office building located in London. The aim was to encourage occupants to be inclined to remain in the offices for the long term and not be dissuaded by the poor thermal comfort levels as is the current situation. A quantitative research has been designed based on data collected from a questionnaire survey, data loggers to monitor the office indoor environment, and dynamic thermal modelling and simulation undertaken by IES-VE. The results found from the survey and data loggers both provided strong evidence of overheating hence thermal discomfort in many office
spaces, particularly on the second floor followed by several spaces on the first floor. Meanwhile, the ground floor appeared to remain within the comfort range throughout the data collection period. Most occupants reported it was often too hot in the summer to be comfortable to work and that they had to keep windows open and use portable fans to keep themselves cooler. The data loggers have corroborated with the views of the occupants by recording temperatures above thermal comfort levels or at the higher end of the comfort range throughout the data collection period from July to September.
7 results on building performance and thermal comfort. It
has been found that the second strategy which includes a 109mm layer of PVC/TPE with roofing felt specified with a total U-value of 0.48 W/m2K reduced the indoor air temperature from 29.3 to 26.9°C in the second floor office space and effectively reduced overheating according to CIBSE ™ 52 criteria of overheating. However, the next phase of the study is to explore other feasible and holistic proposals to further improve thermal comfort in the office spaces and determine the energy and cost savings of the optimum retrofit intervention.
Acknowledgments
The authors would like to acknowledge the British Council Newton Institutional Links Fund (Grant number 2015EGY01) for supporting this research study. They would also like to acknowledge Beth Carter for helping with the survey design and initial data analysis.
References
Aste, N. et al. (2015) ‘Thermal inertia and energy efficiency - Parametric simulation assessment on a calibrated case study’, Applied Energy, 145, pp. 111–123. doi: 10.1016/j.apenergy.2015.01.084. Aste, N., Angelotti, A. and Buzzetti, M. (2009) ‘The
influence of the external walls thermal inertia on the energy performance of well insulated buildings’, Energy and Buildings, 41(11), pp. 1181–1187. doi: 10.1016/j.enbuild.2009.06.005.
Brambilla, A. and Jusselme, T. (2017) ‘Preventing overheating in offices through thermal inertial properties of compressed earth bricks: A study on a real scale prototype’, Energy and Buildings, 156, pp. 281–292. doi: 10.1016/j.enbuild.2017.09.070. British Council for Offices (BCO) (2015). Putting
People First: Designing for health and wellbeing in the built environment
Carter, B., Elsharkawy, H. & Zahiri, S. (2017) International Conference for Sustainable Design of the Built Environment (SDBE), 12-13 September, London.
Chappells, H. & Shove, E. (2005). Debating the future of comfort: environmental sustainability, energy consumption and the indoor environment. Building Research & Information, 33, pp. 32-40, Tayloy & Francis.
Crawley, D. B.; Hand, J. W.; Kummert, M. & Griffith, B. T. (2006). Contrasting the capabilities of building performance simulation programs. Building and Environment, 43, pp.661-673.
CIBSE (2017) Technical Memorandum 52: The Limits of Thermal Comfort - Avoiding Overheating in European Buildings, CIBSE, London.
CIBSE (2015) GVA/15 Guide A: Environmental Design, CIBSE, London.
Costanzo, V. and Donn, M. (2017) ‘Thermal and visual comfort assessment of natural ventilated office buildings in Europe and North America’, Energy and Buildings, 140, pp. 210–223. doi:
10.1016/j.enbuild.2017.02.003.
Defra (2009) ‘Adapting to climate change UK Climate Projections’, Uk Climate Projections, (June), p. 52. Gallardo, A., Palme, M., Lobato-Cordero, A., Beltran,
R.D. & Gaona, G. (2016). Evaluating thermal comfort in a naturally conditioned office in a temperate climate zone. Buildings, 6, pp. 27-47. MDPI.
Hauge, A.L., Thomsen, J. & Berker, T. (2011). User evaluations of energy efficient buildings: Literature review and further research. Advances in Building Energy Research, 5, pp. 109-127. Earthscan.
IPCC. (2014) 5th Assessment Report on Climate Change 2014: Mitigation of Climate Change.
Intergovernmental Panel on Climate Change.
Langevin, J., Wen, J. & Gurian, P.L. (2016). Quantifying the human-building interaction: Considering the active, adaptive occupant in building performance simulation. Energy and Buildings, 117, pp. 372-386. Elsevier.
Liu, C. et al. (2017) ‘High resolution mapping of overheating and mortality risk’, Building and Environment, 122, pp. 1–14. doi:
10.1016/j.buildenv.2017.05.028.
Niemela, T., Levy, K., Kosonen, R. & Jokisalo, J. (2017). Cost-optimal renovation solutions to maximize environmental performance, indoor thermal conditions and productivity of office buildings in cold climate. Sustainable Cities and Society, 32, pp. 417-434. Elsevier.
Pathan, A. et al. (2017) ‘Monitoring summer indoor overheating in the London housing stock’, Energy and Buildings, 141, pp. 361–378.
https://doi.org/10.1016/j.enbuild.2017.02.049. Shrubsole, C. et al. (2014) ‘100 Unintended
consequences of policies to improve the energy efficiency of the UK housing stock’, Indoor and Built Environment, 23(3), pp. 340–352. doi: