University of Huddersfield Repository
Ashari, Djoni, Lane, Mark, Gu, Fengshou and Ball, Andrew
Detection and Diagnosis of Broken Rotor Bar Based on the Analysis of Signals from a Variable
Speed Drive
Original Citation
Ashari, Djoni, Lane, Mark, Gu, Fengshou and Ball, Andrew (2014) Detection and Diagnosis of
Broken Rotor Bar Based on the Analysis of Signals from a Variable Speed Drive. In: 3rd
International Workshop and Congress on eMaintenance, 17th 18th June 2014, Lulea, Sweden.
This version is available at http://eprints.hud.ac.uk/id/eprint/21060/
The University Repository is a digital collection of the research output of the
University, available on Open Access. Copyright and Moral Rights for the items
on this site are retained by the individual author and/or other copyright owners.
Users may access full items free of charge; copies of full text items generally
can be reproduced, displayed or performed and given to third parties in any
format or medium for personal research or study, educational or notforprofit
purposes without prior permission or charge, provided:
•
The authors, title and full bibliographic details is credited in any copy;
•
A hyperlink and/or URL is included for the original metadata page; and
•
The content is not changed in any way.
For more information, including our policy and submission procedure, please
contact the Repository Team at: [email protected].
Detection and Diagnosis of Broken Rotor Bar based on the
Analysis of Signals from a Variable Speed Drive
D. Ashari
Centre of Efficiency and Performance Eng. University of Huddersfield
Queensgate Huddersfield HD1 3DH, UK
+44 01484 471193
M. Lane
Centre of Efficiency and Performance Eng. University of Huddersfield
Queensgate Huddersfield HD1 3DH, UK
F. Gu
Centre of Efficiency and Performance Eng. University of Huddersfield
Queensgate Huddersfield HD1 3DH
A.D. Ball
Centre of Efficiency and Performance Eng. University of Huddersfield
Queensgate Huddersfield HD1 3DH, UK
ABSTRACT
In this paper, the diagnosis of broken rotor bar (BRB) is investigated analytically and experimentally based on induction motors (IM) with variable speed drives (VSD). The analysis of the VSD process has understood that the sensorless control mode adjusts both supply voltage and current in order to maintain the operating speed within high accuracy. It means that any asymmetric problems with the rotor such as BRB will cause changes to current, voltage and power signals. Therefore, all of these signals can be used to diagnose BRB. However, experimental studies show that the components at twice slip frequency can be extracted more reliably in the spectrum of power signal which contains diagnostic information of both current and voltage signals. Consequently, it produces better results in separating different BRB cases under sensorless control mode, compared with that of using either current or voltage signal.
Keywords
Broken rotor bar, Variable speed drive, Motor current signature analysis, Instantaneous power,
1.
INTRODUCTION
Broken rotor bars (BRB) in induction motors are a common fault which often brings low efficiency operation and even unexpected breakdowns, leading to loss of productivity. To provide timely warning of the fault, many studies have been carried out to develop more accurate diagnostic methods. As shown in the review papers [1, 2], most previous works utilises the spectrum analysis of phase current signals from which the sideband
components at frequency (12ks)fs (s is the rotor slip and fs is
the supply frequency, and harmonic integer (k1,2,3,...n) are
extracted to diagnose such faults.
However, these studies have been carried out based on motors without modern variable speed drives (VSD), which have been widely used in many plants to achieve high efficient production. In general, a VSD can be configured to operate under with a sensorless control mode or a volt/Hz mode. Both of these modes adjust both supply voltage and current in order to maintain the operating speed within high accuracy. It means that the effect of BRB will reflects on both of these signals, which is significantly different from motors without VSD where only current signal reflects BSB features .
Therefore, this studies focus on evaluating the diagnostic features of BRB cases under sensorless control mode using current, voltage and power signals. To understand of what the results of this case, the volt/Hz mode is analysed and presented as a comparison purposes.
Different analysis methods such as spectrum have been applied to stator current signals, which is known as motor current signature analysis (MCSA) and employed as a popular technique for BRB diagnosis. In the meantime, instantaneous power (IP) spectrum also becomes an effective monitor of machine health in order to remove the effect of the high amplitude at supply frequency and simplify the complexities of the stator current and axial flux spectra. The work was started [3] by showing that in the current spectrum shows two sideband components whereas in IP spectrum jus show the low frequency component due to the fault on rotor. This shows the superiority of IP to the current stator spectra shown on (1)[3].
M t
P t
PABC ABC OSC
t OSC t OSC t OSC L I LL MV t CB P t CB P t OSC t OSC t OSC L I LL MV t AB P t AB P cos 1 )
( ,0
cos 6 cos 2 6 5 2 cos 6 5 2 {cos 2 1 ) ( 0 , ) ( cos 6 cos 2 6 2 cos 6 2 {cos 2 1 ) ( 0 , ) ( (1)
where VLL, IL are rms values of line-to-line voltage and line
currents, respectively; ω is supply frequency in radians per
second, φ is power factor angle and M is modulation depth.
The last technique is shaft voltage or current monitoring. Many electrical utilities have tried to monitor voltage in the hope that they may be an indicator of core or winding degradation, because they give rise to large shaft currents. However, the shaft voltage on its own gives no useful parameter for monitoring as the voltage is difficult to measure continuously and the damage to the machine needs to be substantial before a significant variation in shaft voltage occurs [4]. However, these voltage parameters become useful when these are used with the presence of the current parameters, as IP.
signals, operation modes: volt/Hz and sensorless mode. The paper will examine the detection and diagnosis performance of current, voltage and instantaneous power by using spectrum analysis. A 4-kW three-phase squirrel-cage IM and voltage source inverter with vector-control technique for open loop and sensorless controlled were used for the experiment. Detailed of the IM specifications can be seen on the Appendix and operating principle of the voltage source inverter is discussed later on the next section. The paper has further five more sections. Section 2 explains the principle of VFD and how BRB influences current and voltage in a VSD system. Section 3 describes the test system and test procedure. Section 4 discusses the results and Section 5 is the conclusion.
(a) Equivalent Circuit of a Rotor
[image:3.595.52.292.250.462.2](b) Equivalent Circuit of a Rotor with one broken bar
Figure 1 Equivalent Circuit of a Rotor with one broken bar
2.
PRINCIPLES OF VSD AND HOW BRB
INFLUENCES CURRENT AND VOLTAGE
IN A VSD SYSTEM
2.1
Control Process
Extensive VSD control has been reported [5], basically developed for the understanding of ac motor equivalent circuit, then Clarke and Park Transforms and concept on direct-quadrature (d-q) control. The d-axis and q-axis are perpendicular and d-axis represents the speed and q-axis represents torque of the motor to be controlled. The so called FOC consists of direct and indirect/sensorless controller. Direct Field Orientation Control (DFOC) which estimates the angle of machine by making use of the sensor of machine or an observer which makes use the measured electrical quantities at terminals of the machines. This term called sensorless. Indirect Field Oriented Control (IFO) uses mechanical sensor/encoder to measure the shaft speed.
Two control modes for Field Oriented Control (FOC) are torque and flux linkage control. FOC allows independent control of torque and flux linkage under transient condition. For the speed
control mode, the torque feed forward is embedded for calculation of the motor electromagnetic torque.
The speed observer structure for calculating the rotor speed in the absent of an encoder is included in the controller. The Model-reference Adaptive System (MARS) is used for the drive controller. MARS estimates the speed to improve the accuracy of rotor flux estimation.
The speed observer structure and its frequency characteristics should aware of:
-controllers parameters tuning;
-state variables estimators parameters tuning; and
-machine equivalent circuit parameters estimation accuracy
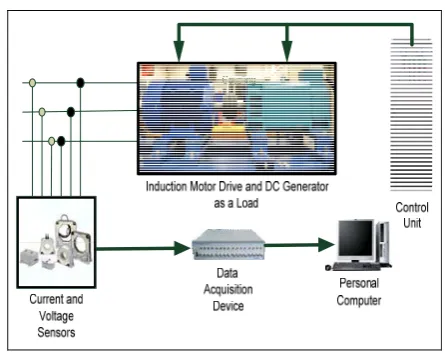
Figure 2 Schematic diagram of the induction motor test facility
For a high-performance drive non-linear system identification of a motor drive system is required and the results of system identification could provide the controller with information regarding the load variation, system noise, and parameter variation of the induction [6]. This is needed for the controller parameter tuning.
2.2
BRB induced changes in current and
voltage
Broken rotor bar and end-ring condition is one of induction machine asymmetrical stator and/or rotor winding connection. This asymmetrical operation results in unbalanced air gap voltage, consequently unbalanced line currents, increased losses, increased torque pulsations and decrease average torque. At the most severe faults, it will result in poor efficiency and excessive heating which eventually leads to the failure of the machine.
Figure 1(a)-(b) show the equivalent circuits of the BRB showing the rotor loop current and end ring current. Detailed calculations are proposed in [7]. The results are that marked increases in the
lower sideband of the first harmonic (LSB1) which is (12s)
times the synchronous frequency, corresponding to (12ks)fsin
[image:3.595.323.546.259.437.2]BRB can be explained further [8] by suggesting that sensors should be non-invasive, reliable, accurate diagnosis, severity of the problem should be quantified, ideally an estimation of remaining life time and on-line. Quantification of the severity of faults and remaining life-time are topics to be explored into details on the future works.
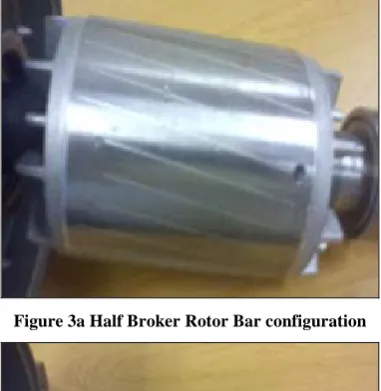
Figure 3a Half Broker Rotor Bar configuration
Figure 3b One Broken Rotor Bar configuration
More details on current signature analysis have been presented in [9] on the new improved BRB diagnosis based on modulation signal bispectrum analysis. The current signals on the healthy machine and under BRB are explained. The ideal electromagnetic relationship of the driving motor on both healthy and under BRB can be examined. The results are that the additional current with
sinusoidal wave at frequency 2sfs for the case of BRB can be
found. This so called fault frequency for the case of BRB has components of amplitude and phase angle. It is shown that current signal of the faulty case exhibits three new additional components compared to the healthy one. Two of these are the lower sideband components at the same frequency, but with different phases, and the other is the upper sideband component with a phase different from the previous two.
3.
TEST SYSTEM AND TEST
PROCEDURE DESCRIPTION
[image:4.595.74.264.286.506.2]The test motor is a three-phase IM with rated output power of 4 kW at speed 1420 rpm (two-pole pairs). To change the speed of the motor, a digital variable speed controller is attached to the test rig between the power line source and the motor. The controller can be programmed to any specific shaft rotation speed. The IM is directly coupled with a loading DC generator. The field of the generator is connected to DC source through controller while the generated power was fed back to the mains electrical grid and the load in the IM can be adjusted by changing the field resistance of the DC generator. The operating load can be varied from no load to full load via the control panel.
Figure 2 shows schematic diagram of the IM test facility. The system consists of an IM, variable speed controller, coupling and DC generator as a load.
A power supply measurement box was designed to measure AC voltages and currents, using Hall Effect voltage and current transducers.
During the experimental work all the data was acquired using a YE6232B data acquisition system. This system has 16 channels, each channel with a 24 bit analogue-digital converter with a maximum sampling frequency of 96 kHz.
The voltage signals produced by inverter in the form of pulse width modulation (PWM) were filtered and put on Hilbert modulation converter.
One healthy and two predefined faults of IMs are tested. To represent faults between the case of short and open circuits, two faults of the motors are half broken on (Fig. 2) and one broken
rotor bar on (Fig. 3) faults. IMs are identical with 4kW, ∆
-connection and called healthy, half and one BRB. The data sets taken out are to be rotor speed, rms calculation from 3-phase currents and voltages, and spectrum calculation. Faults were induced by drilling carefully into the bars along their height in such a way that the hole cut the bar completely to simulate the broken rotor bar fault and then compared with a healthy motor under full constant speed and five different torque loads (0%, 25%, 50%, 75% and 100%). Each test acquired data at thirty seconds record and sampling rate of 96 kHz.
Once the data have been analysed, basic operating parameters were displayed. The operating parameters are speed, current and voltage. Some basic parameters for data acquisition were set, such as sensitivity of the current and voltage. Current spectra were analysed to see if any changes due to supply unbalance. The temperature sensor was used to monitor the temperature in specific normal operating condition.
4.
RESULTS AND DISCUSSION
To obtain the BRB component, a conventional spectrum is applied to the current, voltage and IP signals in order to evaluate their performance respectively. The spectrum is calculated using FFT from the time domain data of six repeating tests. The size of FFT is 524288, leading to a frequency resolution of 0.1831Hz because of sampling rate is 96 kHz; averaged up to 78 times. To reduce spectral leakage, a Hanning data window is applied to the data frame.
40 50 60
0 0.05 0.1
(a) Current for Baseline
Cu rr e n t( A )
0 25 50 75 100
40 50 60
0 0.05 0.1 Cu rr e n t( A )
(b) Current for Half BRB
40 50 60
0 0.05 0.1 Cu rr e n t( A )
(c) Current for One BRB
40 50 60
0 2 4 6 8
(d) Voltage for Baseline
V o lt ag e( V )
40 50 60
0 2 4 6 8 V o lt ag e( V )
(e) Voltage for Half BRB
40 50 60
0 2 4 6 8 V o lt ag e( V )
(f) Voltage for One BRB
0 50
0 10 20 30
(g) Inst. Power for Baseline
Frequency(Hz) Ins t. P o w e r( W) 0 50 0 10 20 30
(h) Inst. Power for Half BRB
Frequency(Hz) Ins t. P o w e r( W) 0 50 0 10 20 30
(i) Inst. Power for One BRB
[image:5.595.312.539.187.422.2]Frequency(Hz) Ins t. P o w e r( W)
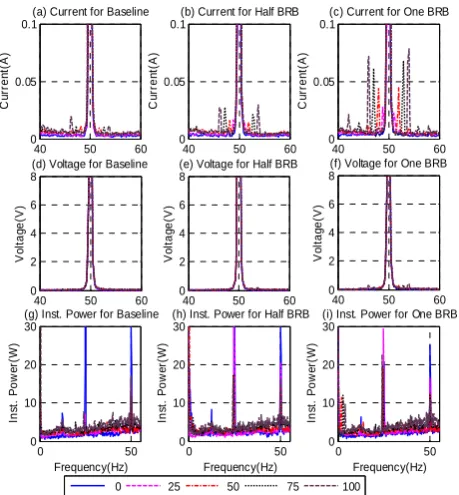
Figure 4 spectra of current, voltage and IP for different loads under volt/Hz operation
The high frequency resolution of 0.1831 Hz is needed to make a reliable identification of the sideband amplitudes. For low load operation, changes of the slip are considerably small (less than 0.02) which result in a sidebands located about less than 1Hz around the supply frequency..
4.1
Spectra of Current, Voltage and IP
The spectra from both open loop and sensorless controller are presented in Fig. 4 and 5 respectively. The comparison between current, voltage and combination current and voltage termed as instantaneous power (IP) in sensorless controller clearly indicate that the IP spectrum shows distinctive features. For the current spectrum, the gradual increased on amplitudes of slip-frequency of the spectra is clearly identified as the loads are increased. However, for voltage spectra, it is difficult to obtain the differences.
In general cases the spectra from figures 4 and 5 show that two (lower and upper) sidebands are asymmetric. The spectra show
the more 2sfs (twice slip-frequency) amplitude on the lower than
upper sideband frequencies. This agree with [9] that there are new additional components occur under BRB condition. The two components are situated on the lower sideband frequency with
different phase and the other one component lies in the upper sideband frequency.
However, on comparing the two modes, the sensorless mode gives a better view than to the volts/Hz mode.
4.2
Detection and Diagnosis Features
40 50 60
0 0.05 0.1
(a) Current for Baseline
Cu rr e n t( A )
0 25 50 75 100
40 50 60
0 0.05 0.1 Cu rr e n t( A )
(b) Current for Half BRB
40 50 60
0 0.05 0.1 Cu rr e n t( A )
(c) Current for One BRB
40 50 60
0 2 4 6 8
(d) Voltage for Baseline
Vo lt a g e (V )
40 50 60
0 2 4 6 8 Vo lt a g e (V)
(e) Voltage for Half BRB
40 50 60
0 2 4 6 8 Vo lt a g e (V )
(f) Voltage for One BRB
0 50
0 10 20 30
(g) Inst. Power for Baseline
Frequency(Hz) In st . P o w e r( W ) 0 50 0 10 20 30
(h) Inst. Power for Half BRB
Frequency(Hz) In st . P o w e r( W ) 0 50 0 10 20 30
(i) Inst. Power for One BRB
[image:5.595.56.286.205.453.2]Frequency(Hz) In st . P o w e r( W )
Figure 5 spectra of current, voltage and IP for different loads under sensorless operation
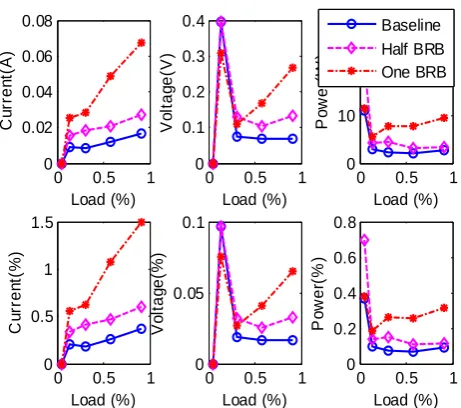
Figure 6 shows the diagnostic result comparison for healthy, half broken bar and one broken bar on volts/Hz operating mode at variable loads from no load to full rated load. The rms values were extracted from the current, voltage and extraction from both current and voltage signals to calculate IP.
At high load shows the distinct values of current, voltage and IP from healthy and faulty machines. IP vs load graph has given the best distinct values for fewer loads applied to the IM. The fault prediction on this case is easier for the load above 25% load. On the other hand, Figure 7 shows diagnosis results from the sensorless operation. In generally, it gives better results on both current and voltage vs load graph compared to the volts/Hz mode. However for IP vs load graph, sensorless operation even gives more distinctive results for healthy and faulty condition on wider range of loads.
The twice slip frequencies for each load shifts away from the
fundamental frequency (fs) as the load increases. This is means
0 0.5 1 0 0.02 0.04 0.06 0.08 Cu rre n t( A ) Load (%)
0 0.5 1 0 0.1 0.2 0.3 0.4 V o lt ag e( V ) Load (%)
0 0.5 1 0 10 20 30 Po we r( W ) Load (%)
0 0.5 1 0 0.5 1 1.5 Cu rr e n t( % ) Load (%)
0 0.5 1 0 0.05 0.1 V o lt ag e( %) Load (%) Baseline Half BRB One BRB
[image:6.595.57.288.111.315.2]0 0.5 1 0 0.2 0.4 0.6 0.8 Po we r( % ) Load (%)
Figure 6 diagnostic result comparisons from volts/Hz operation
0 0.5 1 0 0.05 0.1 0.15 0.2 Cu rre n t(A) Load (%)
0 0.5 1 0 2 4 6 8 V o lt ag e( V ) Load (%) Baseline Half BRB One BRB
0 0.5 1 0 20 40 60 Po w e r( W ) Load (%)
0 0.5 1 0 1 2 3 4 Cu rre n t(% ) Load (%)
0 0.5 1 0 0.5 1 1.5 2 Vo lt a g e (% ) Load (%)
0 0.5 1 0 0.5 1 1.5 2 Po w e r( % ) Load (%)
Figure 7 diagnostic result comparisons from Sensorless operation
5.
CONCLUSION
BRB faults can be detected on sensorless mode of operation the diagnosis of BRB based on VSD. The analysis of the VSD process has understood that the sensorless control mode adjusts both supply voltage and current in order to maintain the operating speed within high accuracy. It means that any asymmetric problems with the rotor such as BRB will cause changes to current, voltage and power signals. Therefore, all of these signals can be used to diagnose BRB.
Experimental studies show that the components at twice slip frequency can be extracted more reliably in the spectrum of the power signal which contains diagnostic information of both current and voltage signals. Consequently, it produces better results in separating different BRB cases under sensorless control mode, compared with that of using either current or voltage signal.
It is shown that current signal of the faulty (BRB) case exhibits three new additional components compared to the healthy one. Two of these are the lower sideband components at the same frequency, but with different phases, and the other is the upper sideband component with a phase different from the previous two. That is why the lower sideband frequency is higher in amplitude compared to the higher one.
In addition, sensorless results: IP gives the better results in differentiating BRB because it includes the information from both current and voltage signal both of which are adjusted by the drive and especially it is possible to distinguish the faults at very low load.
6.
APPENDIX
MOTOR DATA:
Base Frequency : 50 [Hz]
Motor Voltage : 400 [V]
Motor Current : 9.2 [A]
Nameplate RPM : 1420 [RPM]
Motor Poles : 4 poles
Power : 4 [KW]
Motor Connection : star
Power Factor : 0.84
Stator Resistance : 0.9904 [Ω]
Leakage Inductance : 19.22 [mH]
Mutual Inductance : 129.49 [mH]
Rotor Time Constant : 114.81 [ms]
7.
ACKNOWLEDGMENTS
Authors express our thanks to The Directorate General of Higher Education Ministry of Education and Culture Republic of Indonesia for providing the financial support.
8.
REFERENCES
[1]. Bellini, A., et al., Advances in Diagnostic Techniques for
Induction Machines. Industrial Electronics, IEEE Transactions on, 2008. 55(12): p. 4109-4126.
[2]. Mehrjou, M.R., et al., Rotor fault condition monitoring
techniques for squirrel-cage induction machine—A review.
Mechanical Systems and Signal Processing, 2011. 25(8): p. 2827-2848.
[3]. Trzynadlowski, A.M., M. Ghassemzadeh, and S.F.
Legowski, Diagnostics of mechanical abnormalities in
[image:6.595.61.290.371.570.2]Energy Conversion, IEEE Transactions on, 1999. 14(4): p. 1417-1423.
[4]. Tavner, P.J., Review of condition monitoring of rotating
electrical machines. Electric Power Applications, IET, 2008. 2(4): p. 215-247.
[5]. Xi, Z., Sensorless Induction Motor Drive Using Indirect
Vector Controller and Sliding-Mode Observer for Electric Vehicles. Vehicular Technology, IEEE Transactions on, 2013. 62(7): p. 3010-3018.
[6]. Won Seok, O., et al. Self-tuning speed controller for
induction motor drives. in Power Electronics, Electrical Drives, Automation and Motion (SPEEDAM), 2012 International Symposium on. 2012.
[7]. Toliyat, H.A. and T.A. Lipo, Transient analysis of cage
induction machines under stator, rotor bar and end ring faults. Energy Conversion, IEEE Transactions on, 1995. 10(2): p. 241-247.
[8]. Thomson, W.T. and M. Fenger, Current signature analysis
to detect induction motor faults. Industry Applications Magazine, IEEE, 2001. vol. 7(4): p. 26-34.
[9]. F. Gu, et all., A new method of accurate broken rotor bar