A Comparative Analysis of Financial Performance of Public and Private
Sector Banks in India
* Parmod Kumar,
Assistant Professor of Commerce, Govt. College for Women, Mokhra (Rohtak) ** Harish Chander
Research Scholar, MDU Rohtak Abstract
Banks plays a vital role in the mobilization of resources by collecting funds from various sources which has surplus funds and providing credit facilities to different sectors of an economy for its development.Banks act as a lubricant for the entire monetary and financial system and ensure smooth operations. A healthy and competitive banking system can provide better services for the development of nation’s economy in today’s globalised era. Hence, it is of utmost importance that banks should generate sufficient resources to run its operations and for expansion & modernization programmes. The present study is thus undertaken to make a comparative analysis of financial performance of public and private sector banks during the period 2005-2017 with the help of ratio analysis and ANOVA. The study shows that private sector banks are performing better than their public counterparts in terms of Operating Profit to Total Assets Ratio, Profit per Employee, Return on Advances Ratio and Returns on Assets. However, public sector banks are performing better than their private sector counterparts in terms of Return on Investment Ratio. HDFC Bank is earning the highest Return on Equity and the variations in its earning are also at the lowest level.The difference between the ratios of various banks was statistically significant in all cases except in case of Return on Equity where it was statistically insignificant.
Key Words: Bank, Financial Performance, Ratio Analysis, Public Sector, Private Sector
International Research Journal of Management and Commerce
ISSN: (2348-9766)
Impact Factor 5.564 Volume 5, Issue 1, January 2018
Introduction
Banks plays a vital role in the mobilization of resources for the development of an economy. They collect the funds from public and provide credit facilities for economic development of the nation. The Indian banking system consists of 27 public sector banks, 26 private sector banks, 46 foreign banks, 56 regional rural banks, 1,574 urban cooperative banks and 93,913 rural cooperative banks, in addition to cooperative credit institutions upto 31st march, 2017. Public-sector banks control more than 70 per cent of the banking system assets, thereby leaving a comparatively smaller share for its private peers. Banks constitute the backbone of a nation’s financial system, performing manifold functions through liquidity, maturity and risk transformation. Indeed, it needs no gainsaying that the health of the economy is, in a way, the mirror reflection of the banking system, especially in bank-based financial systems. A bank is like heart of the human body and the capital it provides is akin to the blood in it. So long as the blood circulates seamlessly, the organs remain sound and healthy. However, if for any reason, the blood were not supplied to any organ, then that part would be rendered useless. Not surprisingly therefore, there is always a conscious attempt on the part of the Reserve Bank to provide adequate liquidity and credit to all productive sectors of the economy. Banks act as a lubricant for the entire monetary and financial system and ensure smooth operations. Hence, it is of utmost importance that banks should generate sufficient resources to run its operations and for expansion & modernization programmes. The present study is thus undertaken to make a comparative analysis of financial performance of public and private sector banks.
Review of Literature
Sector Banks. The performance of Private Sector Banks was somewhat better than Public Sector Banks.
Singh andTandon (2012) in their paper studied the financial performance of SBI and ICICI on the basis of selected ratios. The period of their study was 2008-2012. Credit Deposit Ratio, Interest Expenses to Total Expenses Ratio, Interest Income to Total Income Ratio, Other Income to Total Income Ratio, Net Profit Margin, Net Worth Ratio, Percentage change in Net Profit, Percentage change in Total Income, Percentage Change in Total Expenditure, Percentage Change in Deposits and Percentage change in Advances were used by the researchers to measure the financial performance of the SBI and ICICI banks. The study concluded that the customers have more trust on the public sector banks as compared to private sector banks.
Tandon, Anjum and Julee (2014) discussed the financial performance of top five public sector banks covering the period from 2009-2014. Ratio analysis was used by the researchers for measuring the financial health of the banks. It was found that PNB has the highest return on net worth and return on capital employed. State Bank of India has the highest EPS and Bank of Baroda has the highest Capital Adequacy Ratio among the sampled banks. Further SBI has highest Dividend Payout Ratio among the sampled banks.
Islam (2014) in his paper anlysed the financial performance of National Bank Limited of Bangladesh for the period 2008-13. The researcher used the financial ratio analysis and it was found that NBL achieved a worthy performance in all core areas of banking operations. The results indicate that the overall bank performance in terms of profitability, liquidity and credit performance was improved from 2008 to 2011 and then declined during 2012 and 2013. Further bank increased the size of their portfolio during the period.
Shah and Jan (2014) in their paper studied the financial performance of top ten private banks in Pakistan. ROA and interest income were taken as dependent variables with bank size, assets management and operational efficiency as the independent variables. Results showed that the ROA of the banks were strongly and negatively influenced by the bank size. Operational efficiency was negatively associated with ROA and other dependent variable i.e. interest income was strongly positively influenced by the bank size and was found statistically significant.
because large national banks were able to withstand business cycles better than regional banks. The study justified the objective of government to create bigger national level banks by merging smaller banks.
Singh andPawan (2016) in their paper studied the financial performance of PNB and HDFC banks. Various ratios like Capital Adequacy Ratio, Credit Deposit Ratio, Net Profit Ratio etc. were used by the researchers for measuring the financial performance of these banks. The study shows that PNB faces the problem to generate the income and NPAs of PNB were increasing. The study further shows that the financial performance of HDFC bank was better than PNB during the period of study.
Chandulal (2016) in his doctoral thesis made an attempt to compare the financial performance of private and public sector banks with special reference to affecting factors and their impact on performance indicators. Out of total 29 parameters studied, 10 parameters showed significant financial difference at all three levels of data analysis. Among these 10 parameters private sector banks proves superiority over public sector banks in 4 parameters while public sector banks proves superiority over private sector banks in remaining 6 parameters.
Rao and Ibrahim (2017) in their paper compared the financial performance of IDBI bank with industry’s average on the basis of financial ratios for the period 2011-2012 to 2015-16. It was found that the solvency position of IDBI Bank and the employment of assets was in tune with the industry averages. Net profit margin of IDBI Bank indicates that the profit of the bank is declining and is well below the industry averages which suggest that the operations of the bank are needed to be improved. Further, the ROA of IDBI Bank is showing a declining trend as compared to industry average.
Objectives of the Study
The present study is undertaken with the objective to compare the financial position of public sector banks and private sector banks.
Period and Scope of the Study
The present study covers the period from 2005 to 2017. Three top banks viz. State Bank of India, Bank of Baroda and Punjab National Bankfrom public sector and three top banks viz. ICICI Bank, HDFC Bank and Kotak Mahindra Bank from private sector in terms of market capitalization were taken for the present study.
Data Collection
Research Methodology
Mainly ratio analysis and ANOVA were used to compare the financial performance of the banks. The following ratios were used for the comparison:
1. Operating Profit to Total Assets 2. Profit per Employee
3. Return on Investment 4. Return on Advances 5. Return on Equity 6. Return on Assets
7. Net Interest Income to Total Assets
One way ANOVA was used to measure the difference within the returns of various banks. Hypotheses
The following hypotheses have been evaluated using one way ANOVA in the present study: H0 : There is no significant difference between ratios of Operating Profit to Total Assets of
different banks.
H0 : There is no significant difference between ratios of Profit per Employee of different
banks.
H0 : There is no significant difference between ratios of Return on Investment of different
banks. H0 : There is no significant difference between ratios of Return on Advances of
different banks. H0 : There is no significant difference between ratios of Return on Equity of
different banks.
H0 : There is no significant difference between ratios of Net Interest Income to Total Assets
of different banks. Discussion
1. Operating Profit to Total Assets Ratio
Table 1: Operating Profit to Total Assets Ratio
Year
STATE BANK OF INDIA
PUNJAB NATION
AL BANK BANK OF BAROD A
HDF C BAN K
ICICI BANK
KOTAK MAHIND RA BANK
LTD Average Std. Deviati on
2005 2.53 2.10 2.56 2.87 2.02 2.16 2.37 0.33
2006 2.37 2.15 1.84 3.17 1.86 2.52 2.32 0.50
2007 1.89 2.35 1.88 3.11 1.97 2.17 2.23 0.47
2008 2.04 2.22 1.81 3.36 2.14 2.78 2.39 0.57
2009 2.13 2.55 2.12 3.27 2.29 2.09 2.41 0.46
2010 1.82 2.70 1.95 3.17 2.62 3.92 2.70 0.78
2011 2.23 2.68 2.19 3.09 2.35 3.00 2.59 0.39
2012 2.47 2.54 2.13 3.05 2.32 2.84 2.56 0.34
2013 2.14 2.33 1.81 3.10 2.57 2.89 2.47 0.48
2014 1.91 2.21 1.54 3.22 2.93 3.01 2.47 0.68
2015 2.10 2.07 1.44 3.22 3.18 3.10 2.52 0.75
2016 1.96 1.78 1.27 3.21 3.49 2.71 2.41 0.87
2017 2.01 2.10 1.61 3.21 3.55 2.94 2.57 0.77
Average 2.12 2.29 1.86 3.16 2.56 2.78
Std. Deviatio
n 0.22 0.27 0.35 0.12 0.57 0.49
Source: RBI Publications
Table 1 show that the ratio of private sector banks is superior to public sector banks with HDFC Bank at top followed by Kotak Mahindra and ICICI Bank. The profits of HDFC Bank shows least fluctuation over the time and operating profit of ICICI Bank shows the highest fluctuations during the study period. The public sector banks are showing downward trend in long term whereas private sector banks are trying to stabilize their operating profit. Table 2 shows that the difference between the operating profits of various banks is statistically significant.
Table 2: Results of ANOVA in r/o Operating Profit to Total Assets Ratio Source of
Variation SS df MS F P-value F crit
Between Groups 14.32032074 5 2.864064147 21.07497606 6.4509E-13 2.3418275
Within Groups 9.784714249 72 0.135898809
Total 24.10503498 77
Source: Calculated from the data of Table 1 2. Profit per Employee
sector banks are performing more efficiently in comparison to public sector banks. ICICI Bank is top performer in terms of profit per employee followed by HDFC Bank whereas PNB and SBI are the worst performers among the sampled banks. Private sector banks are showing upward trend in the ratio. Wide variations are visible in the trend of profit per employee of Bank of Baroda.
Table 3: Profit per Employee Ratio
Year
STATE BANK OF INDIA
PUNJAB NATIONAL BANK
BANK OF BARODA
HDFC BANK
ICICI BANK
KOTAK MAHINDRA
BANK LTD Average Std. Deviation 2005 0.21 0.24 0.70 0.88 1.10 0.54 0.61 0.35 2006 0.22 0.25 0.21 0.74 1.00 0.42 0.47 0.33 2007 0.24 0.27 0.27 0.61 0.90 0.31 0.43 0.27 2008 0.37 0.37 0.39 0.50 1.00 0.40 0.51 0.25 2009 0.47 0.56 0.60 0.42 1.10 0.30 0.58 0.28 2010 0.45 0.73 0.80 0.60 0.90 0.70 0.70 0.16 2011 0.39 0.84 1.10 0.74 1.00 0.80 0.81 0.25 2012 0.53 0.84 1.20 0.80 1.10 0.90 0.90 0.24 2013 0.65 0.81 1.00 1.00 1.40 1.00 0.98 0.25 2014 0.49 0.50 1.00 1.20 1.40 1.00 0.93 0.37 2015 0.60 0.50 0.70 1.00 1.60 1.10 0.92 0.41 2016 0.47 -0.60 -1.00 1.50 1.40 0.70 0.41 1.03 2017 0.51 0.20 2.60 1.60 1.20 1.10 1.20 0.85
Average 0.43 0.42 0.74 0.89 1.16 0.71
Std.
Deviation 0.14 0.39 0.80 0.36 0.22 0.30
Source: RBI Publication
[image:7.595.71.538.511.624.2]Table 4 further shows that the difference between profit per employee of various banks is statistically significant.
Table 4: Results of ANOVA in r/o Profit per Employee Ratio Source of
Variation SS Df MS F P-value F crit
Between Groups 5.158331949 5 1.03166639 5.765698308 0.00015686 2.3418275
Within Groups 12.88308477 72 0.178931733
Total 18.04141672 77
Source: Calculated from the data of Table 3 3. Return on Investment Ratio
Table 5: Return on Investment Ratio
Year
STATE BANK OF INDIA
PUNJAB NATIONAL BANK
BANK OF BARODA
HDFC BANK
ICICI BANK
KOTAK MAHINDRA
BANK LTD Average Std. Deviation 2005 8.37 8.56 7.96 6.79 4.75 3.86 6.72 1.99 2006 7.77 8.79 8.05 6.84 6.05 7.19 7.45 0.96 2007 6.71 7.63 7.31 6.98 6.13 5.78 6.76 0.70 2008 7.05 7.28 6.95 7.18 7.37 8.85 7.45 0.70 2009 6.69 7.27 6.87 7.41 6.90 6.12 6.88 0.46 2010 6.20 6.46 6.43 6.78 5.77 6.72 6.40 0.37 2011 6.71 6.52 7.20 7.22 6.19 6.46 6.72 0.42 2012 7.88 7.10 8.00 7.72 6.58 6.75 7.34 0.61 2013 8.20 7.55 7.32 7.48 6.65 7.41 7.44 0.50 2014 8.52 7.50 7.32 7.77 6.63 7.54 7.55 0.61 2015 8.03 7.22 8.10 7.23 6.32 7.88 7.46 0.68 2016 8.00 7.82 9.00 8.13 6.67 8.65 8.04 0.80 2017 7.19 7.30 8.47 7.77 7.07 7.64 7.57 0.52
Average 7.49 7.46 7.61 7.33 6.39 6.99
Std.
Deviation 0.76 0.67 0.72 0.43 0.66 1.30
Source: RBI Publications
[image:8.595.70.532.54.354.2]Table 5 shows that the public sector banks are earning more returns on their investment in comparison to private sector banks. Bank of Baroda is the topper in the list followed by SBI and PNB. The ratio of ICICI Bank is the lowest among sampled banks.
Table 6: Results of ANOVA in r/o Return on Investment Ratio Source of
Variation SS df MS F P-value F crit
Between Groups 13.47935632 5 2.695871264 4.19823946 0.0021005 2.3418275
Within Groups 46.23431628 72 0.642143282
Total 59.71367259 77
Source: Calculated from the data of Table 5
Further Table 6 shows that the difference between the returns on investment of different banks is statistically significant.
4. Return on Advances Ratio
Table 7: Return on Advances Ratio
Year
STATE BANK OF INDIA
PUNJAB NATIONAL BANK
BANK OF BARODA
HDFC BANK
ICICI BANK
KOTAK MAHINDRA
BANK LTD Average Std. Deviation
2005 7.24 7.89 7.35 7.68 8.77 10.46 8.23 1.22
2006 7.62 7.91 7.31 8.91 8.59 10.40 8.46 1.12
2007 8.29 8.93 8.27 10.57 9.41 11.62 9.52 1.34
2008 9.34 9.66 8.84 12.62 10.72 13.61 10.80 1.92
2009 9.67 10.64 8.96 14.96 10.06 15.50 11.63 2.84
2010 8.62 9.77 7.88 10.77 8.70 13.51 9.88 2.05
2011 8.64 9.85 8.02 10.56 8.26 12.83 9.69 1.82
2012 9.98 10.61 8.67 11.89 9.42 14.23 10.80 2.01
2013 9.46 10.57 8.40 12.33 10.05 14.04 10.81 2.05
2014 9.09 9.84 7.69 11.68 9.99 13.15 10.24 1.93
2015 8.95 9.54 7.47 11.12 9.81 12.53 9.90 1.75
2016 8.37 8.69 7.34 10.80 9.47 13.49 9.69 2.19
2017 7.88 7.92 7.18 10.22 8.81 10.52 8.75 1.36
Average 8.71 9.37 7.95 11.08 9.39 12.76 Std.
Deviation 0.82 1.02 0.63 1.77 0.73 1.59 Source: RBI publication
[image:9.595.67.531.53.317.2]Table 7 shows that the private sector banks are utilizing their advances in more efficient way in comparison to public sector banks. The Kotak Mahindra Bank is the top performer followed by HDFC Bank. ICICI Bank and PNB are at third position. Bank of Baroda is the worst performer among the sampled banks. Further Table 8 shows that there is statistically significant difference among the returns on investment of different banks.
Table 8: Results of ANOVA in r/o Return on Advances Ratio Source of
Variation SS df MS F P-value F crit
Between Groups 199.630936 5 39.92618721 28.84807908 6.0849E-16 2.3418275
Within Groups 99.64911256 72 1.384015452
Total 299.2800486 77
Source: Calculated from the data of table 7 5. Return on Equity
Table 9: Return on Equity
Year
STATE BANK OF INDIA
PUNJAB NATIONAL BANK
BANK OF BARODA HDFC BANK ICICI BANK KOTAK MAHINDRA
BANK LTD Average Std. Deviation
2005 19.43 21.41 12.58 18.45 18.86 12.46 17.20 3.76
2006 17.04 16.41 12.28 17.74 14.33 14.58 15.40 2.04
2007 15.41 15.55 12.45 19.46 13.17 11.19 14.54 2.95
2008 16.75 18.01 14.58 17.74 11.63 11.19 14.98 3.02
2009 17.05 22.92 18.62 17.17 7.80 7.36 15.15 6.24
2010 14.80 24.12 21.86 16.30 7.96 13.29 16.39 5.88
2011 12.62 22.60 23.47 16.74 9.65 14.39 16.58 5.52
2012 15.72 19.80 20.64 18.69 11.20 14.65 16.78 3.59
2013 15.43 15.70 15.07 20.34 13.10 15.60 15.87 2.39
2014 10.03 9.75 13.36 21.28 14.02 13.82 13.71 4.16
2015 10.62 8.17 8.96 19.37 14.55 14.12 12.63 4.21
2016 7.30 -10.27 -13.48 18.26 11.43 10.97 4.03 12.86
2017 6.31 3.31 3.44 17.95 10.33 13.23 9.09 5.84
Average 13.73 14.42 12.60 18.42 12.16 12.83 Std.
Deviation 4.04 9.68 9.54 1.41 3.01 2.21 Source: RBI Publication
[image:10.595.74.554.55.316.2]Table 9 shows that the HDFC Bank is consistently generating the highest average returns on equity capital and further followed by PNB and SBI with wide deviations from year to year. The returns of public sector banks show more deviations in comparison to private sector banks. The returns of SBI and PNB are showing downward trend whereas returns of Bank of Baroda shows upward trend upto the year 2011 and thereafter shows downward trend. Further, Table 10 shows that the difference between returns on equity of different banks was statistically insignificant.
Table 10: Results of ANOVA in r/o Return on Equity Source of
Variation SS df MS F P-value F crit
Between Groups
344.555880
4 5
68.9111760 9 1.90499625 4 0.1040479 7 2.341827 5 Within Groups 2604.52201
3 72
36.1739168
4
Total
2949.07789
3 77
Source: Calculated from the data of Table 9 6. Return on Assets
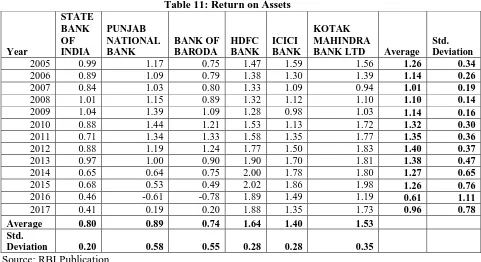
Table 11: Return on Assets Year STATE BANK OF INDIA PUNJAB NATIONAL BANK BANK OF BARODA HDFC BANK ICICI BANK KOTAK MAHINDRA
BANK LTD Average Std. Deviation
2005 0.99 1.17 0.75 1.47 1.59 1.56 1.26 0.34
2006 0.89 1.09 0.79 1.38 1.30 1.39 1.14 0.26
2007 0.84 1.03 0.80 1.33 1.09 0.94 1.01 0.19
2008 1.01 1.15 0.89 1.32 1.12 1.10 1.10 0.14
2009 1.04 1.39 1.09 1.28 0.98 1.03 1.14 0.16
2010 0.88 1.44 1.21 1.53 1.13 1.72 1.32 0.30
2011 0.71 1.34 1.33 1.58 1.35 1.77 1.35 0.36
2012 0.88 1.19 1.24 1.77 1.50 1.83 1.40 0.37
2013 0.97 1.00 0.90 1.90 1.70 1.81 1.38 0.47
2014 0.65 0.64 0.75 2.00 1.78 1.80 1.27 0.65
2015 0.68 0.53 0.49 2.02 1.86 1.98 1.26 0.76
2016 0.46 -0.61 -0.78 1.89 1.49 1.19 0.61 1.11
2017 0.41 0.19 0.20 1.88 1.35 1.73 0.96 0.78
Average 0.80 0.89 0.74 1.64 1.40 1.53
Std.
Deviation 0.20 0.58 0.55 0.28 0.28 0.35
Source: RBI Publication
[image:11.595.70.551.63.325.2]Table 11 shows that the performance of private sector banks is superior to public sector banks in terms of use of their assets in generating returns. HDFC Bank is the top performer followed by Kotak Mahindra and ICICI Bank. Bank of Baroda is the worst performer amongst the sampled banks. The long term trend of public sector banks is downward whereas the private sector banks except ICICI Bank are showing a slight upward trend during the period of study. Table 12 further reveals that the difference between return on assets of different banks is statistically significant.
Table 12: Results of ANOVA in r/o Return on Assets Source of
Variation SS df MS F P-value F crit
Between Groups 10.4339641 5
2.08679282 1
13.0525129
5 4.787E-09
2.341827 5 Within Groups
11.5111230
8 72
0.15987670
9
Total
21.9450871
8 77
Source: Calculated from the data of Table 11 7. Net Interest Income to Total Assets Ratio
Table 13: Net Interest Income to Total Assets Ratio
Year
STATE BANK OF INDIA
PUNJAB NATIONAL BANK
BANK OF BARODA
HDFC BANK
ICICI BANK
KOTAK MAHINDRA
BANK LTD Average Std. Deviation 2005 3.21 3.51 3.31 3.79 1.94 3.66 3.24 0.67 2006 3.27 3.44 3.05 4.08 2.25 4.55 3.44 0.81 2007 2.84 3.39 2.79 4.21 1.89 4.12 3.21 0.88 2008 2.64 3.06 2.42 4.66 1.96 5.08 3.31 1.27 2009 2.48 3.06 2.52 4.69 2.15 5.33 3.37 1.32 2010 2.35 3.12 2.35 4.13 2.19 5.62 3.29 1.35 2011 2.86 3.50 2.76 4.22 2.34 4.75 3.41 0.93 2012 3.38 3.21 2.56 4.19 2.40 4.31 3.34 0.80 2013 3.06 3.17 2.28 4.28 2.70 4.29 3.30 0.83 2014 2.93 3.14 1.98 4.14 2.91 4.34 3.24 0.87 2015 2.86 2.87 1.92 4.14 3.07 4.36 3.20 0.91 2016 2.60 2.41 1.84 4.15 3.11 4.63 3.12 1.07 2017 2.44 2.16 1.98 4.13 2.91 3.99 2.94 0.93
Average 2.84 3.08 2.44 4.22 2.45 4.54
Std.
Deviation 0.33 0.40 0.45 0.23 0.44 0.54
Source: RBI Publication
[image:12.595.69.529.74.350.2]Table 13 shows that the performance of Kotak Mahindra Bank is the best among the sampled banks regarding Net Interest Income to Total Assets Ratio. HDFC Bank is at second place and PNB is at third place. Bank of Baroda and ICICI Bank are at the lowest level among the sampled banks. Again public sector banks are showing downward trend whereas private sector banks are showing slightly upward trend in the ratio. Further Table 14 shows that the difference of ratios between various banks is statistically significant.
Table 14: Results of ANOVA in r/o Net Interest Income to Total Assets Ratio Source of
Variation SS df MS F P-value F crit
Between Groups 53.20516162 5 10.64103232 62.3703361 8.6268E-25 2.3418275
Within Groups 12.2839538 72 0.17061047
Total 65.48911543 77
Source: Calculated from the data of Table 13 Conclusion
References
Chandulal, G. A. (2016). A comparative study on financial performance of private and public sector banks special reference to affecting factors and their impact on performance indicators (Doctoral thesis submitted to Gujrat Technological University, Ahmedabad, India). Islam, Md. A. (2014). An analysis of the financial performance ofNational Bank Limited using financial ratio. Journal of Behavioural Economics, Finance, Entrepreneurship, Accounting and Transport, 2(5), 121-129. DOI: 10.12691/jbe-2-5-3
Kumar, M., Kumar, A., &Duhan, P. K. (2012). Labour efficiency of public and private sector banks operating in India: A comparative study. International Journal of Language, Education and Social Sciences, 2(1), 88-95. Retrieved from www.ijless.com
Nagarkar, J. J. (2015). Analysis of Financial Performance of Banks in India. Annual Research Journal of Symbiosis Centre for Management Studies,Pune, 3, 26-37.
Nathwani, N. (2004). The study of financial performance of banking sector of India (Doctoral
thesis, Saurashtra University, India). Retrieved from
http://etheses.saurashtrauniversity.edu/id/eprint/54
Rao, K. P. V., & Ibrahim, F. (2017). Financial performance analysis of banks – A study ofIDBI Bank. International Journal of Research in IT and Management, 7(1), 64-72. Retrieved from http://euroasiapub.org
Reserve Bank of India. (2017). Statistical Tables Relating to Banks in India (STRBI) 2016-17 and Other Tables, 2016-17. Retrieved from https://rbi.org.in
Shah, S. Q., & Jan, R. (2013). Analysis of financial performance of private banks in Pakistan. Paper presented in 2nd World Conference on Business, Economics and
Management-WCBEM2013. Retrieved from www.sciencedirect.com
Singh, A. B., &Tandon, P. (2012). A study of financial performance: A comparative analysis of SBI and ICICI Bank. International Journal of Marketing, Financial Services &
Management Research, 1(11), 56-71. Retrieved from www. Indianresearchjournals.com
Singh, B., &Pawan. (2016). Financial performance: A comparative analysis study of PNB and HDFC Bank. International Journal of Marketing & Financial Management, 4(2), 47-60. Retrieved from www.arseam.com