ogy, Engineering, and Mathematics Education. Psychol Sci. ISSN 1467-9280 DOI: https://doi.org/10.1177/0956797617741719
Link to Leeds Beckett Repository record:
http://eprints.leedsbeckett.ac.uk/4753/
Document Version: Article
The aim of the Leeds Beckett Repository is to provide open access to our research, as required by funder policies and permitted by publishers and copyright law.
The Leeds Beckett repository holds a wide range of publications, each of which has been checked for copyright and the relevant embargo period has been applied by the Research Services team.
We operate on a standard take-down policy. If you are the author or publisher of an output and you would like it removed from the repository, please contact us and we will investigate on a case-by-case basis.
Note: This is an earlier pre-print version. For the final proof-corrected version, please visit the Psychological Science website.
The gender equality paradox in STEM education
Gijsbert Stoet1 & David C. Geary21) Corresponding author (stoet@gmx.com),School of Social Sciences, Leeds Beckett University, Leeds, UK ; 2) Department of Psychological Sciences, University of Missouri, Columbia, Missouri
Abstract
The underrepresentation of girls and women in science, technology, engineering, and
mathematics (STEM) is a continual concern for social scientists and policy makers. Using an international database on adolescent achievement in science, mathematics, and reading (n = 472,242), we show girls performed similarly or better than boys in science in two of every three countries, and in nearly all countries, more girls appeared capable of college-level STEM study than enrolled. Paradoxically, the sex differences in the magnitude of relative academic strengths and pursuit of STEM degrees increased with increases in national gender equality. The gap between boys’ science achievement and girls’ reading achievement relative to their mean academic performance was near universal. These sex differences in academic strengths and attitudes toward science correlated with the STEM graduation gap. A mediation analysis suggests that life-quality pressures in less gender equal countries promote girls’ and women’s engagement with STEM subjects.
Introduction
The underrepresentation of girls and women in science, technology, engineering, and mathematics (STEM) is a world-wide phenomenon (Burke & Mattis, 2007; Ceci, Williams, & Barnett, 2009; Ceci & Williams, 2011; Cheryan, Ziegler, Montoya, & Jiang, 2017). Although women are now well represented in the social and life sciences (Ceci, Ginther, Kahn, & Williams, 2014; Su & Rounds, 2016), they continue to be underrepresented in fields that focus on inorganic phenomena (e.g., computer science). Despite considerable efforts toward
understanding and changing this pattern, the sex difference in STEM engagement has remained stable for decades (e.g., in the USA, National Science Foundation, 2017). The stability of these differences and the failure of current approaches to change them calls for a new perspective on the issue.
engagement in STEM education and occupations. We find that countries with high levels of gender equality have some of the largesst STEM gaps in secondary and tertiary education; we call this the educational gender equality paradox. For example, Finland excels in gender equality (World Economic Forum, 2015), its adolescent girls outperform boys in science literacy, and it ranks second in European educational performance (OECD, 2016a). With these high levels of educational performance and overall gender equality, Finland is poised to close the STEM gender gap. Yet, paradoxically, Finland has one of the world’s largest gender gaps in college degrees in STEM fields, and Norway and Sweden, also leading in gender equality rankings, are not far behind (fewer than 25% of STEM graduates are women). We will show that this pattern extends throughout the world, whereby the graduation gap in STEM increases with increasing levels of gender equality.
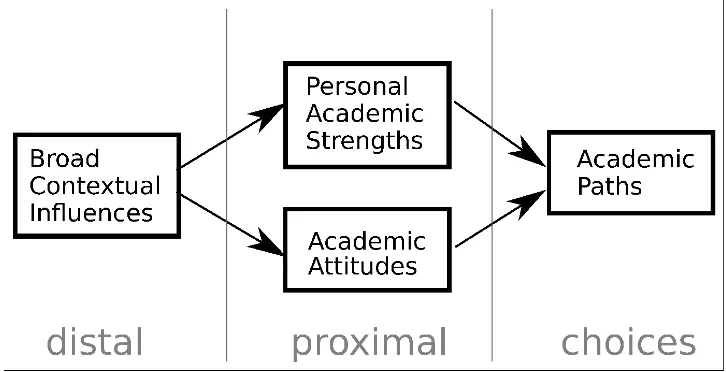
[image:3.612.133.496.365.551.2]We propose that the educational gender equality paradox is driven by two different processes, one based on distal social factors and the other on more proximal factors. The latter is student’s own rational decision making based on relative academic strengths and weaknesses as well as attitudes that can be influenced by distal factors (Figure 1).
Figure 1: Schematic illustration of the factors influencing educational and occupational choices. Distal factors, such as relatively poor living conditions might influence the development of personal academic strengths and attitudes toward different academic fields, which in turn result in choices individuals make in secondary education, tertiary education, and occupations.
educational gender equality paradox is inspired by the expectancy value theory (Eccles, 1983; Wang & Degol, 2013). On the basis of this theory, it is hypothesized that students use their own relative performance (e.g., knowledge of what subjects they are best at) as a basis for decisions about further educational and occupational choices, and this has been demonstrated for STEM-related decision making in the US (Wang, Eccles, & Kenny, 2013). The basic idea that
individuals choose academic paths based on perceived individual strength is reflected in common practice by school professionals: When students have the opportunity to choose their coursework in secondary education, they are typically recommended to make choices based on their strengths and enjoyment (e.g., Gardner, 2016; Universities and Colleges Admissions Service [UCAS], 2015).
Wider social factors may influence engagement in STEM through students’ utility beliefs or the expected long-term value of an academic path (Eccles, 1983; Wang & Degol, 2013). The assessment of social factors that might influence STEM engagement is best done comparing countries that vary widely in the associated costs and benefits of a STEM career. One possibility is that contexts with fewer economic opportunities and higher economic risks may make relatively high paying STEM occupations more attractive relative to contexts with greater opportunities and lower risks. This may contribute to the educational gender equality paradox, because economic and general life risks are lower in gender equal countries which in turn results in greater opportunity for individual interests and academic strengths to influence investment in one academic path or another, as demonstrated by Wang et al. (2013) for the US.
In analyses of the academic achievement of almost 475,000 adolescents across 67 nations or economic regions, we show that girls and boys have similar abilities in science literacy in most nations. At the same time, using a novel approach for examining intra-individual
differences in academic strengths and relative weaknesses, we also show that science or mathematics are much more likely to be a personal academic strength for boys than girls. We then show that the relation between the sex differences in academic strengths and college graduation rates in STEM fields become larger in more gender equal countries. A mediation analysis suggests the latter is related to overall life satisfaction that in turn is related to income and economic risk in less developed countries (Pittau, Zelli, & Gelman, 2010).
Method
Programme for International Student Assessment (PISA)
science literacy, reading comprehension, and mathematics are conducted every three years, and in each cycle, one of these domains is studied in depth. In 2015, the focus was on science literacy, which included additional questions about science learning and attitudes (see below). We used this most recent dataset, in which 519,334 students from 71 nations and regions participated. In order to prevent double-counting of samples, we excluded regions for which we also had national data (US states of Massachusetts and North Carolina, several Spanish regions, and Buenos Aires, because we had data from the US, Spain, and Argentina as a whole); this exclusion resulted in a sample of 472,242 in 67 nations/regions (Table S1), which represents 25,141,223 students (i.e., the sum of weights provided by PISA for each student). Our dataset included the following regions: Hong Kong, Macao, Chinese Taipei, and the Chinese provinces of Beijing, Shanghai, Jiangsu, and Guangdong (i.e., these 4 Chinese provinces were combined into one sub-dataset by PISA).
The PISA organizers selected a representative sample of schools and students in each participating country or region. Participating students were between 15 years and 3 months and 16 years and 2 months old. Each participating student completed a 2 hour PISA test that assessed how well they can apply their knowledge in the domains of reading comprehension,
mathematics, and science literacy. The same (translated) test material was used in each country.
PISA uses a well-developed statistical framework to calculate scores for science literacy, mathematics, reading comprehension and numerous other variables related to student attitudes and socioeconomic factors (OECD, 2016b). The scores of each student in each academic domain are scaled such that the average of students in OECD (Organization for Economic Cooperation and Development) countries is 500 points and the standard deviation is 100 points.
[their] own’, or ‘couldn’t do this’. Students’ responses were used to create the index of science self-efficacy.” (OECD, 2016a, p. 284).
To assess broad interest in science, “Students reported on a five-point Likert scale with the categories ‘not interested’, ‘hardly interested’, ‘interested’, ‘highly interested’, and ‘I don’t know what this is’, their interest in the following topics: biosphere (e.g. ecosystem services, sustainability); motion and forces (e.g. velocity, friction, magnetic and gravitational forces); energy and its transformation (e.g. conservation, chemical reactions); the Universe and its history; how science can help us prevent disease.” (OECD, 2016a, p. 284).
Enjoyment of science was assessed using the questions “I generally have fun when I am learning <broad science> topics; I like reading about <broad science>; I am happy working on <broad science> topics; I enjoy acquiring new knowledge in <broad science>; and I am interested in learning about <broad science>.” (OECD, 2016a, p. 284); different science topics were inserted in <broad science> across questions.
In order to estimate whether a student would, in principle, be capable of study in STEM, we used a proficiency level of at least 4 (of 6 possible) in science, mathematics, as well as reading comprehension. For science literacy for instance and according to the PISA guidelines, "At Level 4, students can use more complex or more abstract content knowledge, which is either provided or recalled, to construct explanations of more complex or less familiar events and processes. They can conduct experiments involving two or more independent variables in a constrained context. They are able to justify an experimental design, drawing on elements of procedural and epistemic knowledge. Level 4 students can interpret data drawn from a moderately complex data set or less familiar context, draw appropriate conclusions that go beyond the data and provide justifications for their choices" (OECD, 2016a, p.60). We believe that level 4 would be a minimal requirement; "At Level 3, students can draw upon moderately complex content knowledge to identify or construct explanations of familiar phenomena. In less familiar or more complex situations, they can construct explanations with relevant cueing or support. They can draw on elements of procedural or epistemic knowledge to carry out a simple experiment in a constrained context. Level 3 students are able to distinguish between scientific and non-scientific issues and identify the evidence supporting a scientific claim." (OECD, 2016a, p.60).
STEM Degrees
The United Nations Educational, Scientific and Cultural Organization (UNESCO) reports national statistics on, among other things, education. We used the UNESCO graduation data (available via http://data.uis.unesco.org) labelled "Distribution of tertiary graduates" in the years 2012-2015 in Natural Sciences, Mathematics, Statistics, Information & Communication Technologies, Engineering, Manufacturing, and Construction (Table S1). The percentage of women among STEM graduates ranged from 12.4% in Macao to 40.7% in Algeria; the median was 25.4%.
Gender Equality
The World Economic Forum publishes The Global Gender Gap Report annually. We used the 2015 data (World Economic Forum, 2015). For each nation, the Global Gender Gap Index (GGGI) indexes the degree to which girls and women fall behind boys and men on 14 key indicators (e.g., earnings, tertiary enrollment ratio, life expectancy, seats in parliament) on a 0.0 to 1.0 scale, with 1.0 representing complete parity (or men falling behind). For the countries participating in the 2015 PISA, GGGI scores ranged from 0.593 for the United Arab Emirates to 0.881 for Iceland (Table S1).
Overall life satisfaction
We took the overall life satisfaction (OLS) score from the United Nations Development Programme (2016, p.250-253). The OLS question was formulated as follows: "Please imagine a ladder, with steps numbered from zero at the bottom to ten at the top. Suppose we say that the top of the ladder represents the best possible life for you, and the bottom of the ladder represents the worst possible life for you. On which step of the ladder would you say you personally feel you stand at this time, assuming that the higher the step the better you feel about your life, and the lower the step the worse you feel about it? Which step comes closest to the way you feel?". This score was expressed on a scale from 0 (least satisfied) to 10 (most satisfied) (M=6.2, SD=0.9, ranging from 4.1 in Georgia to 7.6 in Switzerland and Norway).
Analyses
compare each subject score to the calculated average score. In order to make such calculations possible, we standardized data first. In other words, we scaled the data into a common format, namely z-scores, which have a mean of 0 and a standard deviation of 1.
We calculated each students’ relative strengths in mathematics, science literacy, and reading comprehension using the following steps:
1. We standardized the mathematics, science, and reading scores on a nation-by-nation basis. We call these new standardized scores zMath, zRead, and zScience.
2. We calculated for each student the standardized average score of the new z-scores and we call this zGeneral.
3. Then, we calculated for each student their intra-individual strengths by subtracting zGeneral as follows: relativeSciencestrength = zScience - zGeneral, relativeMathstrength = zMath - zGeneral, relativeReadingstrength = zReading – zGeneral.
4. Finally, using these new intra-individual (relative) scores, we calculated for each country the averages for boys and girls and subtracted those to calculate the gender gaps in relative academic strengths.
To illustrate, one US student had the following 3 PISA scores for science, mathematics, and reading: 364, 411, and 344, respectively. After standardization (step 1), these scores were zScience = -1.39, zMath = -0.69, and zRead = -1.61. The student's zGeneral was -1.27 (step 2). His relative strengths were calculated by subtracting zGeneral from the standardized scores, and then again standardizing the difference scores (because they are by definition not standardized). Using this calculation, his relative scores were as follows: relativeSciencestrength = -0.71, relativeMathstrength = 2.23, and relativeReadingstrength = -1.34 (step 3). Note that although this student's scores in all three subjects are below the standardized national mean (i.e., 0), his personal strength in mathematics deviates more than 2 standard deviations from the national mean of relative mathematics strengths. In other words, the gap between his mathematics score and his overall mean score is much larger (> 2 SDs) than is typical for US students. Using these types of scores, we could calculate the intra-individual sex differences for science, mathematics, and reading for the US (and similarly for all other nations/regions).
Further, we calculated for each student the difference between actual science
performance and science self-efficacy (i.e., self-perceived ability). For this, we used the same method as reported elsewhere (Stoet, Bailey, Moore, & Geary, 2016, p. 10): For each
difference for the students of each country separately. The resulting score is a measure of the degree to which science self-efficacy is unrepresentative of actual performance (i.e.,
underestimation of own ability or exaggeration of own ability).
For correlations, we typically applied Spearman’s rho (correlation coefficient
abbreviated as rs), because not all variables were normally distributed. Throughout all analyses,
we used an alpha criterion of 0.05.
Results
Sex Differences in Science Literacy
For each of the 67 countries/regions participating in the 2015 PISA, we first tested for sex differences in science literacy (i.e., average score of boys – average score of girls, by country, Figure 2A). We found that girls outperformed boys in 19 (28.4%) countries, boys outperformed girls in 22 (32.8%) countries, and no statistically significant difference was found in the remaining 26 (38.8%) countries. The mean national effect size (Cohen’s d) was -0.01 (SD = 0.13, CI=[ -0.04 , 0.02 ] ), ranging between d = -0.46 (CI = [-0.50,-0.41]) in favor of girls (in Jordan) and d = 0.26 (CI = [ 0.21 , 0.31 ]) in favor of boys (in Costa Rica). The relation between the effect size of the absolute science gap and gender equality (GGGI) was not statistically significant (rs = .23, CI = [-.18,.46], p = .069, n = 62).
Sex differences in Academic Strengths
As we previously reported for reading and mathematics (Stoet & Geary, 2015), there were consistent sex differences in intra-individual academic strengths across reading and science. In all countries except for Lebanon and Romania (97% of countries), boys’ intra-individual strength in science was (significantly) larger than that for girls (Figure 2B). Further, in all countries, girls' intra-individual strength in reading was larger than that of boys, while boys’ intra-individual strength in mathematics was larger than that of girls. In other words, the sex differences in intra-individual academic strengths were near universal. The most important and novel finding here is that the sex difference in intra-individual strength in science was higher and favored boys in more gender-equal countries, rs = .42, CI = [.19 , .61] , p < 0.001, n = 62, (Figure
Figure 2: Sex differences in PISA science, mathematics, and reading scores expressed as Cohen's d (see Table S2 for CIs). Sex differences are calculated as the scores of boys minus scores of girls. Thus, negative values indicate an advantage of girls and positive values an advantage of boys. A: Sex differences in absolute PISA scores. B: Sex differences in intra-individual scores.
51% reading. The corresponding values for boys were 38% science, 42% mathematics, and 20% reading.
Thus, despite national averages that indicate boys’ performance was consistently higher in science than that of girls relative to their personal mean across academic areas, there were substantial numbers of girls within nations that performed relatively better in science than in other areas. Within Finland and Norway, two countries with large overall sex differences in the intra-individual science gap and very high GGGI scores, there were 24% and 18% of girls who had science as their personal academic strength, respectively; relative to 37% and 46% of boys.
Finally, it should also be noted that the difference between the percentage of girls with a strength in science or mathematics was always equally large or larger than the percentage of women graduating in STEM; importantly, again this difference was larger in more gender equal countries (rs = .41, CI = [ .15 , .62 ] , n = 50, p = .003). In other words, more gender equal
[image:11.612.72.540.369.623.2]countries were more likely than less gender equal countries to lose those girls from an academic STEM track who are most likely to choose it based on personal academic strengths.
women and men. Blue lines indicate the regressions. A: The gender gap in intra-individual science scores was larger in more gender equal countries (rs = .42). B: The
percentage of women with degrees in STEM fields was lower in more gender equal countries (rs = -.47).
The above analyses show that most boys scored relatively higher in science than their all-subject average, and most girls scored relatively higher in reading than their all-subject average. Thus, even when girls outperformed boys in science, as was the case in Finland, girls generally performed even better in reading, which means that their individual strength was, unlike boys, reading. The relevant finding here is that the intra-individual sex differences in relative strengths in science and reading increased with increases in gender equality (GGGI). In accordance with expectancy value theory, this pattern should result in far more boys than girls pursuing a STEM career in more gender equal nations, and this was the case (rs = -.47, n = 50, p
< .001, CI = [ -.66 , -.22 ], Figure 3B). And, similarly, girls will be more likely than boys to choose options in which they can gain the most benefit from their relative strength in reading.
Science Attitudes and Gender Equality
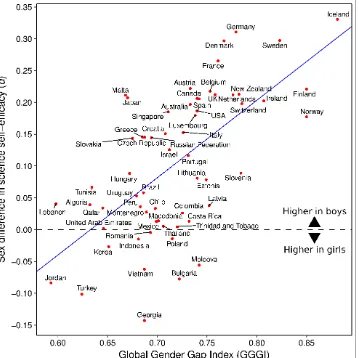
Next, we considered sex differences in science attitudes, namely science self-efficacy, broad interest in science, and enjoyment of science. Boys’ science self-efficacy was higher than that of girls in 39 of 67 (58%) countries, and especially so in more gender equal countries, rs = .
60, CI=[ .41 , .74 ], n = 61, p < .001 (Figure 4). Similarly, boys expressed a stronger broad interest in science than girls in 51 (76%) countries, and again this was particularly true in more gender equal countries (rs = .41, CI=[ .15 , .62 ], n = 50, p = .003). And finally, the same was
found for students' enjoyment of science; boys reported more joy in science than girls in 29 (43%) countries, and more so in gender equal countries, rs = .46, CI=[ .23 , .64 ], n = 61, p < .
001. Further, these attitude gaps were correlated with the intra-individual science gap (self-efficacy: rs = .24, CI=[ -0.00 , 0.46 ], n = 66, p = .052; enjoyment of science: rs = .31, CI=[ .07 , .
Figure 4. Sex differences in science self-efficacy (y-axis) increase with increases in the global gender gap index (x-axis).
Science self-efficacy is relatively weakly correlated with science performance (across participating nations, r=.17, n = 472,242, CI=[ .16 , .18 ] , p<.001). This means that the deviation between science self-efficacy and science performance is of interest (e.g., students might under or overestimate their own performance, and this could influence later choices). We calculated for each student the difference between standardized science self-efficacy scores and standardized science performance scores (this is a measure of the component of self-efficacy that is
independent from actual performance, see Method). Using this metric, we found that in 34 (49%) countries, boys overestimated their science self-efficacy and deviated significantly from girls, in comparison to 5 (7%) countries where girls overestimated their science self-efficacy and
countries in which there was no sex difference the estimation of science competence (M=0.697, SD=0.04), t(54)=2.66, p=.010.
Next, we used the science performance data and attitude data (broad interest in science and enjoyment of science) to determine the percentage of female students who, in principle, could be successful in tertiary education in STEM. For this, we defined suitability as follows: A student would need to have at least proficiency level 4 in all three PISA domains (science, mathematics, and reading, see Method). Using these ability criteria, we would expect far more women among STEM graduates (international mean = 49%, SD = 4) than are actually found in any country (international mean = 28%, SD = 6 , Figure 5A). In regard to attitudes, we assumed that they should at least have the international median level of enjoyment science, interest in science, and science self-efficacy. Using these additional criteria, the percentage of girls likely to enjoy, feel capable, and be successful in tertiary STEM programs is still considerably higher in every country (international mean = 41%, SD = 6), except Tunisia, than is actually found (Figure 5B).
As argued above, we believe that factors other than attitude and motivation play a role – namely personal academic strengths. When we add this factor to our estimate (Figure 5C), we see that the difference between expected and actual STEM graduates becomes smaller
[image:14.612.76.543.449.647.2](international mean = 34%, SD = 6), although it is still the case that in most countries women’s STEM graduation rates are lower than we would anticipate (see Discussion).
and actual (vertical) average graduation percentage of women in STEM. For instance, in the last panel we estimate 34% of women will graduate college with a STEM degree (internationally) but only 28% did so. Identity lines (i.e., 45° lines) are colored blue; points above the identity lines indicate fewer women STEM graduates than expected. A: The y-axis displays the percentage of girls among students who are estimated to choose STEM based on ability alone (see text for criteria). Although there was considerable cross-cultural variation, on average around 50% of students graduating in STEM could be women, which deviates considerably from the actual percentage of women among STEM graduates (x-axis). B: The estimate of women STEM students (y-axis) is based on both ability (as in panel A) and being above the international median score in science attitudes . C: This estimate is based on ability, attitudes, as well as having either mathematics or science as a personal strength.
Mediation Model
Thus far, we have shown that the sex differences in STEM graduation rates and in science literacy as an academic strength become larger with gains in gender equality and that schools prepare more girls for further STEM study than actually obtain a STEM college degree.
We will now consider one of the factors that might explain why the graduation gap may be larger in the more gender-equal countries. Countries with the highest gender equality tend to be welfare states (to varying degrees) with a high level of social security for all its citizens; in contrast, the less gender-equal countries have less secure and more difficult living conditions, likely leading to lower levels of life satisfaction (Pittau et al., 2010). This may in turn influence one’s utility beliefs about the value of science and pursuit of STEM occupations, given these occupations are relatively high paying and thus provide the economic security that is less certain in countries that are low in gender equality. We used overall life satisfaction (OLS) as a measure of overall life circumstances; this is normally distributed and is a good proxy for economic opportunity and hardship and social- and personal-wellbeing (Pittau et al., 2010).
In more equal countries, overall life satisfaction was higher (rs=.55, , CI = [ .35 , .70 ], p< .001, n=62). Accordingly, below we test whether low prospects for a satisfied life may be an incentive for girls to focus more on science in school and, as adults, choose a career in a
relatively higher paid STEM field.
life satisfaction for STEM graduation (mean indirect effect = -0.19, SE = 0.08, Sobel’s z= -2.24, p<.025, CI of bootstrap samples = [-0.39 , -0.04]). The effect of the direct path in the mediation model is statistically significant (mean direct effect = -0.34, SE =0.135, CI of bootstrap samples = [ -0.65 , -0.02], p=.038), and the mediation is considered partial (proportion mediated is 0.35, CI = [0.06, 0.95], p=.013, Table S3). A sensitivity analysis of this mediation (Imai, Keele, & Tingley, 2010; Tingley, Yamamoto, Hirose, Keele, & Imai, 2014) showed the point at which the average causal mediation effect (ACME) is approximately zero (ρ= -0.4, CI=[-.11,0.15], R2∗M¿RY
2∗¿¿ ¿
= 0.16 , RM
2∗¿RY 2∗¿¿
¿= 0.07; Figure S1). The latter suggests that an unknown 3rd variable may possibly
confound the mediation model (see Discussion).
Discussion
Using the most recent and largest international database on adolescent achievement, we confirmed that girls performed similarly or better than boys on generic science literacy tests in most nations. At the same time, women obtained fewer college degrees in STEM disciplines than men in all assessed nations, although the magnitude of this gap varied considerably. Further, our analysis suggests that the percentage of girls who would likely be successful and enjoy further STEM study was considerably higher than the percentage of women graduating in STEM, implying that there is a loss of female STEM capacity between secondary and tertiary education.
One of the main findings of this study is that, paradoxically, countries with lower levels of gender equality had relatively more women among STEM graduates than did more gender equal countries. This is a paradox, because gender-equal countries are those that give girls and women more educational and empowerment opportunities, and generally promote girls’ and women’s engagement in STEM fields (e.g., Williams & Ceci, 2015).
In our explanation of the paradox, we focused on decisions that individual students may make, and decisions and attitudes that are likely influenced by broader socioeconomic
considerations. On the basis of expectancy value theory (Eccles, 1983; Wang & Degol, 2013), students should at least in part base educational decisions on their academic strengths.
Independent of absolute levels of performance, boys on average had personal academic strengths in science and mathematics, and girls in reading comprehension. Thus, even when girls’ absolute science scores were higher than those of boys, as in Finland, boys were often better in science relative to their overall academic average. Similarly, girls might have scored higher than boys in science, but they were often even better in reading. Critically, the magnitude of these sex
differences in turn may contribute, for instance, to parental beliefs that boys are better at science and mathematics than girls (Eccles & Jacobs, 1986; Gunderson et al., 2012).
We also found that boys often expressed higher self-efficacy, more joy in science and a broader interest in science than girls. These differences were also larger in more gender equal countries, and were related to the students’ personal academic strength. We discuss some implications below (Interventions).
Explanations
We propose that when boys are relatively better in science and mathematics while girls are relatively better at reading than other academic areas, there is the potential for substantive sex differences to emerge in STEM-related educational pathways. The differences are expected based on expectancy value theory and are consistent with prior research (Eccles, 1983; Wang & Degol, 2013). The differences emerge from a seemingly rational choice to pursue academic paths that are a personal strength, which also seems to be common academic advice given to students, at least in the UK (e.g., Gardner, 2016; UCAS, 2015).
The greater realization of these potential sex differences in gender equal nations is the opposite of what some scholars might expect intuitively, but is consistent with findings for some other cognitive and social sex differences (e.g., Lippa et al., 2010; Pinker, 2008; Schmitt, 2015). One possibility is that the liberal mores in these cultures, combined with smaller financial costs of foregoing a STEM path (below), amplify the influence of intra-individual academic strengths. The result would be the differentiation of the academic foci of girls and boys during secondary education and later in college, and across time increasing sex differences in science as an academic strength and in graduation with STEM degrees.
is possible that a third variable could be associated with OLS and the STEM graduation gap. A related limitation is that the sensitivity analysis does not explore confounders that may be related to the predictor variable (i.e., GGGI). Future research that includes more potential confounders is needed, but are currently unavailable for many of the countries included in our analysis.
Relation to previous studies of gender equality and educational outcomes
Our current findings agree with previous studies in that sex differences in mathematics and science performance vary strongly between countries, although we also believe that the link between measures of gender equality and these educational gaps (e.g., as demonstrated by Guiso, Monte, Sapienza, & Zingales, 2008; Hyde & Mertz, 2009; Else-Quest, Hyde, & Linn, 2010; Reily, 2012) can be difficult to determine and is not always found (Ellison & Swanson, 2010; for an in depth discussion, see Stoet & Geary, 2015).
We believe that one factor contributing to these mixed results is the focus on sex
differences in absolute performance, as contrasted with sex differences in academic strengths and associated attitudes. As we have shown, if absolute performance, interest, joy, and self-efficacy alone were the basis of choosing a STEM career, we would expect to see more women entering STEM career paths than do so (Figure 5).
It should be noted that there are careers that are not STEM by definition, although they often require STEM skills. For example, university programs related to health and health care (e.g., nursing and medicine) have a majority of women. This may partially explain why even fewer women than we estimated, with obvious STEM ability and interest, pursue a college degree in STEM.
Interventions
Our results indicate that achieving the goal of parity in STEM fields will take more than improving girls’ science education and raising overall gender equality. The generally overlooked issue of intra-individual differences in academic competencies and the accompanying influence on one’s expectancies of the value of pursuing one type of career versus another need to be incorporated into approaches for encouraging more women to enter the STEM pipeline. In particular, high achieving girls whose personal academic strength is science or mathematics might be especially responsive to STEM-related interventions.
economic and life-risk issues are the only factors that influence the sex difference in the STEM pipeline. We are confirming the importance of the former (Wang et al., 2013) and showing that the extent to which these sex differences manifest varies consistently with wider social factors, including gender equality and life satisfaction. In addition to placing the STEM-related sex differences in broader perspective, the results provide novel insights into how girls’ and women’s participation in STEM might be increased in gender equal countries.
References
Burke, R.J., & Mattis, M.C. (2007). Women and minorities in science, technology, engineering, and mathematics: upping the numbers. Cheltenham, UK: Edward Elgar Publishing Limited.
Ceci, S. J., Ginther, D. K., Kahn, S., & Williams, W.M. (2014). Women in Academic Science: A Changing Landscape. Psychological Science in the Public Interest, 15(3), 75-141.
Ceci, S.J. & Williams, W. M. (2011). Understanding current causes of women's underrepresentation in science.
PNAS, 108(8), 3157-3162.
Ceci, S.J., Williams, W. M., & Barnett, S.M. (2009). Women’s underrepresentation in science: Sociocultural and biological considerations. Psychological Bulletin, 135(2), 218-261.
Cheryan, S., Ziegler, S. A., Montoya, A. K., Jiang, L. (2017). Why Are Some STEM Fields More Gender Balanced Than Others? Psychological Bulletin, 143, 1-35.
Eccles, J. (1983). Expectancies, values, and academic behaviors. In J. T. Spence (Ed.), Achievement and
achievement motives: Psychological and sociological approaches (pp. 75-146). San Francisco, Ca: Free man.
Eccles, J. & Jacobs, J.E. (1986). Social forces shape math attitudes and performance. Signs, 11(2), 367-380. Ellison, G. & Swanson, A. (2010). The gender gap in secondary school mathematics at high achievement levels.
Journal of Economic Perspectives, 28, 109-128.
Else-Quest, N.M., Hyde, J.S., & Linn, M.C. (2010). Cross-national patterns of gender differences in mathematics: A meta-analysis. Psychological Bulletin, 136(1), 103–127.
Gardner, A. (2016). How important are GCSE choices when it comes to university? London, UK: Which? Retrieved from http://university.which.co.uk/advice/gcse-choices-university/how-important-are-gcse-choices-when-it-comes-to-university.
Guiso, L., Monte, F., Sapienza, P., & Zingales, L. (2008). Culture, gender, and math. Science, 320(5880), 1164– 1165.
Gunderson, E.A., Ramirez, G., Levine, S.C., & Beilock, S.L. (2012). The role of parents and teachers in the development of gender-related math attitudes. Sex Roles, 66, 153-166.
Hyde, J.S., & Mertz, J.E. (2009). Gender, culture, and mathematics performance. Proceedings of the National Academy of Sciences of the United States of America, 106(22), 8801–8807.
Imai, K, Keele, L., & Tingley, D. (2010). A general approach to causal mediation analysis. Psychological Methods, 15, 309-334.
Lippa, R.A., Collaer, M.L, & Peters, M. (2010). Sex Differences in Mental Rotation and Line Angle Judgments Are Positively Associated with Gender Equality and Economic Development Across 53 Nations. Archives of Sexual Behavior, 39(4), 990-997.
National Science Foundation , 2017. Women, Minorities, and Persons with Disabilities in Science and Engineering: 2017. Special Report NSF 17-310. Arlington, VA: National Center for Science and Engineering
Statistics.
OECD (2016a). PISA 2015 Results (Volume 1). Paris: OECD Publications.
OECD (2016b). PISA 2015 Assessment and Analytical Framework. Paris: OECD Publications.
Pinker, S. (2008). The sexual paradox: Men, women and the real gender gap. New York, NY: Simon and Schuster. Pittau, M. G., Zelli, R., & Gelman, A. (2010). Economic disparities and life satisfaction in European regions. Social
Indicators Research, 96(2), 339-361.
Reilly, D. (2012). Gender, culture, and sex-typed cognitive abilities. PLoS ONE, 7, e39904.
Schmitt, D.P. (2015). The evolution of culturally-variable sex differences. Men and women are not always different, but when they are…It appears not to result from patriarchy or sex role socialization. In T.K. Shackelford & R.D. Hansen (Eds), The evolution of sexuality (221-256). London: Springer.
Stoet, G. & D. C. Geary. (2015). Sex differences in academic achievement are not related to political, economic, or social equality. Intelligence, 48, 137-151.
Stoet, G., Bailey, D.H., Moore, A.M, & D. C. Geary (2016). Countries with Higher Levels of Gender Equality Show Larger National Sex Differences in Mathematics Anxiety and Relatively Lower Parental Mathematics Valuation for Girls. PLOS ONE, 11(4): e0153857.
Su, R. & Rounds, J. (2016). All STEM Fields Are Not Created Equal: People and Things Interests Explain Gender Disparities across STEM Fields. Frontiers in Psychology, 6 (189), 1-20.
Tingley, D., Yamamoto, T., Hirose, K., Keele, L., & Imai, K. (2014). Mediation: R Package for Causal Mediation Analysis. Journal of Statistical Software, 59 (5), 1-37.
Universities and Colleges Admissions Service (UCAS)(2015). Tips on choosing A Level subjects. Retrieved from https://www.ucas.com/sites/default/files/tips_on_choosing_a_levels_march_2015_0.pdf
United Nations Development Programme (2016). Human Development Report 2016. New York, NY: Palgrave Macmillan.
Wang, M. & Degol, J. (2013). Motivational pathways to STEM career choices: Using expectancy-value perspective to understand individual and gender differences in STEM fields. Developmental Review, 33, 304-340. Wang, M., Eccles, J.S., & Kenny, S. (2013). Not Lack of Ability but More Choice : Individual and Gender
Differences in Choice of Careers in Science, Technology, Engineering, and Mathematics. Psychological Science, 24(5), 770-775.
Williams, W.M. & Ceci, S.J. (2015). National hiring experiments reveal 2:1 faculty preference for women on STEM tenure track. Proceedings of the National Academy of Sciences, 112(17), 5360-5365.