56 www.eymj.org
INTRODUCTION
The long-term survival of patients with a univentricular heart has dramatically improved with the development and evolu-tion of Fontan-type surgery. However, after a Fontan operaevolu-tion,
patients face substantial risks of complications that may be associated with inefficient circulation inherent to different types of Fontan circulation: atriopulmonary connection (APC), lat-eral tunnel (LT), and extracardiac conduit (ECC).1 Fontan con-version from an APC to a LT or ECC circuit has been proposed to improve arrhythmia, atrioventricular regurgitation, function-al class, and cardiac output by restoring laminar flow.2,3 We have shown in a preliminary study that Fontan circuit with APC is more dependent on cardiac cycle than the Fontan circuit with LT or ECC and that the hepatic vein (HV) in total cavopul-monary connection (TCPC) Fontan circuit shows different pat-terns during inspiration and expiration, compared with APC Fontan circuit.4 However, detailed information on differences in hemodynamic characteristics according to cardiac and re-spiratory cycles in different types of Fontan circuit is still
lack-Characterization of Flow Efficiency, Pulsatility, and
Respiratory Variability in Different Types of Fontan
Circuits Using Quantitative Parameters
Kee Soo Ha
1, Jae Young Choi
2, Se Yong Jung
2, and Han Ki Park
3 1Department of Pediatrics, College of Medicine, Korea University, Seoul;Divisions of 2Pediatric Cardiology and 3Cardiovascular Surgery, Severance Cardiovascular Hospital, Yonsei University College of Medicine, Seoul, Korea.
Purpose: Details on the hemodynamic differences among Fontan operations remain unclear according to respiratory and cardi-ac cycles. This study was undertaken to investigate hemodynamic charcardi-acteristics in different types of Fontan circulation by quan-tification of blood flow with the combined influence of cardiac and respiratory cycles.
Materials and Methods: Thirty-five patients [10 atriopulmonary connections (APC), 13 lateral tunnels (LT), and 12 extracardiac conduits (ECC)] were evaluated, and parameters were measured in the superior vena cava, inferior vena cava (IVC), hepatic vein (HV), baffles, conduits, and left and right pulmonary artery. Pulsatility index (PIx), respiratory variability index (RVI), net antegrade flow integral (NAFI), and inspiratory/expiratory blood flow (IQ/EQ) were measured by intravascular Doppler echocardiography.
Results: The PIx between APC and total cavopulmonary connection (TCPC; LT and ECC) showed significant differences at all inter-rogation points regardless of respiratory cycles. The PIxs of HVs and IVCs in APC significantly increased, compared with that in LT and ECC, and the RVI between APC and TCPC showed significant differences at all interrogation points (p<0.05). The NAFI and IQ/EQ between APC and TCPC showed significant differences at some interrogation points (p<0.05).
Conclusion: Patients with different types of Fontan circulation show different hemodynamic characteristics in various areas of the Fontan tract, which may lead to different risks causing long-term complications. We believe the novel parameters developed in this study may be used to determine flow characteristics and may serve as a clinical basis of management in patients after Fon-tan operations.
Key Words: Fontan procedure, hemodynamics, circulatory and respiratory physiological phenomena
pISSN: 0513-5796 · eISSN: 1976-2437
Received: September 27, 2018 Revised: November 12, 2018
Accepted: November 18, 2018
Corresponding author: Jae Young Choi, MD, PhD, Division of Pediatric Cardiolo-gy, Severance Cardiovascular Hospital, Yonsei University College of Medicine, 50-1 Yonsei-ro, Seodaemun-gu, Seoul 03722, Korea.
Tel: 82-2-2228-8280, Fax: 82-2-312-9538, E-mail: [email protected] •The authors have no potential conflicts of interest to disclose. © Copyright: Yonsei University College of Medicine 2019
This is an Open Access article distributed under the terms of the Creative Com-mons Attribution Non-Commercial License (https://creativecomCom-mons.org/licenses/ by-nc/4.0) which permits unrestricted non-commercial use, distribution, and repro-duction in any medium, provided the original work is properly cited.
57 https://doi.org/10.3349/ymj.2019.60.1.56
ing, and there are no clinically useful quantitative parameters representative of flow characteristics in the Fontan circuit. In this study, we sought to investigate differential characteristics of flow efficiency, pulsatile variability, and respiratory variabil-ity, as well as to find useful parameters representative of flow characteristics in different types of Fontan circuit.
MATERIALS AND METHODS
Patients
Patients were selected from 53 patients who met the inclusion criteria of the study and agreed to be enrolled in the study. This study was performed according to the protocol approved by the Local Ethics Committee (4-2018-0931) and informed consent was waived due to retrospective nature.
A flow chart of the enrolled patients in our study is presented in Fig. 1. We studied 35 post-Fontan patients (median age 14.6 years, 10.7 years after Fontan operation, males:female=21:14). Ten patients underwent APC, 13 patients had LT Fontan oper-ation, and the remaining 12 patients underwent ECC Fontan operation (Table 1). LT Fontan and ECC Fontan were defined as TCPC Fontan circuit. They underwent intravascular Doppler
ultrasonography between January 2001 and December 2010 at Severance Cardiovascular Hospital, Yonsei University Health System.
The patients were considered to be included in the study when they had good post-Fontan status to represent hemodynamic characteristics of each Fontan circuit. The patients were ex-cluded from this study when they had severe arrhythmia, ab-normal systemic ventricular function, and any significant resid-ual hemodynamic abnormalities, such as Fontan circuit stenosis, valve regurgitation, intracardiac shunt, and abnormally-high Fontan circuit pressure (mean pressure ≥20 mm Hg) evidenced by electrocardiography, echocardiography, and catheterization.
Measurements
Intravenous Doppler echocardiography (IDE) study was per-formed in all patients after routine cardiac catheterization, in-cluding pressure recording and oxygen saturation measure-ments. Intravenous heparin of 5000 IU was administered under the monitoring of respiratory and cardiac cycles, and a piezo-electric ultrasound transducer of 12 MHz was inserted in an 8-French guiding catheter. The systems of fast Fourier transfor-mation and computer display (FloMapTM, Cardiometrics, Moun-tain View, CA, USA) processed the signals of flow velocity and spectral format. Each flow velocity was measured continuously in the superior vena cava (SVC), inferior vena cava (IVC), HV, baffle of LT, conduit of ECC, left pulmonary artery (LPA), and right pulmonary artery (RPA) based on the respiratory cycle and cardiac cycle. The tip of the Doppler transducer was placed in a free lumen along the longitudinal axis of the vessels to avoid bending. The pressure and saturation were measured simul-taneously using an aortic system to monitor the vital signs.
The values were measured three times in each vessel, re-corded on video tapes, and analyzed by an offline interroga-tion. The sites of Doppler interrogation were as follows: SVC, between the innominate vein and PA; IVC, 2–3 cm inferior to the junction of the IVC and RA; HV, 2–3 cm laterally to the junction of the HV and IVC; RPA, 1 cm medially to the hilum of the lung; LPA, 1 cm medially to the hilum of the lung; and baffle and conduit, middle portion to avoid deviating the up-per or lower portion. Measured values were obtained at the SVC, IVC, HV, baffle of LT, conduit of ECC, LPA, and RPA in three Fontan groups. Systolic (S), diastolic (D), and reverse (R) waves from the echocardiographic Doppler examination were determined as previously described.5 The S and D flows were included, and the R flow was excluded to calculate the param-eters of pulsatility index (PIx) and respiratory variability index (RVI).
[image:2.595.58.296.370.702.2]We measured the forward velocity time integral (VTI) and average velocity (AV), reverse VTI and AV, and calculated PI, RVI, net antegrade flow integral (NAFI), mean flow rate (MFR, Q), and IQ/EQ (inspiratory Q/expiratory Q) using the follow-ing Eqs. from (3) to (7).
Fig. 1. Flow chart of the enrolled patients. IDE, intravenous Doppler echo-cardiography; APC, atriopulmonary connection; LT, lateral tunnel; ECC, extracardiac conduit.
Post-Fontan patients with cardiac catheterization during study period
(n=121)
IDE study performd (n=53)
Quality of Doppler spectral satisfactory for analysis
(n=43)
Quality of data satisfactory for analysis
(n=35)
APC-type Fontan (n=10)
LT-type Fontan (n=13)
ECC-type Fontan (n=12) Informed consent refused or
IDE study not performed (n=68)
Quality of Doppler spectral unsatisfactory for analysis
(n=10)
Patients with exaggerated or depressed respiratory influence
58 https://doi.org/10.3349/ymj.2019.60.1.56 [if difference between A1 and A2 is ignorable in the same vessel
dur-ing in spiratory and expiratory phases (A1, A2: areas of A1 and A2
ves-sels)]. (7)
The IQ/EQ was defined as the approximate value under the premise that a difference in the vessel area between inspira-tion and expirainspira-tion is small enough to ignore. Therefore, AV, VTI, and Q reflect flow characteristics. NAFI reflects flow effi-ciency and PIx reflects influence of cardiac cycle. RVI and IQ/ EQ reflect respiratory influence on blood flow characteristics. The mean of the measured values was calculated at each ves-sel, and the mean values were used to calculate the
parame-𝑉𝑉𝑉𝑉𝑉𝑉 (m) = ∫ 𝑣𝑣(𝑡𝑡)𝑑𝑑𝑡𝑡𝑡𝑡1𝑡𝑡2 , 𝑡𝑡: time, 𝑣𝑣: velocity. (1)
𝐴𝐴𝑉𝑉 (m/s) =𝑉𝑉𝑉𝑉𝑉𝑉 ∆𝑉𝑉 =∫ 𝑣𝑣(𝑡𝑡)𝑑𝑑𝑡𝑡𝑡𝑡1𝑡𝑡2
∆𝑉𝑉 , ∆𝑉𝑉: time interval (𝑡𝑡2− 𝑡𝑡1). (2)
𝑃𝑃𝑉𝑉𝑃𝑃 =Maximal peak velocity – Minimal peak velocity𝐴𝐴𝑉𝑉 . (3)
𝑅𝑅𝑉𝑉𝑉𝑉 =𝑉𝑉𝑉𝑉𝑉𝑉inspiratory maximum –𝑉𝑉𝑉𝑉𝑉𝑉expiratory minimum
𝑉𝑉𝑉𝑉𝑉𝑉Average . (4)
𝑁𝑁𝐴𝐴𝑁𝑁𝑉𝑉 (m) = 𝑉𝑉𝑉𝑉𝑉𝑉systole+ 𝑉𝑉𝑉𝑉𝑉𝑉diastole– VTIreversal. (5)
𝑄𝑄 (m3/s) = 𝑉𝑉 ∆𝑉𝑉 =
𝐴𝐴 ∫ 𝑣𝑣(𝑡𝑡)𝑑𝑑𝑡𝑡𝑡𝑡1𝑡𝑡2
∆𝑉𝑉 = 𝐴𝐴 × 𝐴𝐴𝑉𝑉,
(𝑉𝑉: volume, 𝐴𝐴: mean area of 3 times in each interrogation point). (6)
𝑉𝑉𝑄𝑄 𝐸𝐸𝑄𝑄 =
𝐴𝐴1 × 𝐴𝐴𝑃𝑃𝑉𝑉inspiratory 𝐴𝐴2 × 𝐴𝐴𝑃𝑃𝑉𝑉expiratory ≅
𝐴𝐴𝑃𝑃𝑉𝑉inspiratory 𝐴𝐴𝑃𝑃𝑉𝑉expiratory,
if difference between A1 and A2 is ignorable in the same vessel during
inspiratory and expiratory phases (A1, A2: areas of A1 and A2 vessels). (7)
𝑃𝑃𝑃𝑃𝑁𝑁 = Antegrade flow−Retrograde flowAntegrade flow × 100.
𝑁𝑁𝐴𝐴𝑁𝑁𝑉𝑉 = 𝑉𝑉𝑉𝑉𝑉𝑉systole(antegrade)+ 𝑉𝑉𝑉𝑉𝑉𝑉diastole(antegrade)– 𝑉𝑉𝑉𝑉𝑉𝑉inreversal(retrograde).
𝑉𝑉𝑉𝑉𝑉𝑉 (m) = ∫ 𝑣𝑣(𝑡𝑡)𝑑𝑑𝑡𝑡
𝑡𝑡1𝑡𝑡2,
𝑡𝑡: time, 𝑣𝑣: velocity. (1)𝐴𝐴𝑉𝑉 (m/s) =
𝑉𝑉𝑉𝑉𝑉𝑉 ∆𝑉𝑉=
∫ 𝑣𝑣(𝑡𝑡)𝑑𝑑𝑡𝑡𝑡𝑡1𝑡𝑡2∆𝑉𝑉
, ∆𝑉𝑉: time interval (𝑡𝑡2
− 𝑡𝑡1).
(2)𝑃𝑃𝑉𝑉𝑃𝑃 =
Maximal peak velocity – Minimal peak velocity𝐴𝐴𝑉𝑉.
(3)𝑅𝑅𝑉𝑉𝑉𝑉 =
𝑉𝑉𝑉𝑉𝑉𝑉inspiratory maximum –𝑉𝑉𝑉𝑉𝑉𝑉expiratory minimum𝑉𝑉𝑉𝑉𝑉𝑉Average
.
(4)𝑁𝑁𝐴𝐴𝑁𝑁𝑉𝑉 (m) = 𝑉𝑉𝑉𝑉𝑉𝑉systole+ 𝑉𝑉𝑉𝑉𝑉𝑉diastole– VTIreversal. (5)
𝑄𝑄 (m3/s) = 𝑉𝑉
∆𝑉𝑉 =
𝐴𝐴 ∫ 𝑣𝑣(𝑡𝑡)𝑑𝑑𝑡𝑡𝑡𝑡1𝑡𝑡2
∆𝑉𝑉 = 𝐴𝐴 × 𝐴𝐴𝑉𝑉,
(𝑉𝑉: volume, 𝐴𝐴: mean area of 3 times in each interrogation point). (6)
𝑉𝑉𝑄𝑄 𝐸𝐸𝑄𝑄 =
𝐴𝐴1 × 𝐴𝐴𝑃𝑃𝑉𝑉inspiratory
𝐴𝐴2 × 𝐴𝐴𝑃𝑃𝑉𝑉expiratory ≅
𝐴𝐴𝑃𝑃𝑉𝑉inspiratory
𝐴𝐴𝑃𝑃𝑉𝑉expiratory,
if difference between A1 and A2 is ignorable in the same vessel during
inspiratory and expiratory phases (A1, A2: areas of A1 and A2 vessels). (7)
𝑃𝑃𝑃𝑃𝑁𝑁 =
Antegrade flow−Retrograde flowAntegrade flow× 100.
𝑁𝑁𝐴𝐴𝑁𝑁𝑉𝑉 = 𝑉𝑉𝑉𝑉𝑉𝑉systole(antegrade)
+ 𝑉𝑉𝑉𝑉𝑉𝑉diastole(antegrade)– 𝑉𝑉𝑉𝑉𝑉𝑉inreversal(retrograde)
.
𝑉𝑉𝑉𝑉𝑉𝑉 (m) = ∫ 𝑣𝑣(𝑡𝑡)𝑑𝑑𝑡𝑡
𝑡𝑡1𝑡𝑡2,
𝑡𝑡: time, 𝑣𝑣: velocity. (1)𝐴𝐴𝑉𝑉 (m/s) =
𝑉𝑉𝑉𝑉𝑉𝑉 ∆𝑉𝑉=
∫ 𝑣𝑣(𝑡𝑡)𝑑𝑑𝑡𝑡𝑡𝑡1𝑡𝑡2∆𝑉𝑉
, ∆𝑉𝑉: time interval (𝑡𝑡
2− 𝑡𝑡
1). (2)𝑃𝑃𝑉𝑉𝑃𝑃 =
Maximal peak velocity – Minimal peak velocity𝐴𝐴𝑉𝑉.
(3)𝑅𝑅𝑉𝑉𝑉𝑉 =
𝑉𝑉𝑉𝑉𝑉𝑉inspiratory maximum –𝑉𝑉𝑉𝑉𝑉𝑉expiratory minimum𝑉𝑉𝑉𝑉𝑉𝑉Average
.
(4)𝑁𝑁𝐴𝐴𝑁𝑁𝑉𝑉 (m) = 𝑉𝑉𝑉𝑉𝑉𝑉systole+ 𝑉𝑉𝑉𝑉𝑉𝑉diastole– VTIreversal. (5)
𝑄𝑄 (m3/s) = 𝑉𝑉
∆𝑉𝑉 =
𝐴𝐴 ∫ 𝑣𝑣(𝑡𝑡)𝑑𝑑𝑡𝑡𝑡𝑡1𝑡𝑡2
∆𝑉𝑉 = 𝐴𝐴 × 𝐴𝐴𝑉𝑉,
(𝑉𝑉: volume, 𝐴𝐴: mean area of 3 times in each interrogation point). (6)
𝑉𝑉𝑄𝑄 𝐸𝐸𝑄𝑄 =
𝐴𝐴1 × 𝐴𝐴𝑃𝑃𝑉𝑉inspiratory
𝐴𝐴2 × 𝐴𝐴𝑃𝑃𝑉𝑉expiratory ≅
𝐴𝐴𝑃𝑃𝑉𝑉inspiratory
𝐴𝐴𝑃𝑃𝑉𝑉expiratory,
if difference between A1 and A2 is ignorable in the same vessel during
inspiratory and expiratory phases (A1, A2: areas of A1 and A2 vessels). (7)
𝑃𝑃𝑃𝑃𝑁𝑁 =
Antegrade flow−Retrograde flowAntegrade flow× 100.
𝑁𝑁𝐴𝐴𝑁𝑁𝑉𝑉 = 𝑉𝑉𝑉𝑉𝑉𝑉systole(antegrade)
+ 𝑉𝑉𝑉𝑉𝑉𝑉diastole(antegrade)– 𝑉𝑉𝑉𝑉𝑉𝑉inreversal(retrograde)
.
(1)(2)
(3)
(4)
(5)
(6)
ters of VTI, AV, PIx, RVI, NAFI, Q, and IQ/EQ. We compared delicate differences of these parameters between APC and TCPC Fontan and among APC, LT, and ECC according to pul-satile variation and respiratory variation. Chronological steps of analyzing the echocardiographic and equational parame-ters are presented in Fig. 2.
Statistical analysis
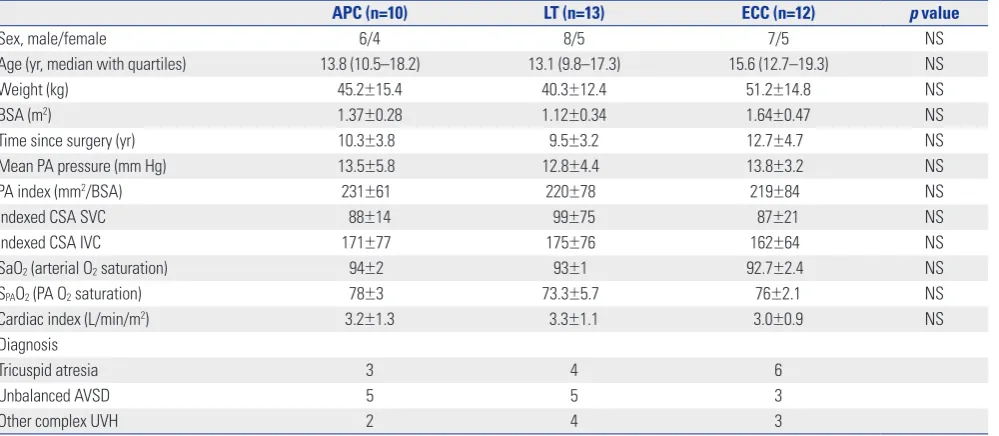
Parameters were compared among the Fontan types based on the respiratory cycles and cardiac cycles using a nonparamet-Table 1. Demographic and Clinical Characteristics of Different Types of Fontan Patients
APC (n=10) LT (n=13) ECC (n=12) p value
Sex, male/female 6/4 8/5 7/5 NS
Age (yr, median with quartiles) 13.8 (10.5–18.2) 13.1 (9.8–17.3) 15.6 (12.7–19.3) NS
Weight (kg) 45.2±15.4 40.3±12.4 51.2±14.8 NS
BSA (m2) 1.37±0.28 1.12±0.34 1.64±0.47 NS
Time since surgery (yr) 10.3±3.8 9.5±3.2 12.7±4.7 NS
Mean PA pressure (mm Hg) 13.5±5.8 12.8±4.4 13.8±3.2 NS
PA index (mm2/BSA) 231±61 220±78 219±84 NS
Indexed CSA SVC 88±14 99±75 87±21 NS
Indexed CSA IVC 171±77 175±76 162±64 NS
SaO2 (arterial O2 saturation) 94±2 93±1 92.7±2.4 NS
SPAO2 (PA O2 saturation) 78±3 73.3±5.7 76±2.1 NS
Cardiac index (L/min/m2) 3.2±1.3 3.3±1.1 3.0±0.9 NS
Diagnosis
Tricuspid atresia 3 4 6
Unbalanced AVSD 5 5 3
Other complex UVH 2 4 3
NS, not significant; BSA, body surface area; PA, pulmonary artery; CSA, cross sectional area; SVC, superior vena cava; IVC, inferior vena cava; AVSD, atrioven-tricular septal defect; UVH, univenatrioven-tricular heart; APC, atriopulmonary connection; LT, lateral tunnel; ECC, extracardiac conduit.
Fig. 2. Chronological steps of analyzing the echocardiographic and equa-tional parameters. SVC, superior vena cava; IVC, inferior vena cava; HV, hepatic vein; LPA, left pulmonary artery; RPA, right pulmonary artery; VTI, velocity time integral; AV, average velocity; PIx, pulsatility index; RVI, re-spiratory variability index; NAFI, net antegrade flow integral; MFR, mean flow rate (Q); IQ/EQ, inspiratory Q/expiratory Q.
Performing Doppler measurements at SVC, IVC, HV, baffle, conduit, LPA, and RPA
Selecting the qualified Doppler Spectrals from the recorded videos
Analyzing and obtaining VTIs for each cardiac cycle and respiratory phase in all observed vessels and conduit
Calculation of the AV, Plx, RVI, NAFI, Q, and IQ/EQ from each equation
[image:3.595.44.544.86.304.2]59 https://doi.org/10.3349/ymj.2019.60.1.56
ric test (Mann-Whitney U test). p values of <0.05 were consid-ered statistically significant, and SPSS version 12 (SPSS Inc., Chicago, IL, USA) was used.
RESULTS
The demographic and clinical characteristics of the patients showed no statistically significant differences in age, sex, weight, PA pressure, or PA indices among Fontan operations. The most common diagnosis for both APC and LT was unbalanced atrio-ventricular septal defect; in ECC, the most common diagnosis was tricuspid atresia (Table 1).
The values of PIx in APC were greater than those in TCPC in all vessels. The PIx in APC significantly increased, compared with the PIx in TCPC, at all vessels (p<0.05) regardless of re-spiratory cycle. The PIx between APC and LT and between APC and ECC showed significant differences at all interroga-tion points (p<0.05). The PIx between LT and ECC showed sig-nificant differences only at the SVC and IVC (p<0.05). The PIx between expiration and inspiration did not show significant differences in most interrogation points, and only the PIx in the HV of LT showed significant differences between
inspira-tion and expirainspira-tion (p=0.004) (Table 2).
[image:4.595.56.555.88.420.2]The PIx in the HV was the highest among the measured ves-sels. The PIx of the IVC in APC was significantly greater than Table 2. Comparison of PIx between Inspiration and Expiration among the APC, LT, and ECC at the SVC, IVC, HV, Baffle, Conduit, LPA, and RPA
Types of Fontan circuit p value
APC LT ECC APC vs. LT APC vs. ECC LT vs. ECC APC vs. LT+ECC
SVC 1.59±0.46 0.56±0.24 0.82±2.00 <0.001 <0.001 <0.001 <0.001
Insp. 1.63±0.45 0.56±0.21 0.83±0.18 0.001 0.004 0.002 0.001
Exp. 1.55±0.51 0.57±0.29 0.81±0.23 0.008 0.014 0.005 0.001
p (I & E) 0.754 0.753 0.453 - - -
-IVC 1.61±0.63 0.67±0.42 0.36±0.18 <0.001 <0.001 0.004 <0.001
Insp. 1.70±0.31 0.65±0.40 0.37±0.21 0.002 0.002 0.043 0.001
Exp. 1.54±0.84 0.68±0.45 0.35±0.16 0.020 0.030 0.031 0.013
p (I & E) 0.715 0.831 0.880 - - -
-HV 6.15±3.60 2.17±2.72 1.38±0.88 0.002 <0.001 0.365 0.001
Insp. 4.47±0.87 1.32±1.25 1.10±0.53 0.013 0.011 0.866 0.008
Exp. 7.82±4.81 3.06±3.51 1.65±1.09 0.055 0.011 0.218 0.024
p (I & E) 0.275 0.004 0.257 - - -
-Baf/Con - 0.92±0.49 0.66±0.26 - - 0.364
-Insp. - 0.83±0.38 0.59±0.31 - - 0.421
-Exp. - 1.01±0.61 0.73±0.22 - - 0.602
-p (I &am-p; E) - 0.602 0.602 - - -
-LPA 1.53±0.28 0.68±0.40 0.59±0.23 <0.001 <0.001 0.885 <0.001
Insp. 1.56±0.19 0.64±0.36 0.61±0.21 0.002 0.002 0.714 0.001
Exp. 1.51±0.37 0.72±0.44 0.58±0.27 0.006 0.003 0.515 0.003
p (I & E) 0.917 0.833 0.592 - - -
-RPA 1.64±0.74 0.68±0.35 0.59±0.15 <0.001 <0.001 0.434 <0.001
Insp. 1.68±0.88 0.67±0.32 0.60±0.16 0.002 0.002 0.375 0.001
Exp. 1.60±0.68 0.68±0.38 0.58±0.15 0.003 0.002 0.839 0.001
p (I & E) 0.917 0.999 0.821 - - -
-PIx, pulsatility index; APC, atriopulmonary connection; LT, lateral tunnel; ECC, extracardiac conduit; SVC, superior vena cava; IVC, inferior vena cava; HV, hepatic vein; LPA, left pulmonary artery; RPA, right pulmonary artery; Baf/Con, baffle in LT or conduit in ECC; p (I & E), p value between inspiration and expiration.
Fig. 3. Comparison of PIx among the vessels in APC. PIx, pulsatility index; APC, atriopulmonary connection; SVC, superior vena cava; IVC, inferior vena cava; LPA, left pulmonary artery; RPA, right pulmonary artery.
8
6
4
2
0
SVC+IVC
p=0.007
p=0.011
Hepatic vein LPA+RPA
[image:4.595.317.552.455.651.2]60 https://doi.org/10.3349/ymj.2019.60.1.56 that in LT and ECC Fontan during the entire respiration cycle
(all p≤0.001). The PIx of the HV in APC significantly increased, compared with that in LT and ECC, during the sum of inspira-tion and expirainspira-tion (p=0.002 and p<0.001, respectively) (Table 2).
Further, the PIxs of the HV and IVC in APC were compared with those of the SVC, LPA, and RPA. The PIx of the HV was significantly greater than the PIxs of all other interrogation points (all p=0.001), and the PIx of the IVC did not show sig-nificant differences, compared with those of the other interro-gation points, except for the PIx of the HV (p<0.001) (Fig. 3).
The values of RVI in APC were lower than those in TCPC in all vessels. The RVI in APC significantly decreased, compared with the RVIs in TCPC, at all interrogation points (p<0.05). The RVI between APC and LT and between APC and ECC showed significant differences at all interrogation points (p<0.05). The RVI between LT and ECC in most interrogation points did not show significant differences, except for the RVI between baffle and conduit (p=0.047) (Table 3).
[image:5.595.42.539.225.326.2]The values of NAFI in APC were the lowest, those in LT were in between, and those in ECC were the highest in all vessels.
Table 3. Comparison of RVI (%) among APC, LT, and ECC at the SVC, IVC, HV, Baffle, Conduit, LPA, and RPA
Types of Fontan circuit p value
APC LT ECC APC vs. LT APC vs. ECC LT vs. ECC APC vs. LT+ECC
SVC 9.44±3.12 30.83±16.21 40.68±18.66 0.004 0.003 0.309 0.002
IVC 13.55±8.29 47.23±28.09 45.32±27.32 0.008 0.020 0.839 0.006
HV 33.79±28.15 120.51±37.79 100.08±41.08 0.010 0.043 0.176 0.012
Baffle/Conduit - 36.42±19.57 66.81±46.70 - - 0.047
-LPA 20.92±10.31 43.68±15.76 55.56±15.84 0.005 0.003 0.056 0.002
RPA 14.16±5.91 39.37±17.38 50.88±18.35 0.005 0.007 0.083 0.003
RVI, respiratory variability index; APC, atriopulmonary connection; LT, lateral tunnel; ECC, extracardiac conduit; SVC, superior vena cava; IVC, inferior vena cava; HV, hepatic vein; LPA, left pulmonary artery; RPA, right pulmonary artery; Baffle/Conduit, baffle in LT or conduit in ECC.
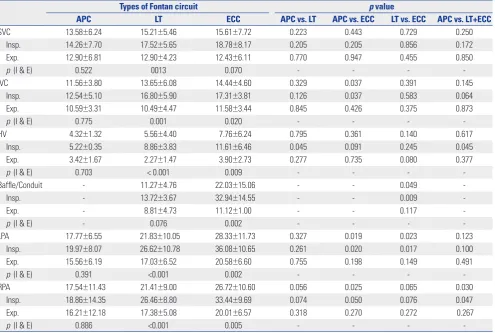
Table 4. Comparison of NAFI (cm) between Inspiration and Expiration among APC, LT, and ECC at the SVC, IVC, HV, Baffle, Conduit, LPA, and RPA
Types of Fontan circuit p value
APC LT ECC APC vs. LT APC vs. ECC LT vs. ECC APC vs. LT+ECC
SVC 13.58±6.24 15.21±5.46 15.61±7.72 0.223 0.443 0.729 0.250
Insp. 14.26±7.70 17.52±5.65 18.78±8.17 0.205 0.205 0.856 0.172
Exp. 12.90±6.81 12.90±4.23 12.43±6.11 0.770 0.947 0.455 0.850
p (I & E) 0.522 0013 0.070 - - -
-IVC 11.56±3.80 13.65±6.08 14.44±4.60 0.329 0.037 0.391 0.145
Insp. 12.54±5.10 16.80±5.90 17.31±3.81 0.126 0.037 0.583 0.064
Exp. 10.59±3.31 10.49±4.47 11.58±3.44 0.845 0.426 0.375 0.873
p (I & E) 0.775 0.001 0.020 - - -
-HV 4.32±1.32 5.56±4.40 7.76±6.24 0.795 0.361 0.140 0.617
Insp. 5.22±0.35 8.86±3.83 11.61±6.46 0.045 0.091 0.245 0.045
Exp. 3.42±1.67 2.27±1.47 3.90±2.73 0.277 0.735 0.080 0.377
p (I & E) 0.703 < 0.001 0.009 - - -
-Baffle/Conduit - 11.27±4.76 22.03±15.06 - - 0.049
-Insp. - 13.72±3.67 32.94±14.55 - - 0.009
-Exp. - 8.81±4.73 11.12±1.00 - - 0.117
-p (I &am-p; E) - 0.076 0.002 - - -
-LPA 17.77±6.55 21.83±10.05 28.33±11.73 0.327 0.019 0.023 0.123
Insp. 19.97±8.07 26.62±10.78 36.08±10.65 0.261 0.020 0.017 0.100
Exp. 15.56±6.19 17.03±6.52 20.58±6.60 0.755 0.198 0.149 0.491
p (I & E) 0.391 <0.001 0.002 - - -
-RPA 17.54±11.43 21.41±9.00 26.72±10.60 0.056 0.025 0.065 0.030
Insp. 18.86±14.35 26.46±8.80 33.44±9.69 0.074 0.050 0.076 0.047
Exp. 16.21±12.18 17.38±5.08 20.01±6.57 0.318 0.270 0.272 0.267
p (I & E) 0.886 <0.001 0.005 - - -
[image:5.595.45.541.373.706.2]61 https://doi.org/10.3349/ymj.2019.60.1.56
The NAFI in APC significantly decreased, compared with the NAFI in TCPC in several interrogation points (inspiratory HV, LPA, and RPA), regardless of the respiratory cycles. The NAFI between APC and LT showed significant differences only at the inspiratory HV (p=0.045). The NAFI between APC and ECC showed significant differences at the IVC, LPA, and RPA (p<0.05). The NAFI between LT and ECC showed significant differences at the baffle/conduit and LPA (p=0.049 and 0.023, respectively). The NAFIs between inspiration and expiration in APC did not show significant differences in all interrogation points; however, those in LT and ECC showed significant dif-ferences (both p<0.05), except for that of the SVC in ECC (p= 0.07) (Table 4).
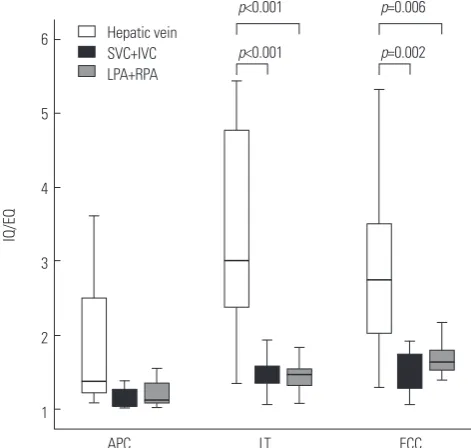
The values of IQ/EQ in APC were lower than those in TCPC in all interrogation points. The IQ/EQ in APC significantly de-creased, compared with the IQ/EQ in TCPC, in almost all in-terrogation points (p<0.05), except for that in the HV (p= 0.154). The IQ/EQ between APC and LT showed significant differences at the SVC, IVC, LPA, and RPA (p<0.05). The IQ/ EQ between APC and ECC showed significant differences at the SVC, LPA, and RPA (p<0.05). The IQ/EQ between LT and ECC did not show significant differences in most interroga-tion points, except for the LPA (p=0.015) (Table 5).
The value of IQ/EQ in the HV was the highest among the in-terrogation points in each Fontan circuit. The IQ/EQ of the HV in APC did not show significant differences compared with those of the other vessels; however, the IQ/EQs of the HV in LT and ECC showed significant differences compared with those of all the other interrogation points (both p<0.05) (Fig. 4).
DISCUSSION
The IDE can obtain good quality Doppler spectral images with-out limitations of waveform distortions caused by poor inter-cept angle or poor tissue penetration in transthoracic or trans-esophageal Doppler echocardiography. Also the IDE makes accurate flow analysis possible through direct intravascular Doppler measurement whereas MRI does not permit appro-priate flow analysis due to respiratory fluctuation and intra-thoracic metal substances. However, IDE has the
disadvan-tage of invasive measurement, although the invasiveness may not be a problem in patients who undergo scheduled cardiac catheterization for other reasons: we have revealed in a previ-ous study that the IDE is an effective modality to investigate flow characteristics in post-Fontan patients.4
[image:6.595.57.553.87.188.2]AV and VTI represent average flow velocity and flow size; VTI also reflects flow volume if diameter differences of blood vessels are ignorable.5 The PIx accounts for the degree of ve-locity changes according to cardiac cycle.6 The RVI reflects the influence of respiratory movements on the observed or calcu-lated parameters.7 We designed NAFI to reflect the sum of for-ward and backfor-ward flows, which determined the size of effec-tive forward flow throughout the cardiac cycles and respiratory phases.8 Q (MFR) reflected the amount of blood volume ac-cording to a given unit of time, and inspiratory/expiratory blood flow ratio (IQ/EQ) represented the change of blood flow according to the respiratory cycle.9 These parameters were Table 5. Comparison of the IQ/EQ among APC, LT, and ECC in the SVC, IVC, HV, Baffle, Conduit, LPA, and RPA
Types of Fontan circuit p value
APC LT ECC APC vs. LT APC vs. ECC LT vs. ECC APC vs. LT+ECC
SVC 1.08±0.05 1.35±0.20 1.50±0.27 0.002 0.003 0.197 0.001
IVC 1.21±0.18 1.66±0.73 1.58±0.56 0.015 0.111 0.735 0.021
HV 2.02±1.39 4.36±3.95 2.94±1.31 0.127 0.310 0.499 0.154
Baffle/Conduit - 1.91±0.77 2.97±1.97 - - 0.175
-LPA 1.24±0.21 1.53±0.26 1.70±0.21 0.046 0.005 0.015 0.015
RPA 1.16±0.13 1.46±0.24 1.61±0.28 0.008 0.014 0.108 0.006
IQ/EQ, inspiratory blood flow/expiratory blood flow; APC, atriopulmonary connection; LT, lateral tunnel; ECC, extracardiac conduit; SVC, superior vena cava; IVC, inferior vena cava; HV, hepatic vein; LPA, left pulmonary artery; RPA, right pulmonary artery; Baffle/Conduit, baffle in LT or conduit in ECC.
Fig. 4. Comparisons of IQ/EQ of hepatic vein with those of SVC plus IVC and LPA plus RPA in APC, LT, and ECC. IQ/EQ, inspiratory flow rate/expira-tory flow rate; SVC, superior vena cava; IVC, inferior vena cava; LPA, left pulmonary artery; RPA, right pulmonary artery; APC, atriopulmonary con-nection; LT, lateral tunnel; ECC, extracardiac conduit.
6
5
4
3
2
1
LT
p<0.001 p=0.002
p<0.001 p=0.006
APC Hepatic vein SVC+IVC LPA+RPA
ECC
[image:6.595.314.550.223.447.2]62
Flow Efficiency and Pulsatility in Fontan Circuit
https://doi.org/10.3349/ymj.2019.60.1.56 designed so that the AV, VTI, and Q reflect flow characteristics,
the NAFI reflects flow efficiency, the PIx reflects influence of cardiac cycle, and the RVI and IQ/EQ reflect respiratory influ-ence on blood flow characteristics. It was reported that the LT and ECC Fontan groups (TCPC) had less pulsations in the pul-monary artery than the pulsatile Fontan group (APC) on echo-cardiography and magnetic resonance images.10,11 We investi-gated PIx to estimate the degree of pulsatility, and our results showed that PIx was highest in APC, followed by LT and ECC. In other words, pulsatility was most influential in the APC Fontan patients and the least influential in the ECC Fontan pa-tients. Therefore, among TCPC patients, cardiac pulsatility was less influential in the ECC Fontan, compared to the LT Fontan, and furthermore, APC Fontan was more influenced by cardiac pulsatility than TCPC.
Classic trans-atrial Fontan (APC) is characterized by energy inefficiency due to a seesaw pattern of forward flow and re-verse flow.12 Large hepatic pulsatility and reverse flow caused by atrial contraction in APC Fontan are associated with he-patic complications positively correlated with increased HV pressure.13,14 Protein-losing enteropathy seems to be associat-ed with venous and lymphatic congestions in the splanchnic circulation, and the protein-losing enteropathy is positively correlated with increased IVC pressure.15,16 Changes in HV and IVC flow by atrial contraction in APC Fontan can be classi-fied into two patterns as prominent pulsatility and creation of negative reversal. Our results showed that the PIxs of the HV and IVC in APC were prominent, compared with other types of Fontan circuit and that they showed significant increases in APC, compared with those of the other measurement points. Therefore, more pulsatility of the HV and IVC in APC Fontan circuit may lead to reverse flow and pressure stress, which may potentially expose patients to the development of Fontan com-plications.
Less pulsatile characteristics of TCPC can increase the monary arterial pressure and vascular resistance, and the pul-satile source of antegrade pulmonary blood flow has a poten-tial benefit of PA growth.17 Our results showed that the PIx of the LPA and RPA in LT and ECC Fontan circuits showed sig-nificantly less pulsatilities than the PIx in APC. Theoretically, less pulsatility of the LPA and RPA in TCPC may potentially be associated with endothelial dysfunction18 and this may cause a resultant increase of pulmonary vascular resistance in the long-term. Systemic and hepatic venous flow in TCPC Fontan were markedly dependent on the respiratory cycle, whereas those in APC Fontan were dependent on the cardiac cycle.19 TCPC Fontan circuit might be superior to APC Fontan in terms of pulmonary hemodynamics because the inspiratory drive permits blood to be sucked into the lungs.20 We investigated RVI to estimate the dependence of respiration. Our results, which followed similar patterns to those of previous studies, showed that RVI in TCPC significantly increased, compared with those in APC, in all vessels.19,20 Moreover, the RVI
be-tween LT and ECC did not show statistically significant differ-ences in all interrogation points. Therefore, our study has re-established the fact that TCPC Fontan influenced by the respiratory cycle (particularly inspiratory drive) can supply more efficient forward circulations into the lungs than APC Fontan. On the other hand, TCPC Fontan circuit can more easily be compromised in the clinical setting of respiratory de-pression because pulmonary circulation in TCPC Fontan cir-cuit is more dependent on respiratory drive.
It is known that flow velocities in TCPC Fontan are signifi-cantly higher, less variable, and unidirectional than those in APC Fontan. The percentage uni-directionality of flow (PUF) has been represented as follows:21
𝐴𝐴𝑉𝑉 (m/s) =
𝑉𝑉𝑉𝑉𝑉𝑉 ∆𝑉𝑉=
∫ 𝑣𝑣(𝑡𝑡)𝑑𝑑𝑡𝑡𝑡𝑡1𝑡𝑡2∆𝑉𝑉
, ∆𝑉𝑉: time interval (𝑡𝑡2
− 𝑡𝑡1).
(2)𝑃𝑃𝑉𝑉𝑃𝑃 =
Maximal peak velocity – Minimal peak velocity𝐴𝐴𝑉𝑉.
(3)𝑅𝑅𝑉𝑉𝑉𝑉 =
𝑉𝑉𝑉𝑉𝑉𝑉inspiratory maximum –𝑉𝑉𝑉𝑉𝑉𝑉expiratory minimum𝑉𝑉𝑉𝑉𝑉𝑉Average
.
(4)𝑁𝑁𝐴𝐴𝑁𝑁𝑉𝑉 (m) = 𝑉𝑉𝑉𝑉𝑉𝑉systole+ 𝑉𝑉𝑉𝑉𝑉𝑉diastole– VTIreversal. (5)
𝑄𝑄 (m3/s) = 𝑉𝑉
∆𝑉𝑉 =
𝐴𝐴 ∫ 𝑣𝑣(𝑡𝑡)𝑑𝑑𝑡𝑡𝑡𝑡1𝑡𝑡2
∆𝑉𝑉 = 𝐴𝐴 × 𝐴𝐴𝑉𝑉,
(𝑉𝑉: volume, 𝐴𝐴: mean area of 3 times in each interrogation point). (6)
𝑉𝑉𝑄𝑄 𝐸𝐸𝑄𝑄 =
𝐴𝐴1 × 𝐴𝐴𝑃𝑃𝑉𝑉inspiratory
𝐴𝐴2 × 𝐴𝐴𝑃𝑃𝑉𝑉expiratory ≅
𝐴𝐴𝑃𝑃𝑉𝑉inspiratory
𝐴𝐴𝑃𝑃𝑉𝑉expiratory,
if difference between A1 and A2 is ignorable in the same vessel during
inspiratory and expiratory phases (A1, A2: areas of A1 and A2 vessels). (7)
𝑃𝑃𝑃𝑃𝑁𝑁 =
Antegrade flow−Retrograde flowAntegrade flow× 100.
𝑁𝑁𝐴𝐴𝑁𝑁𝑉𝑉 = 𝑉𝑉𝑉𝑉𝑉𝑉systole(antegrade)
+ 𝑉𝑉𝑉𝑉𝑉𝑉diastole(antegrade)– 𝑉𝑉𝑉𝑉𝑉𝑉
inreversal(retrograde).
𝑉𝑉𝑉𝑉𝑉𝑉 (m) = ∫ 𝑣𝑣(𝑡𝑡)𝑑𝑑𝑡𝑡𝑡𝑡1𝑡𝑡2 , 𝑡𝑡: time, 𝑣𝑣: velocity. (1)
𝐴𝐴𝑉𝑉 (m/s) =𝑉𝑉𝑉𝑉𝑉𝑉 ∆𝑉𝑉 =∫ 𝑣𝑣(𝑡𝑡)𝑑𝑑𝑡𝑡𝑡𝑡1𝑡𝑡2
∆𝑉𝑉 , ∆𝑉𝑉: time interval (𝑡𝑡2− 𝑡𝑡1). (2)
𝑃𝑃𝑉𝑉𝑃𝑃 =Maximal peak velocity – Minimal peak velocity𝐴𝐴𝑉𝑉 . (3)
𝑅𝑅𝑉𝑉𝑉𝑉 =𝑉𝑉𝑉𝑉𝑉𝑉inspiratory maximum –𝑉𝑉𝑉𝑉𝑉𝑉expiratory minimum
𝑉𝑉𝑉𝑉𝑉𝑉Average . (4)
𝑁𝑁𝐴𝐴𝑁𝑁𝑉𝑉 (m) = 𝑉𝑉𝑉𝑉𝑉𝑉systole+ 𝑉𝑉𝑉𝑉𝑉𝑉diastole– VTIreversal. (5)
𝑄𝑄 (m3/s) = 𝑉𝑉 ∆𝑉𝑉 =
𝐴𝐴 ∫ 𝑣𝑣(𝑡𝑡)𝑑𝑑𝑡𝑡𝑡𝑡1𝑡𝑡2
∆𝑉𝑉 = 𝐴𝐴 × 𝐴𝐴𝑉𝑉,
(𝑉𝑉: volume, 𝐴𝐴: mean area of 3 times in each interrogation point). (6)
𝑉𝑉𝑄𝑄 𝐸𝐸𝑄𝑄 =
𝐴𝐴1 × 𝐴𝐴𝑃𝑃𝑉𝑉inspiratory 𝐴𝐴2 × 𝐴𝐴𝑃𝑃𝑉𝑉expiratory ≅
𝐴𝐴𝑃𝑃𝑉𝑉inspiratory 𝐴𝐴𝑃𝑃𝑉𝑉expiratory,
if difference between A1 and A2 is ignorable in the same vessel during
inspiratory and expiratory phases (A1, A2: areas of A1 and A2 vessels). (7)
𝑃𝑃𝑃𝑃𝑁𝑁 = Antegrade flow−Retrograde flowAntegrade flow × 100.
𝑁𝑁𝐴𝐴𝑁𝑁𝑉𝑉 = 𝑉𝑉𝑉𝑉𝑉𝑉systole(antegrade)+ 𝑉𝑉𝑉𝑉𝑉𝑉diastole(antegrade)– 𝑉𝑉𝑉𝑉𝑉𝑉inreversal(retrograde).
𝑉𝑉𝑉𝑉𝑉𝑉 (m) = ∫ 𝑣𝑣(𝑡𝑡)𝑑𝑑𝑡𝑡𝑡𝑡1𝑡𝑡2 , 𝑡𝑡: time, 𝑣𝑣: velocity. (1)
𝐴𝐴𝑉𝑉 (m/s) =𝑉𝑉𝑉𝑉𝑉𝑉 ∆𝑉𝑉 =∫ 𝑣𝑣(𝑡𝑡)𝑑𝑑𝑡𝑡𝑡𝑡1𝑡𝑡2
∆𝑉𝑉 , ∆𝑉𝑉: time interval (𝑡𝑡2− 𝑡𝑡1). (2)
𝑃𝑃𝑉𝑉𝑃𝑃 =Maximal peak velocity – Minimal peak velocity𝐴𝐴𝑉𝑉 . (3)
𝑅𝑅𝑉𝑉𝑉𝑉 =𝑉𝑉𝑉𝑉𝑉𝑉inspiratory maximum –𝑉𝑉𝑉𝑉𝑉𝑉expiratory minimum
𝑉𝑉𝑉𝑉𝑉𝑉Average . (4)
𝑁𝑁𝐴𝐴𝑁𝑁𝑉𝑉 (m) = 𝑉𝑉𝑉𝑉𝑉𝑉systole+ 𝑉𝑉𝑉𝑉𝑉𝑉diastole– VTIreversal. (5)
𝑄𝑄 (m3/s) = 𝑉𝑉 ∆𝑉𝑉 =
𝐴𝐴 ∫ 𝑣𝑣(𝑡𝑡)𝑑𝑑𝑡𝑡𝑡𝑡1𝑡𝑡2
∆𝑉𝑉 = 𝐴𝐴 × 𝐴𝐴𝑉𝑉,
(𝑉𝑉: volume, 𝐴𝐴: mean area of 3 times in each interrogation point). (6)
𝑉𝑉𝑄𝑄 𝐸𝐸𝑄𝑄 =
𝐴𝐴1 × 𝐴𝐴𝑃𝑃𝑉𝑉inspiratory 𝐴𝐴2 × 𝐴𝐴𝑃𝑃𝑉𝑉expiratory ≅
𝐴𝐴𝑃𝑃𝑉𝑉inspiratory 𝐴𝐴𝑃𝑃𝑉𝑉expiratory,
if difference between A1 and A2 is ignorable in the same vessel during
inspiratory and expiratory phases (A1, A2: areas of A1 and A2 vessels). (7)
𝑃𝑃𝑃𝑃𝑁𝑁 = Antegrade flow−Retrograde flowAntegrade flow × 100.
𝑁𝑁𝐴𝐴𝑁𝑁𝑉𝑉 = 𝑉𝑉𝑉𝑉𝑉𝑉systole(antegrade)+ 𝑉𝑉𝑉𝑉𝑉𝑉diastole(antegrade)– 𝑉𝑉𝑉𝑉𝑉𝑉inreversal(retrograde). In the present study, NAFI was represented as follows:
𝑉𝑉𝑉𝑉𝑉𝑉 (m) = ∫ 𝑣𝑣(𝑡𝑡)𝑑𝑑𝑡𝑡𝑡𝑡1𝑡𝑡2 , 𝑡𝑡: time, 𝑣𝑣: velocity. (1)
𝐴𝐴𝑉𝑉 (m/s) =𝑉𝑉𝑉𝑉𝑉𝑉 ∆𝑉𝑉 =∫ 𝑣𝑣(𝑡𝑡)𝑑𝑑𝑡𝑡𝑡𝑡1𝑡𝑡2
∆𝑉𝑉 , ∆𝑉𝑉: time interval (𝑡𝑡2− 𝑡𝑡1). (2)
𝑃𝑃𝑉𝑉𝑃𝑃 =Maximal peak velocity – Minimal peak velocity𝐴𝐴𝑉𝑉 . (3)
𝑅𝑅𝑉𝑉𝑉𝑉 =𝑉𝑉𝑉𝑉𝑉𝑉inspiratory maximum –𝑉𝑉𝑉𝑉𝑉𝑉expiratory minimum
𝑉𝑉𝑉𝑉𝑉𝑉Average . (4)
𝑁𝑁𝐴𝐴𝑁𝑁𝑉𝑉 (m) = 𝑉𝑉𝑉𝑉𝑉𝑉systole+ 𝑉𝑉𝑉𝑉𝑉𝑉diastole– VTIreversal. (5)
𝑄𝑄 (m3/s) = 𝑉𝑉 ∆𝑉𝑉 =
𝐴𝐴 ∫ 𝑣𝑣(𝑡𝑡)𝑑𝑑𝑡𝑡𝑡𝑡1𝑡𝑡2
∆𝑉𝑉 = 𝐴𝐴 × 𝐴𝐴𝑉𝑉,
(𝑉𝑉: volume, 𝐴𝐴: mean area of 3 times in each interrogation point). (6)
𝑉𝑉𝑄𝑄 𝐸𝐸𝑄𝑄 =
𝐴𝐴1 × 𝐴𝐴𝑃𝑃𝑉𝑉inspiratory 𝐴𝐴2 × 𝐴𝐴𝑃𝑃𝑉𝑉expiratory ≅
𝐴𝐴𝑃𝑃𝑉𝑉inspiratory 𝐴𝐴𝑃𝑃𝑉𝑉expiratory,
if difference between A1 and A2 is ignorable in the same vessel during
inspiratory and expiratory phases (A1, A2: areas of A1 and A2 vessels). (7)
𝑃𝑃𝑃𝑃𝑁𝑁 = Antegrade flow−Retrograde flowAntegrade flow × 100.
𝑁𝑁𝐴𝐴𝑁𝑁𝑉𝑉 = 𝑉𝑉𝑉𝑉𝑉𝑉systole(antegrade)+ 𝑉𝑉𝑉𝑉𝑉𝑉diastole(antegrade)– 𝑉𝑉𝑉𝑉𝑉𝑉inreversal(retrograde).
𝑉𝑉𝑉𝑉𝑉𝑉 (m) = ∫ 𝑣𝑣(𝑡𝑡)𝑑𝑑𝑡𝑡𝑡𝑡1𝑡𝑡2 , 𝑡𝑡: time, 𝑣𝑣: velocity. (1)
𝐴𝐴𝑉𝑉 (m/s) =𝑉𝑉𝑉𝑉𝑉𝑉 ∆𝑉𝑉 =∫ 𝑣𝑣(𝑡𝑡)𝑑𝑑𝑡𝑡𝑡𝑡1𝑡𝑡2
∆𝑉𝑉 , ∆𝑉𝑉: time interval (𝑡𝑡2− 𝑡𝑡1). (2)
𝑃𝑃𝑉𝑉𝑃𝑃 =Maximal peak velocity – Minimal peak velocity𝐴𝐴𝑉𝑉 . (3)
𝑅𝑅𝑉𝑉𝑉𝑉 =𝑉𝑉𝑉𝑉𝑉𝑉inspiratory maximum –𝑉𝑉𝑉𝑉𝑉𝑉expiratory minimum
𝑉𝑉𝑉𝑉𝑉𝑉Average . (4)
𝑁𝑁𝐴𝐴𝑁𝑁𝑉𝑉 (m) = 𝑉𝑉𝑉𝑉𝑉𝑉systole+ 𝑉𝑉𝑉𝑉𝑉𝑉diastole– VTIreversal. (5)
𝑄𝑄 (m3/s) = 𝑉𝑉 ∆𝑉𝑉 =
𝐴𝐴 ∫ 𝑣𝑣(𝑡𝑡)𝑑𝑑𝑡𝑡𝑡𝑡1𝑡𝑡2
∆𝑉𝑉 = 𝐴𝐴 × 𝐴𝐴𝑉𝑉,
(𝑉𝑉: volume, 𝐴𝐴: mean area of 3 times in each interrogation point). (6)
𝑉𝑉𝑄𝑄 𝐸𝐸𝑄𝑄 =
𝐴𝐴1 × 𝐴𝐴𝑃𝑃𝑉𝑉inspiratory 𝐴𝐴2 × 𝐴𝐴𝑃𝑃𝑉𝑉expiratory ≅
𝐴𝐴𝑃𝑃𝑉𝑉inspiratory 𝐴𝐴𝑃𝑃𝑉𝑉expiratory,
if difference between A1 and A2 is ignorable in the same vessel during
inspiratory and expiratory phases (A1, A2: areas of A1 and A2 vessels). (7)
𝑃𝑃𝑃𝑃𝑁𝑁 = Antegrade flow−Retrograde flowAntegrade flow × 100.
𝑁𝑁𝐴𝐴𝑁𝑁𝑉𝑉 = 𝑉𝑉𝑉𝑉𝑉𝑉systole(antegrade)+ 𝑉𝑉𝑉𝑉𝑉𝑉diastole(antegrade)– 𝑉𝑉𝑉𝑉𝑉𝑉inreversal(retrograde).
The PUF in the previous study may have similarities to NAFI in our study in terms of estimating the degree of forward flow, although mathematical measurements were different. Our re-sults showed that NAFI in TCPC and ECC were prominently increased, compared with those in APC and in LT Fontan re-spectively, and that NAFI during inspiration is prominent, compared with that during expiration in all Fontan groups. Therefore, inspiratory drive in TCPC Fontan circuits may pro-vide efficient forward force in Fontan circulation.
Inspiration has important influences on infra-diaphragmatic venous return in TCPC Fontan, and the resting flow of the IVC in TCPC has been found to be greater during inspiration than during expiration.22,23 We investigated the ratio of inspiratory and expiratory blood flows (IQ/EQ) as a parameter of the in-spiratory effect. Our investigation showed similar patterns to those of previous studies. The IQ/EQ in TCPC showed signifi-cant increases, compared with the IQ/EQ in APC, in most ves-sels. Therefore, our results confirm that TCPC Fontan is more influenced by respiration than APC Fontan and that the inspi-ratory forward flow makes TCPC circulation more efficient than APC Fontan.
63 https://doi.org/10.3349/ymj.2019.60.1.56
the baffle of LT. Further, the PIxs in the conduit of ECC regard-less of the respiratory cycles decreased compared with the PIxs in the baffle of LT despite the statistically insignificant differences. Therefore, the conduit of ECC Fontan is less influ-enced by pulsatility and more influinflu-enced by respiration and has a more efficient forward tract than the baffle of LT Fontan. Although a simple comparison of the conduit of ECC with the baffle of LT would not be a representative comparison of ECC Fontan and LT Fontan, it can partially explain the Fontan he-modynamics.
This study has several limitations. Determination of blood flow characteristics using intravascular Doppler ultrasonogra-phy may have inherent problems of echocardiograultrasonogra-phy includ-ing potential intra- and inter-observer variability. Also, geomet-rical variations in shape and spatial relationship of the actual vessels and conduits, which may introduce hemodynamic bi-ases, were not considered in application to mathematical equations for data collection. However, we tried to maximize the accuracy of data for each parameter by obtaining Doppler spectrals with optimal Doppler intercept angles and position-ing at all measurement points. Also, we obtained multiple (at least 5) Doppler spectrals in observed vessels and/or conduits, discarded minimal and maximal values, and averaged the rest of the values.
Our study revealed that cardiac pulsatility is less influential in TCPC than the APC Fontan and the least influential in the ECC Fontan in TCPC. More pulsatility of the HV in APC group according to the atrial contraction may lead to resultant reverse flow and pressure stress, which may potentially expose the patients prone to development of Fontan complications, such as Fontan hepatopathy. On the other hand, theoretically, less pulsatility of the LPA and RPA in TCPC may potentially be as-sociated with endothelial dysfunction with resultant increases in pulmonary vascular resistance in the long term. Also, pul-monary circulation in patients after TCPC type palliation with higher respiratory dependency may more easily be compro-mised in the clinical setting of depressed respiratory efforts, such as positive pressure ventilation. In terms of flow efficiency, TCPC type Fontan circuits are more efficient than APC Fontan circuit.
There have been a few studies on differential flow charac-teristics in different types of Fontan circulation including our study.4 Previous studies have found that flow patterns vary ac-cording to the types of Fontan circuit, which may have clinical impact on management after Fontan-type operation. Howev-er even though the diffHowev-erence in flow pattHowev-erns could be com-pared between groups of different Fontan circuit, there has been no clinically useful quantitative parameter(s) to charac-terize the flow pattern in a given patient and it might frequently have been difficult to translate the study findings in individual patient, as substantial proportion of patients have mixed fea-tures of typical flow patterns in different Fontan circuit. We conducted this study to evaluate the flow characteristics of
dif-ferent Fontan circuits as well as to develop and verify parame-ters to characterize flow patterns that can be used for strategic management and establishing clinical decision in real practice. This study differs in many aspects from our previous prelimi-nary study already published. First of all, the subject and study period are different. We performed this study with a new da-taset, excluding data from patients with exaggerated or de-pressed respiratory influence on flow patterns, and collected further data from patients with appropriate respiratory effort during IDE study with refined techniques, overcoming the ini-tial learning period in IDE measurements. As a result, the ma-jority of subjects (22/35) in this study are different from the population studied in our previous study. This study is also unique in terms of measurement and analysis tools. We used novel parameters that were designed to reflect the influences of cardiac/respiratory cycles and flow efficiency, such as PIx, RVI, NAFI, MFR and IQ/EQ, instead of simple primary values from Doppler measurements in our preliminary study (e.g., AV and VTI), Moreover, this study suggests the quantitative parameters by means of NAFI and Q (MFR) to explain flow ef-ficiencies of Fontan circuits, whereas our previous study only used the reverse flows of AV and VTI to explain them. Lastly, the analysis methods of raw data are also different. Our previ-ous study analyzed mean values of several consecutive cardiac waves during total inspiratory phase or total expiratory phase. However, the current study focuses on isolated values of max-imal and minmax-imal value during total respiratory phase partic-ularly in PIx and RVI.
In conclusion, patients with different types of Fontan circu-lation show different hemodynamic characteristics in various territories of the Fontan circuit, which may lead to different risks for long-term complications. We believe that the novel parameters developed in this study may be used to determine flow characteristics and serve as a clinical basis of manage-ment in patients after Fontan operations.
ACKNOWLEDGEMENTS
This research was supported by a research grant from the Ko-rean Society of Cardiology (201103-19).
ORCID iDs
Kee Soo Ha https://orcid.org/0000-0001-6753-5411 Jae Young Choi https://orcid.org/0000-0002-1247-6669 Se Yong Jung https://orcid.org/0000-0003-1337-563X Han Ki Park https://orcid.org/0000-0002-7472-7822
REFERENCES
1. Said SM, Burkhart HM, Schaff HV, Cetta F, Driscoll DJ, Li Z, et al. Fontan conversion: identifying the high-risk patient. Ann Thorac Surg 2014;97:2115-21.
64 https://doi.org/10.3349/ymj.2019.60.1.56 Wheaton GR, et al. The Fontan procedure: contemporary
tech-niques have improved long-term outcomes. Circulation 2007;116 (11 Suppl):I157-64.
3. Ninan M, Myers JL. Conversion of the atriopulmonary Fontan connection to a total cavopulmonary connection. Semin Thorac Cardiovasc Surg Pediatr Card Surg Annu 1998;1:23-30.
4. Ha KS, Choi JY, Jung JW, Kim NK. Impact of flow differentials ac-cording to cardiac and respiratory cycles on three types of Fontan operation. Pediatr Cardiol 2018;39:1144-55.
5. Snider AR, Serwer GA, Ritter SB. Methods for obtaining quantita-tive information from the echocardiographic examination. In: Snider AR, Gersony RA, Serwer GA, Ritter SB, editors. Echocar-diography in pediatric heart disease. 2nd ed. St. Louis (MO): Mos-by; 1997. p.133-234.
6. Paz R, Mohiaddin RH, Longmore DB. Magnetic resonance as-sessment of the pulmonary arterial trunk anatomy, flow, pulsatil-ity and distensibilpulsatil-ity. Eur Heart J 1993;14:1524-30.
7. Choi JY, Kwon HS, Yoo BW, Shin JI, Sul JH, Park HK, et al. Right ventricular restrictive physiology in repaired tetralogy of Fallot is associated with smaller respiratory variability. Int J Cardiol 2008; 125:28-35.
8. Gray RG, Altmann K, Mosca RS, Prakash A, Williams IA, Quaege-beur JM, et al. Persistent antegrade pulmonary blood flow post-glenn does not alter early post-Fontan outcomes in single-ventri-cle patients. Ann Thorac Surg 2007;84:888-93.
9. Pedersen EM, Stenbøg EV, Frønd T, Houlind K, Kromann O, Sø-rensen KE, et al. Flow during exercise in the total cavopulmonary connection measured by magnetic resonance velocity mapping. Heart 2002;87:554-8.
10. Shabanian R, Mirzaaghayan MR, Dadkhah M, Hosseini M, Ra-himzadeh M, Akbari Asbagh P, et al. Echocardiographic assess-ment of pulmonary arteries pulsatility index in Fontan circula-tion. J Cardiovasc Ultrasound 2015;23:228-32.
11. Klimes K, Abdul-Khaliq H, Ovroutski S, Hui W, Alexi-Meskishvili V, Spors B, et al. Pulmonary and caval blood flow patterns in pa-tients with intracardiac and extracardiac Fontan: a magnetic reso-nance study. Clin Res Cardiol 2007;96:160-7.
12. Greenberg SB, Morrow WR, Imamura M, Drummond-Webb J. Magnetic resonance flow analysis of classic and extracardiac Fon-tan procedures: the seesaw sign. Int J Cardiovasc Imaging 2004;20: 397-405.
13. Arisawa J, Morimoto S, Ikezoe J, Naitoh H, Yamagami H, Kozuka T, et al. Pulsed Doppler echocardiographic assessment of portal
ve-nous flow patterns in patients after the Fontan operation. Br Heart J 1993;69:41-6.
14. Kiesewetter CH, Sheron N, Vettukattill JJ, Hacking N, Stedman B, Millward-Sadler H, et al. Hepatic changes in the failing Fontan circulation. Heart 2007;93:579-84.
15. Navarro-Aguilar V, Flors L, Calvillo P, Merlos P, Buendía F, Igual B, et al. Fontan procedure: imaging of normal post-surgical anatomy and the spectrum of cardiac and extracardiac complications. Clin Radiol 2015;70:295-303.
16. Holmgren D, Berggren H, Wåhlander H, Hallberg M, Myrdal U. Reversal of protein-losing enteropathy in a child with Fontan cir-culation is correlated with central venous pressure after heart transplantation. Pediatr Transplant 2001;5:135-7.
17. Ovroutski S, Ewert P, Alexi-Meskishvili V, Hölscher K, Miera O, Peters B, et al. Absence of pulmonary artery growth after fontan operation and its possible impact on late outcome. Ann Thorac Surg 2009;87:826-31.
18. Raj JU, Kaapa P, Anderson J. Effect of pulsatile flow on microvas-cular resistance in adult rabbit lungs. J Appl Physiol (1985) 1992; 72:73-81.
19. Kaulitz R, Bergman P, Luhmer I, Paul T, Hausdorf G. Instanta-neous pressure-flow velocity relations of systemic venous return in patients with univentricular circulation. Heart 1999;82:294-9. 20. Rosenthal M, Bush A, Deanfield J, Redington A. Comparison of
cardiopulmonary adaptation during exercise in children after the atriopulmonary and total cavopulmonary connection Fontan procedures. Circulation 1995;91:372-8.
21. Be’eri E, Maier SE, Landzberg MJ, Chung T, Geva T. In vivo evalu-ation of Fontan pathway flow dynamics by multidimensional phase-velocity magnetic resonance imaging. Circulation 1998; 98:2873-82.
22. Hsia TY, Khambadkone S, Redington AN, Migliavacca F, Dean-field JE, de Leval MR. Effects of respiration and gravity on infradi-aphragmatic venous flow in normal and Fontan patients. Circula-tion 2000;102(19 Suppl 3):III148-53.
23. Hjortdal VE, Emmertsen K, Stenbøg E, Frønd T, Schmidt MR, Kromann O, et al. Effects of exercise and respiration on blood flow in total cavopulmonary connection: a real-time magnetic reso-nance flow study. Circulation 2003;108:1227-31.