Can Western Based Online Prostate Cancer Risk Calculators
Be Used to Predict Prostate Cancer after Prostate Biopsy
for the Korean Population?
Dong Hoon Lee, Ha Bum Jung, Jae Won Park, Kyu Hyun Kim, Jongchan Kim,
Seung Hwan Lee, and Byung Ha Chung
Department of Urology, Urological Science Institute, Yonsei University College of Medicine, Seoul, Korea.
Received: May 2, 2012 Revised: July 17, 2012 Accepted: July 23, 2012
Corresponding author: Dr. Byung Ha Chung, Department of Urology,
Gangnam Severance Hospital, Yonsei University College of Medicine, 211 Eonju-ro, Gangnam-gu, Seoul 135-720, Korea.
Tel: 82-2-2019-3470, Fax: 82-2-3462-8887 E-mail: chung646@yuhs.ac
∙ The authors have no financial conflicts of interest.
© Copyright:
Yonsei University College of Medicine 2013
This is an Open Access article distributed under the terms of the Creative Commons Attribution Non-Commercial License (http://creativecommons.org/ licenses/by-nc/3.0) which permits unrestricted non-commercial use, distribution, and reproduction in any medium, provided the original work is properly cited.
Purpose: To access the predictive value of the European Randomized Screening of Prostate Cancer Risk Calculator (ERSPC-RC) and the Prostate Cancer
Preven-tion Trial Risk Calculator (PCPT-RC) in the Korean populaPreven-tion. Materials and
Methods: We retrospectively analyzed the data of 517 men who underwent tran-srectal ultrasound guided prostate biopsy between January 2008 and November 2010. Simple and multiple logistic regression analysis were performed to compare the result of prostate biopsy. Area under the receiver operating characteristics curves (AUC-ROC) and calibration plots were prepared for further analysis to compare the risk calculators and other clinical variables. Results: Prostate cancer was diagnosed in 125 (24.1%) men. For prostate cancer prediction, the area under curve (AUC) of the ERSPC-RC was 77.4%. This result was significantly greater than the AUCs of the PCPT-RC and the prostate-specific antigen (PSA) (64.5% and 64.1%, respectively, p<0.01), but not significantly different from the AUC of
the PSA density (PSAD) (76.1%, p=0.540). When the results of the calibration
plots were compared, the ERSPC-RC plot was more constant than that of PSAD.
Conclusion: The ERSPC-RC was better than PCPT-RC and PSA in predicting prostate cancer risk in the present study. However, the difference in performance between the ERSPC-RC and PSAD was not significant. Therefore, the Western based prostate cancer risk calculators are not useful for urologists in predicting prostate cancer in the Korean population.
Key Words: Korean, prostate cancer, biopsy, nomogram, validation study
INTRODUCTION
PCPT-RC variables of PSA level, abnormalities of DRE, prior status of biopsy and history of 5-ARI use, the two ad-ditional predictors of prostate volume and TRUS findings were used. In the ERSPC-RC, PSA was doubled for pa-tients taking a 5-ARI more than 1 year before performing risk calculations, although the use of 5-ARI is not a vari-able for ERSPC-RC. PSA doubling was already accounted for as a variable in the risk calculations of the PCPT-RC. And we used the ERSPC-RC 4 to calculate risks for pa-tients undergoing initial biopsy, whereas the ERSPC-RC 5 was used for those who had a previous negative biopsy.
Statistical analysis
Continuous variables were reported as median and range values and categorical variables were reported as their number and frequency. Chi-square tests and ANOVA were used for statistical comparison of continuous and categori-cal variables, respectively. Simple and multiple logistic re-gressions were performed to identify independent predic-tors of prostate cancer during biopsy. The area under the receiver operating characteristics curve (AUC) was calcu-lated for both risk calculators, PSA and PSAD for PSA screening cohort. Differences in predictive accuracy esti-mates were tested for statistical significance using the Hos-mer and Lemeshow test. Performance characteristics of the risk calculators were examined using calibration plots, where the x-axis represented the predicted probability and the y-axis represented the actual observed proportion of positive biopsy results.
All tests were two-sided with significance noted at 0.05. Statistical analyses were performed using the SAS statisti-cal package (Version 9.1; SAS Institute, Cary, NC, USA).
RESULTS
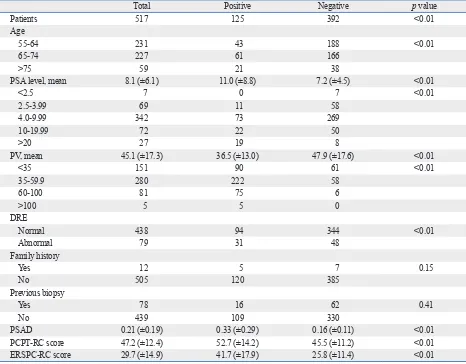
Prostate cancer was diagnosed in 125 patients (24.1%). The characteristics of the total study population of 517 patients are shown in Table 1. In the simple logistic regression anal-ysis, family history, previous biopsy history and history of 5-ARI use were not statistically significant predictors of prostate cancer. In the multiple logistic regression analysis with a backward variable selection procedure, the signifi-cant predictors of prostate cancer were age, PV, and PSA level (Table 2).
A significantly higher AUC was observed for the ERSPC-RC (77.4%) compared to the PCPT-ERSPC-RC (64.5%) and PSA
Prostate Cancer (ERSPC)3-5 and the Prostate Cancer
Pre-vention Trial (PCPT)6,7 have each introduced online
pros-tate cancer risk calculators (RC). These instruments were created based on 6288 Dutch males and 5519 North Ameri-can males of several different ethnic backgrounds. These prostate cancer risk calculators are based on race, age, se-rum PSA level, prostate volume, family history, outcome of digital rectal exam, transrectal ultrasound (TRUS) findings, and status of prior biopsy. These two online risk calculators were also validated in several Western cohorts.4,8-11
However, no research exists investigating the applicabili-ty of these tools in Asian populations considering the low overall incidence rate of prostate cancer. Therefore, we in-vestigated the predictive ability of the two online calcula-tors-PSA alone and PSA density-to determine whether these tools can be applied in the Korean population.
MATERIALS AND METHODS
A retrospective analysis was performed on 625 male pa-tients who underwent systemic 12-core TRUS-guided biop-sy consecutively in our institution between January 2008 and November 2010. According to limitations of each cal-culator, 24 men with a PSA level <0.5 ng/mL or >50 ng/mL (limitation of ERSPC-RC), 1 man with prostate volume <10 mL or >150 mL (limitation of ERSPC-RC) and 84 men with age <55 years old (limitation of PCPT-RC) were excluded. In total, 122 men were excluded. Therefore, 517 cases were ultimately used for analysis. Patients were re-ferred for biopsy if there was suspicious malignancy, if PSA elevation was observed during follow-up and/or if PSA >4.0 at initial screening without evidence of benign condition for PSA elevation.
Clinical factors evaluation
To obtain risk estimates, necessary predictor variables for the tools were gathered, including age, family history, status of prior prostate biopsy, PSA level, prostate volume, distal rectal exam (DRE) findings, TRUS findings and history of 5-alpha reductase inhibitor (5-ARI) use. PSA density (PSAD) was calculated by dividing the PSA level by the prostate volume.
Risk calculators
64.3%, for PSA level alone of 63.6% and for PSAD of 76.9%. In the PSAD over 0.15 group, the ROC analyses showed respective AUC values of 75.3%, 61.2%, 56%, and 71.1%. Statistically significant differences were also ob-served between the ERSPC-RC and the PCPT-RC and PSA in the two separate groups. However, there was no statisti-level alone (64.1%) in the total patient group (p<0.01).
How-ever, there was no statistically significant difference in AUC between the ERSPC-RC (77.4%) and PSAD (76.1%)
(p=0.54) (Fig. 1A). When we compared the AUCs in the
[image:3.595.72.538.172.536.2]over 4.0 ng/mL PSA group, the ROC analyses showed an AUC for the ERSPC-RC of 77.7%, for the PCPT-RC of
Table 1. Baseline Characteristics of Patients
Total Positive Negative p value
Patients 517 125 392 <0.01
Age
55-64 231 43 188 <0.01
65-74 227 61 166
>75 59 21 38
PSA level, mean 8.1 (±6.1) 11.0 (±8.8) 7.2 (±4.5) <0.01
<2.5 7 0 7 <0.01
2.5-3.99 69 11 58
4.0-9.99 342 73 269
10-19.99 72 22 50
>20 27 19 8
PV, mean 45.1 (±17.3) 36.5 (±13.0) 47.9 (±17.6) <0.01
<35 151 90 61 <0.01
35-59.9 280 222 58
60-100 81 75 6
>100 5 5 0
DRE
Normal 438 94 344 <0.01
Abnormal 79 31 48
Family history
Yes 12 5 7 0.15
No 505 120 385
Previous biopsy
Yes 78 16 62 0.41
No 439 109 330
PSAD 0.21 (±0.19) 0.33 (±0.29) 0.16 (±0.11) <0.01
PCPT-RC score 47.2 (±12.4) 52.7 (±14.2) 45.5 (±11.2) <0.01
ERSPC-RC score 29.7 (±14.9) 41.7 (±17.9) 25.8 (±11.4) <0.01
PSA, prostate-specific antigen; PV, prostate volume; DRE, distal rectal examination; PSAD, PSA density; PCPT-RC, Prostate Cancer Prevention Trial Risk Calculator; ERSPC-RC, European Randomized Study for Screening in Prostate Cancer Risk Calculator.
Table 2. Simple and Multiple Logistic Regression Analysis for Biopsy Outcome
Variable Univariate Multiple
OR (95% CI) p value OR (95% CI) p value
Age 1.044 (1.015-1.075) <0.01 1.051 (1.015-1.088) <0.01
Family history 1.159 (0.823-1.984) 0.16
Previous biopsy 0.781 (0.433-1.410) 0.41
Use of 5-ARI 7.017 (0.934-52.695) 0.06
TRUS 2.471 (1.454-4.201) <0.01 1.484 (0.773-2.851) 0.24
DRE 2.363 (1.425-3.920) <0.01 1.708 (0.924-3.157) 0.09
PV 0.948 (0.932-0.964) <0.01 0.940 (0.923-0.958) <0.01
PSA 1.100 (1.062-1.138) <0.01 1.120 (1.072-1.170) <0.01
[image:3.595.71.540.581.709.2]cally significant difference between the AUC values for ERSPC-RC and PSAD among these two groups (Fig. 1B and C, Table 3).
Analyzing the calibration plots for the total patient group, both risk calculators tended to overestimate the risk of posi-tive biopsy. However, the overestimation of the ERSPC-RC tended to less than that of the PCPT-ERSPC-RC. When com-paring the ERSPC-RC and PSAD, the ERSPC-RC showed overall better calibration than PSAD, as shown in Fig. 2 (Hosmer and Lemeshow Goodness-of-Fit Test Pr>ChiSq 0.19 for ERSPC, 0.02 for PSAD).
DISCUSSION
[image:4.595.60.526.81.259.2]Various efforts to develop predictive models for prostate cancer based on clinical, laboratory, ultrasonography and
Table 3. Comparison of Areas Under Receiving Operating Characteristics Curves for the ERSPC-RC, the PCPT-RC, PSA, and PSAD
AUC 95% CI p value
ERSPC PCPT PSAD PSA
Total cohort
ERSPC 0.774 0.725-0.824 - <0.01 0.54 <0.01
PCPT 0.645 0.586-0.704 <0.01 - <0.01 0.87
PSAD 0.761 0.713-0.810 0.54 <0.01 - <0.01
PSA 0.642 0.584-0.700 <0.01 0.87 <0.01
-PSA >4.0
ERSPC 0.777 0.725-0.829 - <0.01 0.73 <0.01
PCPT 0.643 0.580-0.706 <0.01 - <0.01 0.77
PSAD 0.770 0.720-0.820 0.73 <0.01 - <0.01
PSA 0.636 0.575-0.698 <0.01 0.77 <0.01
-PSAD >0.15
ERSPC 0.753 0.689-0.817 - <0.01 0.19 <0.01
PCPT 0.613 0.537-0.689 <0.01 - <0.01 0.05
PSAD 0.711 0.641-0.781 0.19 <0.01 - <0.01
PSA 0.560 0.481-0.640 <0.01 0.05 <0.01
[image:4.595.60.526.293.452.2]-AUC, area under the curve; CI, confidence interval; ERSPC-RC, European Randomized Screening of Prostate Cancer Risk Calculator; PCPT-RC, Prostate Can-cer Prevention Trial Risk Calculator; PSA, prostate-specific antigen; PSAD, PSA density.
Fig. 1. Receiving operating characteristics curves for the ERSPC-RC, the PCPT-RC, PSA, and PSAD for (A) the total patient group, (B) the group with PSA >4.0 ng/mL, (C) the group with PSAD >0.15. ERSPC-RC, European Randomized Screening of Prostate Cancer Risk Calculator; PCPT-RC, Prostate Cancer Prevention Trial Risk Calculator; PSA, prostate-specific antigen; PSAD, PSA density.
Fig. 2. Calibration plot between predicted and observed probabilities of posi-tive biopsy in the total cohort. ERSPC, European Randomized Screening of Prostate Cancer; PCPT, Prostate Cancer Prevention Trial; PSA, prostate-specific antigen; PSAD, PSA density.
0.00 0.00 0.00
0.25 0.25 0.25
0.50 0.50 0.50
0.75 0.75 0.75
1.00 1.00 1.00
Se
ns
iti
vit
y
Se
ns
iti
vit
y
Se
ns
iti
vit
y
0.00 0.25 0.50 0.75 1.00 0.00 0.25 0.50 0.75 1.00 0.00 0.25 0.50 0.75 1.00
1-specificity 1-specificity 1-specificity
ERSPC PCPT PSAD PSA
ERSPC PCPT PSAD PSA
ERSPC PCPT PSAD PSA
A B C
0 10 20 30 40 50 60 70 80
0 10 20 30 40 50 60 70 80
ERSPC PCPT PSAD PSA
Ob
se
rv
ed
w
ith
c
an
ce
r (
%
)
[image:4.595.57.281.493.686.2]RC for predicting prostate cancer is higher than that of PSA level alone.8,13,14 However, we found that there was no
sta-tistically significant difference observed in the present study. The PCPT-RC demonstrates that ethnicity and family histo-ry are the one of variables for predicting prostate cancer; however, the inclusion of ‘other races’ including Asian as a variable option reduces its ability to predict prostate cancer based on self-regulation. Another reason that we failed to observe a significant difference in the performance of PCPT-RC is that patients who had a family history of prostate cancer are not as prevalent in Asians compared with West-ern cohorts. Many urologists in Korea find it difficult to un-cover a patient’s actual family history in Korean prostate cancer patients.15 The percentage of patients with a family
history of prostate cancer was 2.3% (12 of 517 patients) in our total cohort. Just ten years ago, information about pros-tate cancer did not receive much attention in developing Asian countries, including Korea. For these reasons, the PCPT-RC has structural limitations to predict prostate can-cer for Asians although it was proven to be effective in sev-eral Western cohorts.
The ERSPC-RC performed better than the other predic-tors according to the AUC values, although not statistically different from PSAD. For ERSPC-RC, prostate volume and TRUS abnormality must be gathered precisely by per-forming TRUS, but this tool does not include race or a fam-ily history of cancer, in contrast to the PCPT-RC. In Korea, urologists typically perform TRUS for patients who visited the out-patient clinic as the initial evaluation tool to mea-sure the prostate size. DRE information and TRUS abnor-mality is also gathered when TRUS is performed. There-fore, the ERSPC-RC appears to have more predictable power than the PCPT-RC according to the differences of the accuracy in the variables that were gathered for each tool. ERSPC-RC showed a slightly improved performance for predicting prostate cancer based on the effect of the oth-er added information from TRUS and DRE in comparison with PSAD, which is calculated using PSA levels and pros-tate volume.
Nevertheless, compared to another Western studies, the AUC-based value of performance of the ERSPC-RC is low-er in our Korean cohort.4,9-11,16 This result is reflected in the
significant differences in clinical characteristics of prostate cancer such as PSA level, rate of DRE abnormalities and prostate volume in different races.17,18 Therefore, the racial
differences affect the accuracy of this nomogram. For the ERSPC-RC to achieve better performance than PSAD and magnetic resonance imaging results have been given toward
improving the rate of prostate cancer detection. However, many urologists commonly use PSA level alone, PSAD, PSA velocity, DRE findings or TRUS findings in the practi-cal clinic.
Recently, two prostate cancer risk calculators for the pre-diction of prostate cancer were developed and validated in several cohorts.4,8-11 Several studies reported that these tools
are more beneficial than PSA alone in the assessment and decision making for patients with a risk of prostate cancer. Several external validation reports have shown that using PCPT-RC and ERSPC-RC improve prediction compared to using PSA alone when determining when to perform a
bi-opsy.8,9 Also, some studies have found ERSPC-RC to have
more prediction power and more accurately estimate the risk for prostate cancer compared to the PCPT-RC.4,10,11
Howev-er, there are no studies investigating the validity of the ER-SPC-RC or the PCPT-RC in Asians. There are also no stud-ies comparing the two calculators in Asian populations.
External validations of the objectivity of nomograms are important to confirm the performance of these tests because they are often useful only for the cohorts from which they were developed. In addition, there is a limited efficacy of nomograms when externally validated with other study co-horts. Furthermore, it is possible to develop a novel nomo-gram for Korean to predict prostate cancer with our data-base rather than investigating the validity of Western data-based nomograms. However, there are over 100 different pub-lished prediction nomograms for prostate cancer through July 2007 in the field of urology.12 Therefore, the present
analysis aimed to address these concerns. Another main concern is that these two popular prostate cancer risk calcu-lators were released on the internet to the general public and can be confusing to patients who are worried about their own risk of prostate cancer. Therefore, external validation is needed to determine the objective performance of these on-line prostate cancer risk calculators.
In the present study, the ERSPC-RC is a better prediction tool of prostate cancer after biopsy than the PCPT-RC, al-though the ERSPC-RC uses only five variables in compari-son to the seven variables of the PCPT-RC. When we com-pared the four predictive tools we found similar AUCs for ROC curves between the ERSPC-RC and PSAD and be-tween PCPT-RC and PSA level. This result is similar in two separate groups (PSA over 4.0 ng/mL group and PSAD over 0.15 group).
PCPT-REFERENCES
1. Shin HR, Masuyer E, Ferlay J, Curado MP; Asian Contributors to CI5 IX4. Cancer in Asia - Incidence rates based on data in cancer incidence in five continents IX (1998-2002). Asian Pac J Cancer Prev 2010;11 Suppl 2:11-6.
2. Lee DH, Jung HB, Chung MS, Lee SH, Chung BH. The change of prostate cancer treatment in Korea: 5 year analysis of a single institution. Yonsei Med J 2013;54:87-91.
3. Kranse R, Roobol M, Schröder FH. A graphical device to repre-sent the outcomes of a logistic regression analysis. Prostate 2008; 68:1674-80.
4. van den Bergh RC, Roobol MJ, Wolters T, van Leeuwen PJ, Schröder FH. The Prostate Cancer Prevention Trial and European Randomized Study of Screening for Prostate Cancer risk calcula-tors indicating a positive prostate biopsy: a comparison. BJU Int 2008;102:1068-73.
5. Online Prostate Cancer Prevention Trial Risk Calculator. http:// prostastecancerinfolink.net/risk-prevention/pcpt-prostate-cancer-risk-calculator/.
6. Thompson IM, Goodman PJ, Tangen CM, Lucia MS, Miller GJ, Ford LG, et al. The influence of finasteride on the development of prostate cancer. N Engl J Med 2003;349:215-24.
7. Online European Randomized Trial of Prostate Cancer. http:// www.prostatecancer-riskcalculator.com/.
8. Hernandez DJ, Han M, Humphreys EB, Mangold LA, Taneja SS, Childs SJ, et al. Predicting the outcome of prostate biopsy: com-parison of a novel logistic regression-based model, the prostate cancer risk calculator, and prostate-specific antigen level alone. BJU Int 2009;103:609-14.
9. van Vugt HA, Roobol MJ, Busstra M, Kil P, Oomens EH, de Jong IJ, et al. Compliance with biopsy recommendations of a prostate cancer risk calculator. BJU Int 2012;109:1480-8.
10. Cavadas V, Osório L, Sabell F, Teves F, Branco F, Silva-Ramos M. Prostate cancer prevention trial and European randomized study of screening for prostate cancer risk calculators: a performance comparison in a contemporary screened cohort. Eur Urol 2010; 58:551-8.
11. Oliveira M, Marques V, Carvalho AP, Santos A. Head-to-head comparison of two online nomograms for prostate biopsy out-come prediction. BJU Int 2011;107:1780-3.
12. Shariat SF, Karakiewicz PI, Roehrborn CG, Kattan MW. An up-dated catalog of prostate cancer predictive tools. Cancer 2008;113: 3075-99.
13. Eyre SJ, Ankerst DP, Wei JT, Nair PV, Regan MM, Bueti G, et al. Validation in a multiple urology practice cohort of the Prostate Cancer Prevention Trial calculator for predicting prostate cancer detection. J Urol 2009;182:2653-8.
14. Karakiewicz PI, Benayoun S, Kattan MW, Perrotte P, Valiquette L, Scardino PT, et al. Development and validation of a nomogram predicting the outcome of prostate biopsy based on patient age, digital rectal examination and serum prostate specific antigen. J Urol 2005;173:1930-4.
15. Lee SH, Park KK, Chung MS, Chung BH. Clinical features of fa-milial or hereditary prostate cancer in Korean men: a pilot study. Korean J Urol 2011;52:9-12.
16. van Vugt HA, Roobol MJ, Kranse R, Määttänen L, Finne P, Hugos-son J, et al. Prediction of prostate cancer in unscreened men: exter-nal validation of a risk calculator. Eur J Cancer 2011;47:903-9.
to demonstrate similar performance to that in other Western studies, more men who are diagnosed with prostate cancer after prostate biopsy or who have the significant prostate cancer can potentially have more proportion of the abnor-malities on DRE or TRUS than the patients who do not have prostate cancer. However, there is as lower proportion of the abnormalities on DRE or TRUS in Asians, which plays an important role in ERSPC-RC in comparison with West-ern counterparts.17,18
In the evaluation of calibration plots, both risk calculators tended to overestimate the risk of prostate cancer in the present study. Compared with the two risk calculators, the overestimation of the ERSPC-RC was lower than that of the PCPT-RC. The overestimation might be explained due to the differences between the cohorts as the source of the development for each risk calculators, even though the cali-bration plot was affected by multiple factors including sev-eral variables. Interestingly, the analysis of consistency of accuracy between the ERSPC-RC and PSAD showed that the ERSPC-RC more consistently predicts prostate cancer than PSAD. Despite this result, we cannot assume that the ERSPC-RC is more useful than PSAD because there was no significant difference between the AUC values between the ERSPC-RC and PSAD.
There are some limitations in this study. It is unknown how many urologists use nomograms to predict prostate cancer before prostate biopsy pathology is reported or to decide when to perform a biopsy. We can gain sufficient in-formation using the PSA, DRE and TRUS including pros-tate volume clinically. PSA and prospros-tate volume have been proven to be excellent tools to decide when to perform pro-cedure biopsy.19-21 Nevertheless, we analyzed the present
study using Western based prostate cancer risk calculators to externally validate them using Korean cohorts. This study was limited by the small sample size, which could explain why the Western based prostate cancer risk calculators did not show a significant performance when compared to us-ing PSAD for Koreans.
al. Can total and transition zone volume of the prostate determine whether to perform a repeat biopsy? Urology 2003;61:161-6. 20. Ung JO, San Francisco IF, Regan MM, DeWolf WC, Olumi AF.
The relationship of prostate gland volume to extended needle bi-opsy on prostate cancer detection. J Urol 2003;169:130-5. 21. Rietbergen JB, Kruger AE, Hoedemaeker RF, Bangma CH,
Kirkels WJ, Schröder FH. Repeat screening for prostate cancer af-ter 1-year followup in 984 biopsied men: clinical and pathological features of detected cancer. J Urol 1998;160(6 Pt 1):2121-5. 17. Henderson RJ, Eastham JA, Culkin DJ, Kattan MW, Whatley T,
Mata J, et al. Prostate-specific antigen (PSA) and PSA density: ra-cial differences in men without prostate cancer. J Natl Cancer Inst 1997;89:134-8.
18. Swords K, Wallen EM, Pruthi RS. The impact of race on prostate cancer detection and choice of treatment in men undergoing a contemporary extended biopsy approach. Urol Oncol 2010;28: 280-4.