Citation:
Tucker, CB and Anderson, R and Kenny, IC (2014) The Creation and Validation of a Large-Scale Computer Model of the Golf Swing. Proceedings of the 32nd International Conference on Biome-chanics in Sport. ISSN 1999-4168
Link to Leeds Beckett Repository record: http://eprints.leedsbeckett.ac.uk/1400/
Document Version: Article
The aim of the Leeds Beckett Repository is to provide open access to our research, as required by funder policies and permitted by publishers and copyright law.
The Leeds Beckett repository holds a wide range of publications, each of which has been checked for copyright and the relevant embargo period has been applied by the Research Services team.
We operate on a standard take-down policy. If you are the author or publisher of an output and you would like it removed from the repository, please contact us and we will investigate on a case-by-case basis.
THE CREATION AND VALIDATION OF A LARGE-SCALE COMPUTER MODEL
OF THE GOLF SWING
Catherine B. Tucker
1, Ross Anderson
2, Ian C. Kenny
2Leeds Metropolitan University, School of Sport, Headingley Campus, Leeds,
United Kingdom
1Biomechanics Research Unit, University of Limerick, Ireland
2 The aim of this study was to create and validate a full-body musculoskeletal model of a golfer performing a swing with their driver club. An elite female participant performed ten shots with her driver while wearing retro-reflective markers. An optical 3-D 6-camera system captured the kinematics of the markers at 400 Hz on the participant for each trial. A launch monitor device recorded the ball and club head conditions at impact. The kinematic data from one representative trial was selected to drive inverse and forward dynamics simulations of the created model. The validation results showed a very high level of agreement between experimental and simulated trajectories for selected markers (mean r = 0.966)KEY WORDS: kinematics, outcome, simulation validation.
INTRODUCTION: Whilst the goal of the golf swing is relatively simple, it can be a difficult skill to become expert in (Bradshaw et al., 2009). Therefore a more detailed understanding of the mechanics of the movement would be beneficial for golfers and coaches alike. Computer modelling is a technique that has been used more extensively to investigate the golf swing in the last number of years (Nesbit, 2005; Kenny, McCloy, Wallace & Otto, 2008) as it can allow the researcher to study complex interactions between many biomechanical variables such as those present in the golf swing. However, for many models, the means of validation have not been presented in great detail.
Modelling of the golf swing has developed from simplistic 2-D double-pendulum models (Cochran & Stobbs, 1968; Miura, 2001; White, 2006) to more complex 3-D full body models (Nesbit, 2005; Nesbit & Serrano, 2005; Betzler, Hoffmann, Shan & Witte, 2006; Kenny et al., 2008; Nesbit and McGinnis 2009). Models constructed should only be as simplistic or complex as the research question demands. Full-body 3-D models allow for a better representation of the golf swing movement patterns than 2-D models due to the 3-D nature of the golf swing. This advantage of 3-D analysis, coupled with recent advancements in large-scale modelling of the human body, led to the use of a full-body 3-D model of the golf swing in this particular study.
Therefore, the aim of this study was to firstly, develop a large-scale, full-body musculoskeletal human model of a golfer and a driver club and secondly validate the model thus ensuring the human model and its motion in simulations as a valid representation of the participant in question and their motion.
Inc., North Carolina) was used to measure ball and club head characteristics at impact. The launch monitor was calibrated according to the manufacturers’ instructions. The raw marker data were then tracked within the Motion Analysis software, Cortex. A low-pass fourth–order Butterworth filter with a cut-off frequency (Fc) of 12 Hz was applied to the data.
Following this, a representative trial from the ten shots performed was selected to be modelled. The base segment set of the model created in ADAMS/LifeMOD comprised 19 segments. The model was constructed with 42 degrees of freedom. Joints consisted of a torsional spring force with user-specified stiffness, damping angular limits and limit stiffness values. Trainable passive joints for inverse dynamics analysis were created. In order to initiate the movement of the model, inverse and forward dynamics calculations were carried out with the imported motion data of 27 reflective markers on the person and club captured from one representative trial captured during experimentation. A physical environment of driver club and a ground surface was also modelled. With respect to the driver club, a flexible 8-segment graphite shaft (carbon composite) connected the club head hosel to the grip was built. A club head was created that was composed of titanium material and had a mass of 0.2 kg.
In order to ascertain the validity of the model, extra markers were placed on the participant during experimental data collection that were not used to drive the model in the inverse dynamics simulation. These ‘extra’ markers were used to perform a kinematic validation of the model. A Pearson’s correlation analysis was carried out using PASW v18 (SPSS Inc, Chicago, IL, USA) to assess whether the simulated and the experimental curves of these extra markers were closely related. A root mean square difference (RMS) was also conducted to assess the absolute difference between the simulated and experimental curves.
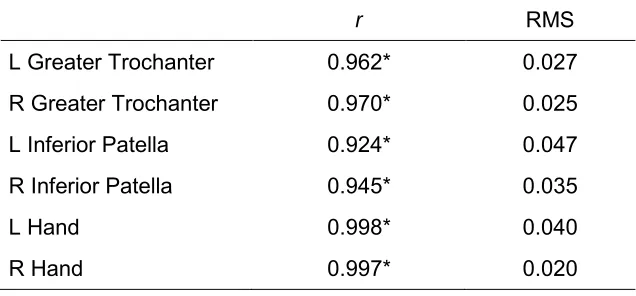
[image:3.595.139.457.487.635.2]RESULTS: The results of the Pearson’s correlation (r) and the RMS between actual and simulated marker paths from the forward dynamics simulation are presented in Table 1. The results of this validation indicated that there was a high level of agreement between simulated and experimental marker trajectories of upper and lower regions of the body. All measures were significantly correlated (p < 0.01).
Table 1:Pearson’s correlation (r) and RMS between simulated and experimental trajectories of
validation marker paths
r RMS
L Greater Trochanter 0.962* 0.027
R Greater Trochanter 0.970* 0.025
L Inferior Patella 0.924* 0.047
R Inferior Patella 0.945* 0.035
L Hand 0.998* 0.040
R Hand 0.997* 0.020
R - Right L - Left
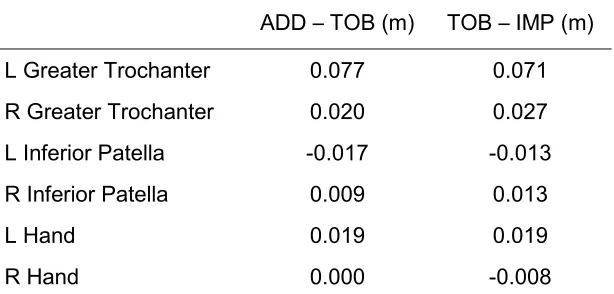
Table 2: Differential values of displacements between experimental (Exp) and model (Mod) for two different phases of the swing
ADD – TOB (m) TOB – IMP (m)
L Greater Trochanter 0.077 0.071
R Greater Trochanter 0.020 0.027
L Inferior Patella -0.017 -0.013
R Inferior Patella 0.009 0.013
L Hand 0.019 0.019
R Hand 0.000 -0.008
Positive value for difference indicates higher displacement for experimental swing Negative value for difference indicates higher displacement for model swing
ADD= Address TOB= Top of Backswing IMP=Impact
The peak club head velocity as measured by a club head toe marker in the model and the club head velocity as measured and calculated by the Vector Pro launch monitor indicated that there was a difference between the experimental and modelled data of 0.26 m/s.
DISCUSSION: Appropriate model validation is a fundamental procedure that must be carried out in any modelling process. With respect to kinematic validation, there was a high level of correlation between simulated and experimental trajectory data for the validation markers listed. The addition of validation markers outside of those used to drive the model is a relatively new development in modelling and has been only reported in the models of Kenny et al. (2006, 2008) in relation to golf swing models. This study has similar findings to that of Kenny et al. (2008) with respect to the correlations and RMS results between simulated and experimental kinematic data. However, with respect to club head velocities there was closer agreement between simulated and experimental values in this study compared to that in Kenny et al. (2008) indicating an improvement on previous models in the literature. The inclusion of these markers enhanced the overall validation process. For the six kinematic measures, there was a strong average correlation value of 0.966 ± 0.03 with all measures significantly correlated. The RMS between experimental and simulated data was low also with an average value of 0.032 ± 0.010 m. The analysis of the differences in displacements of the validation markers showed there were average differences of 0.024 m and 0.025 m for the backswing and downswing phase respectively. This was highlighted in the outcome results with good agreement between the simulated peak club head velocity and the measured club head velocity in experimentation.
REFERENCES:
Betzler, N., Hofmann, M., Shan, G., & Witte, K. (2006). Biomechanical Modelling of a Golf Swing by Means of the Multibody-Kinetics Software “ADAMS”. International Journal of Computer Science in Sport, 5(2), 52-55.
Bradshaw, E. J., Keogh, J. W. L., Hume, P. A., Maulder, P. S., Nortje, J., & Marnewick, M. (2009). The effect of biological movement variability on the performance of the golf swing in high- and
low-handicapped players. Research Quarterly for Exercise and Sport, 80(2), 185-197
Cochran, A. J. and Stobbs, J. (1968). Search for the Perfect Swing, Chicago: Triumph Books. Kenny, I. C., McCloy, A., Wallace, E., & Otto, S. (2008). Segmental sequencing of kinetic energy in a computer-simulated golf swing. Sports Engineering, 11(1), 37-45. doi: 10.1007/s12283-008-0005-0 Kenny, I. C., Wallace, E. S., Brown, D., & Otto, S. R. (2006). Validation of a Full-Body Computer Simulation of the Golf Drive for Clubs of Differing Length. In E. F. Moritz & S. Haake (Eds.), The Engineering of Sport 6 (Vol. 2, pp. 11-16). New York: Springer.
Nesbit, S. M., & McGinnis, R. (2009). Kinematic analyses of the golf swing hub path and its role in golfer/club kinetic transfers. Journal of Sports Science and Medicine, 8(2), 235-246.
Nesbit, S. M. (2005). A Three Dimensional Kinematic and Kinetic Study of the Golf Swing. Journal of
Sports Science and Medicine, 4(4), 499-519. Retrieved from:
http://jsportscimed.org/vol4/n4/17/v4n4-17pdf.pdf
Miura, K. (2001). Parametric acceleration – the effect of inward pull of the golf club at impact stage. [Article]. Sports Engineering, 4(2), 75-86. doi: 10.1046/j.1460-2687.2001.00071.
Nesbit, S. M., & Serrano, M. (2005). Work and Power Analysis of the Golf Swing. Journal of Sports
Science and Medicine, 4(4), 520-533.
White, R. (2006). On the efficiency of the golf swing. American Journal of Physics, 74(12), 1088-1094.
Acknowledgements