© Association of Academic Researchers and Faculties (AARF)
A Monthly Double-Blind Peer Reviewed Refereed Open Access International e-Journal - Included in the International Serial Directories.
Page | 1
OPTIMIZATION SEGMENTATION AND CLASSIFICATION FROM MRI OF BRAIN TUMOR AND ITS LOCATION CALCULATIONUSING MACHINE LEARNING AND
DEEP LEARNING APPROACH
TIRUVEEDULA GOPI KRISHNA1, MOHAMED ABDELDAIEM ABDELHADI2
1
Computer Science and Engineering, Rayalaseema University, India
2
Department of IT, Tripoli University, Libya
ABSTRACT
The manual detection and classification finding correct location and identifying type of tumor becomes a rigorous and hectic task for the radiologists. Medical diagnosis via image processing and machine learning is considered one of the most important issues of artificial intelligence systems. Deep learning has been used successfully in supervised classification tasks in order to learn complex patterns. The main contributions of this paper are as create a more generalized method for brain tumor classification using deep learning a variety of neural networks were constructed based on the preprocessing of image data., analyze the application of tumorless brain images on brain tumor classification and empirically evaluate neural networks on the given datasets with per image accuracy and per patient accuracy. And also presents an efficient image segmentation using machine learning algorithm with some optimization techniques to detect brain tumors.
KEYWORDS – Deep learning, machine learning, classification, segmentation, optimization of MRI brain tumor images
INTRODUCTION
Now days the MR Images are very useful in a Medical field like Medical image
processing. The brain tumor defines the unusual growth of tissues and uncontrolled cells
proliferation so due to this the natural pattern of cell growth and death is failed. The brain
tumor is of two stages:- 1) Primary stage 2) Secondary stage.
International Research Journal of Mathematics, Engineering and IT ISSN: (2348-9766) Association of Academic Researchers and Faculties (AARF)
© Association of Academic Researchers and Faculties (AARF)
A Monthly Double-Blind Peer Reviewed Refereed Open Access International e-Journal - Included in the International Serial Directories.
Page | 2 When tumor spread in any part of brain then it is known as brain tumor. Now when
brain tumor can identified number of symptoms including seizures, mood changing, difficulty
in walking and hearing, vision, and muscular movement etc. brain tumor is classified into
Gliomas, medulloblastoma, epeldymomas, CNS lymphoma and oligodendrogloma. In primary
stage the tumor can be removed but in secondary stage ,the tumor disease spread, due to this
after removal of tumor the seldom remains and grow back again so this is the biggest problem
in the secondary stage of tumor . Why this problem occurs? It occurs due to inaccurately
location of area of tumor. The next step is detection techniques. In this the any segmentation
and detection are to measure detection techniques the imaging of brain tumor can be done by-
1) MRI scanning that is magnetic resonant image 2) CT scanning i.e. computer tomography
3) Ultra sound etc. There are several method to detect an brain tumor by that the tumor method
we can diagnose and detect more easily .some edges are nuclear network algorithm watershed
and edge detection, fuzzy c mean algorithm, asymmetry of brain is used to detect an
abnormality .
The purpose of this research is to develop automated methods to aid doctors in
diagnosis in order to prevent misdiagnosis and decrease patient wait time. In particular, this
research achieves this automation through the classification of brain tumor types from patient
brain images. Images require a doctor to examine multiple image slices to determine health
issues which takes time away from more complex diagnoses. Our goal is to confidentially
identify brain cancer types to reduce doctor burden, leaving the most complex diagnoses to
them.
Training convolutional neural networks to detect types of tumors in brain images improves
classification accuracy and provides initial steps into introducing deep learning into medicine.
Not only does this method produce equal and better results when compared to Cheng et. al.’s
initial work, but neural networks also utilize a more general methodology requiring only an
image to understand brain tumor types. Furthermore, the accuracy per patient metric
consistently remained at the levels of per image accuracy results, implying the neural network
© Association of Academic Researchers and Faculties (AARF)
A Monthly Double-Blind Peer Reviewed Refereed Open Access International e-Journal - Included in the International Serial Directories.
Page | 3 Numbers of shape features are considered in this paper include Major axis length, Minor axis
length, Euler Number, Solidity, Area and Circularity. For the purpose of classification some
machine learning algorithms are used.
RELATEDWORK
N.M. Saad et al [1]. proposed method to detect and classify a brain tumor using
thresholding and a rule-based classifier. Four types of brain tumor depend on
diffusion-weighted imaging were analysed such acute stroke, solid tumor, chronic stroke and necrosis. In
the detection and segmentation stage, the image is divided into 8x8 macro-block regions.
Adaptive thresholding technique is applied to segment the tumor’s region. Statistical features
are measured on the region of interest.
Amanpreet Kaur and Gangandeep Jindal [2] in 2015 has given an approach through which
tumor can be detected effectively using Genetic Algorithm. It has been applied to reduce the
population and then detecting the tumor present in the brain.
Yao-Tien Chen [3], a new method proposes an approach integrating 3D Bayesian level set method with volume rendering for brain tumor and tissue segmentation and rendering.
In an MRI image the highly irregular boundaries of tumor tissues is seen. For a segmentation of
medical image, the deformable modes and region base methods are used. The main problems
are there in MRI images like undefined location of tumor are unseen boundaries or data loss at
boundaries and a silent edge not extended. By using this algorithm the silent edge is extended
and found boundary of tumor location or area and once the boundary or location of tumor is
seen clearly. Then removal of tumor can be take place [4].
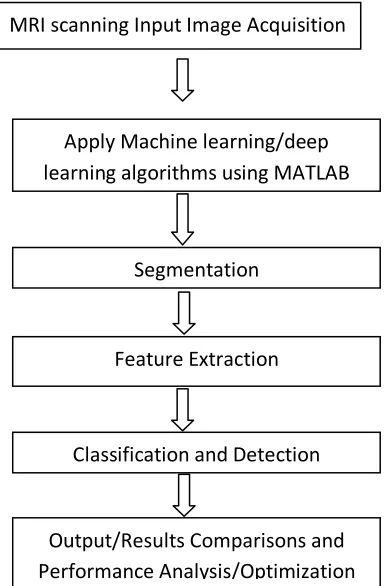
PROPOSED METHOD
The proposed work has been implemented using some of machine learning and deep
learning algorithms to compare their performance. The architecture of proposed method is
illustrated in Fig. 1. MR Image’s acquisition was first step in this method. Detection of
tumor in the brain MR Images includes a number of methods are Sigma filtering, adaptive
threshold and detection region. Shape Features method is used to extract features for MR
© Association of Academic Researchers and Faculties (AARF)
A Monthly Double-Blind Peer Reviewed Refereed Open Access International e-Journal - Included in the International Serial Directories.
Page | 4 MRI scanning Input Image Acquisition
Apply Machine learning/deep learning algorithms using MATLAB
Segmentation
Feature Extraction
Classification and Detection
[image:4.612.241.436.49.342.2] [image:4.612.97.527.416.600.2]Output/Results Comparisons and Performance Analysis/Optimization
© Association of Academic Researchers and Faculties (AARF)
A Monthly Double-Blind Peer Reviewed Refereed Open Access International e-Journal - Included in the International Serial Directories.
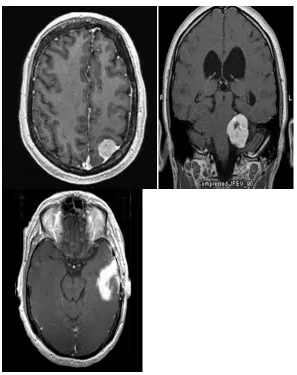
[image:5.612.110.407.65.440.2]Page | 5 Figure 2. Brain tumor MR images Beignin type
The brain tumor dataset belongs to Malignant type and are collected from ADNI data
base.
© Association of Academic Researchers and Faculties (AARF)
A Monthly Double-Blind Peer Reviewed Refereed Open Access International e-Journal - Included in the International Serial Directories.
[image:6.612.195.428.99.180.2]Page | 6 Figure 3. Brain tumor MR images Malignant type
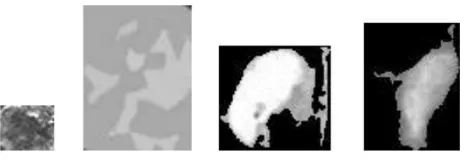
Figure 4. a) non- tumor image b) non- tumor image c) tumor image d) tumor image
IMAGE ACQUISITION
Image Acquisition The proposed method has been implemented on real data for human MR
Images dataset, some of them were obtained from the hospitals and the other were obtained
from the internet as there are no database is available from these types of tumors that
considered in this paper.
IMAGE PREPROCESSING
Image Preprocessing It is well known that the most noise in MR Images is random and
Gaussian distribution is used to characterize it statistically. In this paper we are using sigma
filter for removing noise from MR Images. The sigma filter finds the average of pixels in the
box that have been predetermined size which not deviate too far from the pixel which the box is
centered on. Consequently, the difference in the intensity of the pixels by segmentation more
than two standard deviations of the pixel in the centre box, there is a high probability that this
difference is not because of the noise; Therefore Sigma filter ignores such a pixel [5].
IMAGE SEGMENTATION
Generally, The machine learning algorithms used in the process of image segmentation by
putting all the pixels that are higher than the threshold level to a foreground while the other
pixels to the background value. Any dynamic change according to the pixel intensity cannot be
achieved when using threshold method [6]. In proposed method we used Adaptive threshold
that usually take the gray or color images as input and outputs in the form of binary image
representing segmentation. Adaptive thresholding techniques used to separate the object of an
© Association of Academic Researchers and Faculties (AARF)
A Monthly Double-Blind Peer Reviewed Refereed Open Access International e-Journal - Included in the International Serial Directories.
Page | 7 that the Adaptive threshold value is calculated for each pixel in the image. This technique
provides more robustness to changes in illumination. After used adaptive thresholding, the
region detection process is performed on the binary image that results from an adaptive
thresholding step. Region detection is Image segmentation technique that classifies pixels in the
image to one or several separate areas or blob which is an area of touching pixels with the same
logic state. The region detection consists of scanning and labeling any new regions, but also
merging old regions when they prove to be connected on a lower row. Therefore, the image is
scanned and every pixel is individually labeled with an identifier which signifies the region to
which it belongs [7].
CLASSIFICATION
Classifications In this paper used deep learning and machine learning algorithms to classify the
MR Images of brain tumor and compare their performing.
EXPERIMENTAL RESULTS
In this paper, the number of collected samples was 200 brain MR Images. The binary object
features such as (Major axis length, Minor axis length, Euler Number, Area and Circularity) for
each image are extracted using MATLAB program. Weka tools are used for brain MR Images
classification. Brain MR Images were classified using the CART algorithm and NAÏVE
BAYES with 65% percentage split. In 65% percentage split, used 65% of the samples in the
training process the rest of the samples have been used in the test. It is seen from the table (1)
the CART algorithm has the average TP rate and FP rate 0.786 and 0.006 respectively. The
© Association of Academic Researchers and Faculties (AARF)
A Monthly Double-Blind Peer Reviewed Refereed Open Access International e-Journal - Included in the International Serial Directories.
[image:8.612.153.467.118.304.2]Page | 8 Table 1. Result of CART algorithm
Brain tumor type TP Rate FP Rate Precision Ependymoma 0.923 0.015 0.923
Meningioma 0.818 0.03 0.818
Lymphoma 0.75 0 1
Amaplastic strocytoma
0.846 0.015 0.917
Normal 1 0 1
Average 0.897 0.017 0.911
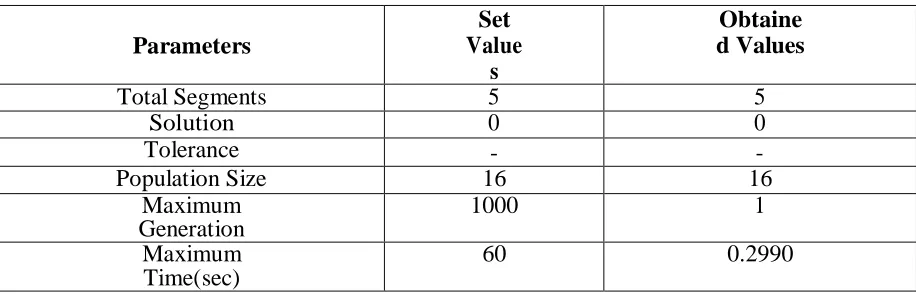
The proposed method begins by performing training on few sets of tumorous and non-tumorous
images based on some parameters.
Table 2.Parameters designed for obtaining segmentation
Parameters
Set Value
s
Obtaine d Values
Total Segments 5 5
Solution 0 0
Tolerance - -
Population Size 16 16
Maximum Generation
1000 1
Maximum Time(sec)
60 0.2990
[image:8.612.88.546.397.544.2]© Association of Academic Researchers and Faculties (AARF)
A Monthly Double-Blind Peer Reviewed Refereed Open Access International e-Journal - Included in the International Serial Directories.
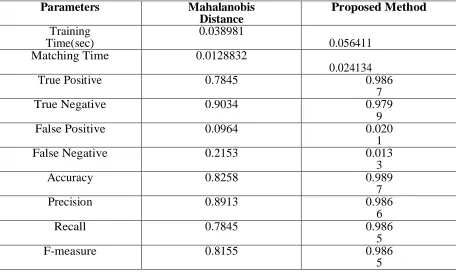
[image:9.612.89.545.97.369.2]Page | 9 Table 3.Parameter values obtained when MRI applied 50 times
Parameters Mahalanobis
Distance
Proposed Method Training
Time(sec)
0.038981 0.056411
Matching Time 0.0128832
0.024134
True Positive 0.7845 0.986
7
True Negative 0.9034 0.979
9
False Positive 0.0964 0.020
1
False Negative 0.2153 0.013
3
Accuracy 0.8258 0.989
7
Precision 0.8913 0.986
6
Recall 0.7845 0.986
5
F-measure 0.8155 0.986
5
© Association of Academic Researchers and Faculties (AARF)
A Monthly Double-Blind Peer Reviewed Refereed Open Access International e-Journal - Included in the International Serial Directories.
[image:10.612.91.525.99.230.2]Page | 10 Table 4.Average 6 fold cross validation test accuracies with brain tumor images only
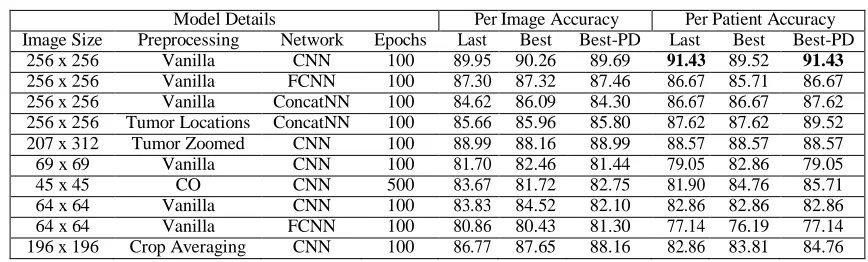
Table 5. Average six-fold Cross Validation Test Accuracies with Brain Tumor and tumorless
Model Details Pe
r Image Accuracy Per Patient Accuracy Image Size Preprocessi
ng Network Epochs Last Best Best-PD Last Best Best-PD 256 x 256 Vanilla CNN 100 88.5
9 89.13 88.78 85.71 89.52 88.57 64 x 64 Vanilla CNN 100 85.0
6 82.69 83.21 84.76 82.86 84.76 64 x 64 Vanilla FCNN 100 84.5
1 86.30 84.05 82.86 84.76 81.90
The last layer of this path and the last fully connected layer from CNN were then concatenated together and connected to one last fully connected layer with 800 neurons before reaching the soft max layer from CNN. We will refer to this neural network as ConcatNN in this deep learning approach.
Model Details Per Image Accuracy Per Patient Accuracy
Image Size Preprocessing Network Epochs Last Best Best-PD Last Best Best-PD
256 x 256 Vanilla CNN 100 89.95 90.26 89.69 91.43 89.52 91.43
256 x 256 Vanilla FCNN 100 87.30 87.32 87.46 86.67 85.71 86.67
256 x 256 Vanilla ConcatNN 100 84.62 86.09 84.30 86.67 86.67 87.62
256 x 256 Tumor Locations ConcatNN 100 85.66 85.96 85.80 87.62 87.62 89.52
207 x 312 Tumor Zoomed CNN 100 88.99 88.16 88.99 88.57 88.57 88.57
69 x 69 Vanilla CNN 100 81.70 82.46 81.44 79.05 82.86 79.05
45 x 45 CO CNN 500 83.67 81.72 82.75 81.90 84.76 85.71
64 x 64 Vanilla CNN 100 83.83 84.52 82.10 82.86 82.86 82.86
64 x 64 Vanilla FCNN 100 80.86 80.43 81.30 77.14 76.19 77.14
© Association of Academic Researchers and Faculties (AARF)
A Monthly Double-Blind Peer Reviewed Refereed Open Access International e-Journal - Included in the International Serial Directories.
Page | 11 .
Figure 5 .Best and Mean fitness value
Figure 6. Curves obtained on Segmentation
The proposed method has been compared with the previous method using Mahalanobis Distance on the basis of few parameters on the Tumor images 50 times which has optimized the results. 16.39% accuracy and 9.53% precision has been obtained on tumor images when applied 50 times. This result shows that the proposed method proves to be highly beneficial for detection of tumor.
CONCLUSIONS
© Association of Academic Researchers and Faculties (AARF)
A Monthly Double-Blind Peer Reviewed Refereed Open Access International e-Journal - Included in the International Serial Directories.
Page | 12 Cheng et. al.’s initial work, but neural networks also utilize a more general methodology requiring only an image to understand brain tumor types. Furthermore, the accuracy per patient metric consistently remained at the levels of per image accuracy results, implying the neural network is providing consistent predictions for patient images. To extract and segment the tumor we used different techniques such as SOM Clustering, k-mean clustering, Fuzzy C-mean technique, curvelet transform. It can be seen that detection of Brain tumor from MRI images is done by various methods, also in future work different automatic methods achieve more accuracy and more efficient. Improving performance on smaller images can have great benefits in training and assisting doctors in treatment of patients. Dealing with noisy, smaller images can help generalize neural networks to understand more complex brain images which in turn can help doctors in their diagnosis.
REFERENCES
1. N.M. Saad, Syed A.R. Abu-Bakar and A.F. Muda,“Automatic Brain Lesion Detection
and Classification Based On Diffusion-Weighted Imaging Using Adaptive Thresholding
and A Rule Based Classifier”, International Journal of Engineering and Technology
(IJET), Vol 6 No 6 Dec 2014-Jan 2015.
2. Amarpreet Kaur, Gagandeep Jindal, “Overview of Tumor Detection using Genetic
Algorithm”, IJIET, Vol. 2, Issue 2, April 2015.
3. Yao-Tien Chen, “Brain Tumor Detection using 3-D Bayesian Level set Method with
Volume Rendering”, Proceeding International conference on Wavelet Analysis and
Pattern Recognition, Xian,2012.
4. R. Preetha and G. R. Suresh, "Performance Analysis of Fuzzy C Means Algorithm in
Automated Detection of Brain Tumor," in Computing and Communication Technologies
(WCCCT), 2014 World Congress on, 2014, pp. 30-33.
5. K. Arulmozhi, S. Arumuga Perumal and K. Kannan,“Contrast Improvement Of
Radiographic Images In Spatial Domain By Edge Preserving Filters”, International
Journal Of Computer Science And Network Security, VOL.10 No.2, February 2010
6. Akhilesh Tayade and Anjali B.Raut,“Detection of Target Object In A Static Image”,
International Journal of Engineering Research & Technology (IJERT), Vol. 2 Issue 4,
© Association of Academic Researchers and Faculties (AARF)
A Monthly Double-Blind Peer Reviewed Refereed Open Access International e-Journal - Included in the International Serial Directories.
Page | 13 7. Ibrahim Furkan Ince and Tae-Cheon Yang “A New Low-Cost Eye Tracking And Blink
Detection Approach: Extracting Eye Features With Blob Extraction”, Springer Berlin