A Monthly Double-Blind Peer Reviewed Refereed Open Access International e-Journal - Included in the International Serial Directories.
International Research Journal of Mathematics, Engineering and IT (IRJMEIT)
16 | P a g e
"QUANTUM CHEMICAL COMPUTATIONAL METHODS FOR
COMPARING AND PREDICTING THE VIBRATIONAL SPECTRA OF
LOWER AND UPPER BOUNDS OF MELATONIN IN POST
MENOPAUSAL WOMEN AND PRE-MENOPAUSAL WOMEN"
Dr. S. Lakshmi
Research Advisor, Departmentof Mathematics,
Kunthavai Naacchiyaar Government Arts College for Women(Autonomous), Thanjavur/ Bharathidasan University, Trichy, Tamilnadu,India
&
Akanksha A. Desai
Research Scholar, Kunthavai Naacchiyaar Government Arts College for Women(Autonomous), Bharathidasan University, Trichy, Tamilnadu, India
ABSTRACT
The problem of generating the function from New Better Than Used Processes along with the
lower and upper bounds is drawing the attention of the reliability analyst. Amongst those
approaches, the characterization approach and the modeling approach are very appealing.
In fact characterization approach is of interest to both theoreticians and applied workers.
Here we have used New Better Than Used Processes along with the lower and upper bounds
for application by extending the distribution through characterization approach. In our
application we have considered Post-Menopausal and Pre-Menopausal women for
comparison of stress effects in terms of Melatonin.
KEYWORDS – Bounds, Melatonin, NBU, Placebo, Progesterone
1. INTRODUCTION Melatonin
Melatonin is a form of a hormone produced in the pineal gland of the brain
that helps regulates our sleep and wake cycles. Melatonin is also very effective in treating jet International Research Journal of Mathematics, Engineering and IT Vol. 4, Issue 6, June 2017 Impact Factor- 5.489
ISSN: (2349-0322)
A Monthly Double-Blind Peer Reviewed Refereed Open Access International e-Journal - Included in the International Serial Directories.
International Research Journal of Mathematics, Engineering and IT (IRJMEIT)
17 | P a g e
lag, high blood pressure, tumours, low blood platelets, insomnia caused by withdrawal from
drug addiction, or anxiety caused by surgery. Melatonin is also known to cure infertility, to
control sleep problems caused by shift work, or to enhance athletic performance. Scientists
are also looking at other good uses for melatonin, such as,[1]
• Treating seasonal affective disorder (SAD).
• Helping to control sleep patterns for people who work night shifts.
• Preventing or reducing problems with sleeping and confusion after surgery.
Progesterone
Progesterone is the naturally producing hormone in the body. Women take
progesterone by mouth for inducing menstrual periods and it also treats abnormal uterine
bleeding associated with hormonal imbalance and severe symptoms of premenstrual
syndrome. Progesterone is also used in combination with the hormone Estrogen to "oppose
Estrogen" as part of hormone replacement therapy. If Estrogen is given without progesterone,
Estrogen increases the risk of uterine cancer. During the reproductive years, the pituitary gland
in the brain generates hormones Follicle-Stimulating Hormone [FSH] and Luteinizing
Hormone [LH] is responsible even for new egg to mature and be released from its ovarian
follicle each month. As the follicle develops, it produces the sex hormones Estrogen and
Progesterone, which thicken the lining of the uterus. Progesterone levels become high in the
next half of the menstrual cycle, and following the release of the egg (ovulation), the ovarian
tissue that replaces the follicle proceeds to produce Estrogen and Progesterone [1,2].
2. METHODS & RESULTS Subjects
(A) Postmenopausal women, aged 48–74 yr (mean 57.4 yr), were selected after a careful clinical and biological evaluation. Investigations were performed after natural
menopause. Mean age at menopause was 49.4 yr (range, 41–57 yr). The Subjects involved
were such that they had never undergone any hormonal therapy. Their body weight was in the
normal range for all ( body mass index 22.1). In all subjects, Estradiol plasma levels were
also normal. FSH plasma levels were under average values. Shift workers, subjects who had
travelled across time zones during the last 2 months, individuals with personal history of drug
abuse or with personal or family history of many types of disorders which are highlightened
and subjects with current vasomotor symptoms, dieting, or intensive physical exercise were
A Monthly Double-Blind Peer Reviewed Refereed Open Access International e-Journal - Included in the International Serial Directories.
International Research Journal of Mathematics, Engineering and IT (IRJMEIT)
18 | P a g e
answer a questionnaire of specific questions concerning her sleep habits. To be included in
the study, volunteers had to comply with the following requirements: regular sleep schedules
(i.e they sleep from 10 to 12 and 6 to 8), no difficulty to fall asleep, no complaints of
awakenings during the sleep period, no snoring, no periodic limb movements, and no daytime
fatigue and sleepiness. Written informed consent was obtained from all volunteers[3,4].
Sleep Analysis
Polygraphic sleep recordings were visually scored at 30-sec intervals, using
standardized criteria by the same experienced scorer who was blind to the clinical condition
of the subject.
o Sleep Onset and Morning Awakening :
They are defined as, respectively, the times of the first and last 30-sec intervals scored II,
III, IV, or Rapid Eye Movement (REM).[10]
o The Sleep Period :
It is defined as the time interval separating sleep on set and final awakening.
o Total Sleep Time :
It is defined as the sleep period minus the total duration of wake after sleep onset
(WASO).
o Sleep Latency :
It is defined as the time interval from lights off until sleep onset.[11]
o Sleep Efficiency :
It is calculated as the total sleep time, expressed as percentage of the time allocated to
sleep.
o Slow-Wave Sleep (SWS) :
It is defined as stages III_IV.
A Monthly Double-Blind Peer Reviewed Refereed Open Access International e-Journal - Included in the International Serial Directories.
International Research Journal of Mathematics, Engineering and IT (IRJMEIT)
19 | P a g e
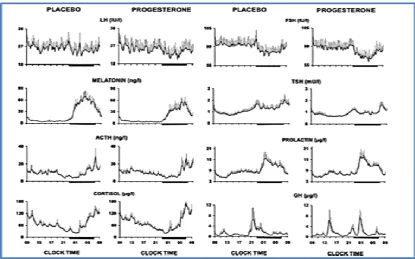
Fig 1:Mean (+ SEM; n = 8, except for Melatonin: n = 6, and for Prolactin: n = 7) 24-hr profiles of Plasma LH, FSH, Melatonin, ACTH, Cortisol, TSH, Prolactin, and GH under
Placebo and Progesterone Treatment. Black bars indicate scheduled Sleep Periods.
Classic postmenopausal gonadotropins profiles were observed in both conditions.
Mean 24-h LH levels, pulse frequency, duration, and amplitude were similar in both
conditions. Each type of values under progesterone correlated positively with corresponding
values under placebo for pulse frequency, duration, and amplitude. Mean 24-h FSH levels
were slightly but significantly lower under progesterone than under placebo. FSH pulse
characteristics were similar in both conditions.[13,14]
o Findings from Placebo and Progesterone Treatment: Reference Fig. 1
Melatonin profiles were obtained in six subjects. In both conditions, classic profiles
with stable, low daytime values, an evening circadian rise, and a return to low values in the
morning were observed. The 24-h levels and the timings of onset and offset of the circadian
rise in both conditions were not significantly different from each other. However, over the24
hr period profile, melatonin levels were decreased by more than 40%, compared with placebo
(P _ 0.03).[18]
[image:4.595.72.488.54.313.2]A Monthly Double-Blind Peer Reviewed Refereed Open Access International e-Journal - Included in the International Serial Directories.
International Research Journal of Mathematics, Engineering and IT (IRJMEIT)
20 | P a g e
of voting independently to assess the acceptability of each of 54 separate items. The
“acceptability” of a particular item was based on reliability, validity, and practical utility. A
conference call was then held to assess the level of agreement and disagreement for each
item, to discuss reasons for disagreement, and to determine areas of consensus. A
consensus-based document was drafted and re circulated for comments and revisions. The draft
document was finalized upon approval of all of the workgroup members.[15]
Fig 2: Plasma: Overnight plasma melatonin profile, plotted as a percentage of maximum
(dashed line) and smoothed with a lowest curve fit to the raw data (solid line). Some
frequently used phase markers are shown: DLMO at 10 pg/mL, DLMO or dim-light
melatonin offset (DLMOff) at 25% or 50% of maximum levels, the midpoint, and the
termination of melatonin synthesis (Synoff) for Pre-Menopausal women.
o Findings of Plasma Melatonin from Urine samplings : Reference Fig. 2
The workgroup‟s consensus-based summary and recommendations for collection and
analysis of urine plasma melatonin are detailed below. The utility of this method for studies
conducted outside of the clinic or inpatient facility in the natural living environment (“field studies”), studies conducted primarily for phase assessment in a clinical setting (“clinical studies”), and research studies conducted in an inpatient facility under controlled conditions (“research studies”) for Pre-Menopausal women.[16][17]
3. MATHEMATICAL MODEL 3.1 New Better Than Used Processes
A stochastic process , such that P{Z(0) = 0} = 1, is said to be new better than used
(NBU) if, for every x, the first-passage time Tx = inf {t: Z(t) > x} satisfies P{TX > s + t} for
[image:5.595.108.518.170.368.2]A Monthly Double-Blind Peer Reviewed Refereed Open Access International e-Journal - Included in the International Serial Directories.
International Research Journal of Mathematics, Engineering and IT (IRJMEIT)
21 | P a g e
processes include processes with shocks and recovery, processes with random repair-times,
various Gaver–Miller processes and some strong Markov processes. Applications in
reliability theory, queuing, dams, inventory and electrical activity of neurons are indicated. It
is shown that various waiting times for clusters of events and for short and wide gaps in some
renewal processes are NBU random variables. The NBU property of processes and random
variables can be used to obtain bounds on various probabilistic quantities of interest.[5][6]
Let {Z(t), t 0} be a stochastic process such that Z (0)=0 and Z (t) 0 for all t> 0 with
probability 1. The process is said to be new better than used (NBU) if the first passage times
Tx =inf {t 0: Z(t)> x} have NBU distributions for all x 0, i.e., if.
P{Tx > s+t Tx > x} P{Tx > s} for all s 0, t 0, x
0………...3.1.1
such that P{Tx > t } > 0 (even if P{Tx = } > 0.
The purpose of this is to show that certain kinds of processes are NBU so that known facts
about NBU distributions can be applied in the study of first passage times. Such results are
obtained for a number of processes that arise in applications; for example, Z(t) might
represent the value at time t of the virtual waiting time in a single-server queue, the content of
a dam, an inventory, or the level of electrical activity in a neuron. However, throughout this
paper the terminology of reliability theory is used: Z(t) is referred to as the wear of an item at
time t‟ and the item fails when the wear exceeds a fixed threshold x, so that Tx is the life
length of the item.
Ross (1979) has introduced a different notion of an NBU process which requires Z(t) to be
monotone in t and also requires. [7]
P{Tx > s+t | Z(u), 0 t} Tx > s} for all s, t 0 .
Our condition, which does not require monotone sample paths, is in fact an NBU analog of an
increasing failure rate average (IFRA) process, defined by Ross (1979) as a process for which
each Tx has an increasing failure rate average distribution. El New Delhi, Procschan and
Sethuraman (1978) discuss processes which are NBU in our sense but they restrict
themselves to the case where sample paths are monotone and each Z(t) is integer-valued.
Ross (1979), (1981) has shown that some processes arising in reliability theory are IFRA
processes, so that these processes are NBU processes in our sense. But there are a number of
A Monthly Double-Blind Peer Reviewed Refereed Open Access International e-Journal - Included in the International Serial Directories.
International Research Journal of Mathematics, Engineering and IT (IRJMEIT)
22 | P a g e
Here, kinds of processes are considered. Three of these have sample paths that move in a
deterministic manner (given the present or past) between random points in time. At such
points, the sample paths possible have random jumps. A fourth class of processes consists of
Markov processes.
As usual, we write increasing of non-decreasing and deceasing for non-increasing. Also
random variables which are identically 0 are regarded being both NBU and NWU.
3.2 Process with Shocks and Recovery
The processes considered in this section unify several special cases that have been
previously studied. Some of these special cases are described here to introduce the general
case.
Let A1,A2… be a sequence of independent, identically distributed (i.i.d) non –negative
random variables that represent times between shocks to a device. Let Ci be the damage
inflicted by the ith shock and suppose that C1,C2, … are i.i.d. and independent of A1, A2,…. If
N(t)= max{n 0; } is the number of shocks experienced by time t and damages
accumulate additively then Z(t)= is the total damage sustained by time t. In case the
Ci are non-negative and the Ai have an NBU distribution, {Z(t), t is an NBU process
(Esary, marshall and Prochan (1973), together with A- Hameed and Proschan (1975), or
Block and Savits (1978) )
The more general case that wear is allowed to decrease between shocks (recovery takes
place) in some deterministic fashion such as exponentially or linearly (but never below 0) has
received considerable attention in the literature (see, e.g. Smith and Year (1981)). Many such
processes are also NBU as a consequence.[8]
In general, let {Ai} and {Ci} be sequences of random variables and suppose that the
Ai are positive. Let R0 = 0, Rn = n=1,2,…. Then 0 = R0 < R1<…. Our motivation is to
define a process which jumps an amount Cn (possibly negative) at Rn and between jumps
moves deterministically (given the magnitude and location of earlier jumps), all subject to the
requirement that the process stays non-negative.
A Monthly Double-Blind Peer Reviewed Refereed Open Access International e-Journal - Included in the International Serial Directories.
International Research Journal of Mathematics, Engineering and IT (IRJMEIT)
23 | P a g e
hj(r1,…,rj;c1,…,cj;) is a measurable function defined on [rj; ), j=0,1…, (h0(.) is a function of
one non-negative argument). Define (Z(t), t 0} by
Z(t) = hj(R1,…,Rj; C1, …, Cj;t), Rj Rj+1, j =0,1,…
As indicated above, the motivating examples for this study also satisfy the conditions.
[ hj-1(r1…, rj-1; c1,…, cj-1;rj) + c1] + = hj (r1, …, rj;c1, …cj;rj)
So that the process Z does indeed jump Cj at Rj, subject to remaining non-negative. However,
this condition is not required in the following theorem, where the non-negativity follows from
(iii) and (v).
Theorem 1: Suppose that
(i)
A1, A2, … are i.i.d. and NBU,(ii)
C1, C2, …. Are i.i.d. and independent of {A1, A2,…} .Suppose also that for every realization (ri, ci), i=1,2,…, the functions hj, j=0,1, …,satisfy
(iii)
h0(t) =0, t r0 = 0,(iv)
hi(r1,…,ri;c1, …, ci;t) = hi(r1+ ;ri+ ), 0, t ri(v)
hi(r1,.., ri;c1, …, ci;t) hi-1(r2-r1,…ri-r1,c2,…, c1;t-r1), t riThen {Z(t), t is an NBU process.
Comment about (iv). Conditions (iv) says that if A1 = R1 is replaced by Ai + . Then the
resulting process Z* which develops according to the prescription of (3.2.1) has sample paths
which satisfy
Z* (t +
t ………3.2.1
from this, together with (iii), it follows that
R1 and Tx – R1 are independent.
Comment about (v). Conditions (v) implies via an easy induction that
hi ( r1…. .rl,rl+1….ri , c1, …, cl,cl+1,....,ci ;t) hj-1(rl+1-rl ,…..rj - ri ; cl+1 cl;t-r1), t > rj ,j =
l,l+1,….
This condition says that the process which develops from the sequences and
according to the prescription of the property that [8,9]
Ż ( t-Rl) Rl.
If Tx = inf{ t this implies that for
A Monthly Double-Blind Peer Reviewed Refereed Open Access International e-Journal - Included in the International Serial Directories.
International Research Journal of Mathematics, Engineering and IT (IRJMEIT)
24 | P a g e
P{Tx> s+t-Rn-1 | t-rn-1 < Rn} = P{Tx> s+t-Rn-1 | t-rn-1| r-rn-1<R1}
Proof of Theorem1.It follows that
P=P{Tx > s+t /N(t)=n-1, (R1,C1) = (r1,c1), i=1…., n-1}
Where u = t – rn-1, it follows that A1 and T* = Tx-R1 are independent. Using the fact that A1 is
NBU, it follows that
P P{T* + A1> s+u |A1 > u}
A1, > u+s-t*|A1 > u} dP{T* t*}+ T* t*}
From the inequality p P{T*>s}, follows by partially un conditioning in p but retaining the
condition T*>t.
Linear Recovery
If g(s)=[-s]+ then
h1(r1;c;t)=[c1+ -(t-r1)]+,
h1(r1,…, r1;c1,...,c1;t)
={[h1-1(r1,…,rj-1;c1,…,cr-1;rj) +c1]+- (t-r1)}+
, j =2,3,...
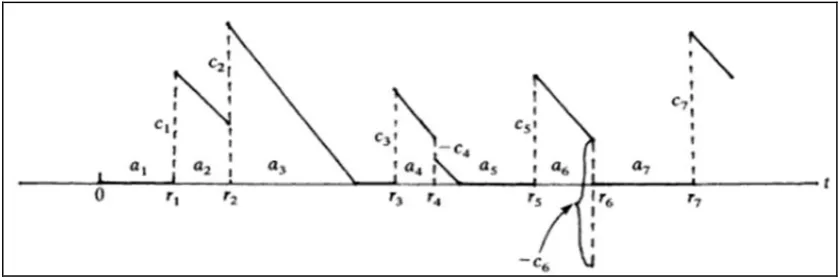
For the resulting process, a typical realization .
(Short gap I a renewal process). Gilbert and Pollak (1957) considered the distribution of the
[image:9.595.71.491.482.621.2]waiting time for a cluster of two events in a.
Fig 3. A typical realization of a process with linear recovery
Poisson Process: This is the time of the first event in the process which follows the preceding event by less than a units of time (here, the origin is not counted as an event
time.)By taking C1, C2 to be degenerate at and by taking x=3 , say, this waiting time is
A Monthly Double-Blind Peer Reviewed Refereed Open Access International e-Journal - Included in the International Serial Directories.
International Research Journal of Mathematics, Engineering and IT (IRJMEIT)
25 | P a g e
obtained when A1, A2,… are independent and have a common exponential distribution.
Generalization of this result are obtained in a different way.
(Large gap in a renewal process). Let {N(t), t be the renewal process with interarrival
times A1, A2 … Let T* be the firt time after the first renewal for which there is no renewal in
the interval (T*- ,T*], i.e.
T* =inf{t>A1: N(t)
–N(t-………(3.2.3)
Then T* is the waiting time for a large gap between renewals when the origin is not
considered to be a renewal point. The case that the origin is regarded as a renewal point. So
T* need not exceed A1 is considered. Construct the process {Z(t), t accordingly with
g(t)=t, t and with P{Ci=- } =1, i=1,2,… Then T* = is NBU.
If N (t) is Poisson process recorded by Type II counter (see Feller ( 1971), P. 189) then the
successive times that the counter becomes unblocked form a renewal process with waiting
times between renewals that have the same distribution as T* = Tα , which we have just noted
is NBU.
(Exponential recovery). If g(s) =e-θs, then
h1(r1, c1;t) = c1+exp( -θ (t-r1)),
hi(r1,…, r1;c1,…cj;t) =[hi-1(r1,…,ri-1;c1,…,cj-1;rj)+c1]+ exp(-θ(t-rj)), j=2,3,….
Here recover is at an exponential rate, rather than liner.
Example Leslie (1969) has considered the waiting time until the occurrence of „cluster of size k‟, k 2, in a Poisson process. For the purpose of this example, a cluster of size k is said to
occur at the kth of a group k renwals if no gap between successive renewals exceeds a
prescribed positive number. More formally, a cluster of size k said to occur at t if
(i) for some m k, t =Rm
(ii)Rm-l- Rm-l-1 , 1, … k-2,
The time of first occurrence of cluster is the passage timeTk-1/2 of a process Z which increases
by 1 at renewal points Ri and drops to 0 whenever units of time have elapsed since the last
renewal. Formally, let Z be defined.
With
hj(r1, . . ., rr, c1, . . ., cr t) = hj-1( r1, . . . rj-1, c1, . . ., cj-1, r1) + cj if t ϵ [rj, rj + a]
A Monthly Double-Blind Peer Reviewed Refereed Open Access International e-Journal - Included in the International Serial Directories.
International Research Journal of Mathematics, Engineering and IT (IRJMEIT)
26 | P a g e
And let Cibr degenerate at 1, i + 1,2, . . . . If A1, A2,. . . are i. i.d. and NBU, then it follows
from Theorem that the waiting time Tk-1/2 has an NBU distribution.
3.3 A Random Repair-Times Process
A process of particular interest in storage theory (Moran 1959), and queueing theory
(Prabhu 1965 ) again has successive times B1, B2,. . . between shocks that are independent
identically distributed and non-negative. But at the occurrence of the i th shock the process
has a jump Di (the process is set equal to 0 if such a jump would carry it below 0. Again, D1,
D2, . . . are independent, identically distributed and independent of B1, B2, . . . The process
starts at 0; before the first shock and between successive shocks, the process increase in some
deterministic fashion. In the context of reliability theory „shocks‟ might represent repairs,
with continuous wear between the repairs. In contrast with the process, the waiting times Bi
are assumed to be exponentially distributed and the deterministic increase of the process is of
the form: „the rate of increase depends only on the height of the process‟, as in example
Gilbert and Pollak (1957) obtained an explicit expression for the distribution of the
waiting time until a cluster of two events (gap ≤α) in a poisson process with intensity λ. This
is the distribution of random variable T, the survival function of Tx is,
When t is large the numerical computation of above equation can be tedious, because for
large t , the number of terms in the sum is large . The bounds can be derived as ,
Where a = -s and s is the largest real root of
S+λ = λ exp (-(s+λ)α).
Note that the function is not necessarily a survival function.
The upper bound can be improved by using the fact that the function is NBU.
4. MATHEMATICAL RESULTS
For different values of shape and Scale parameters we have the following figures for the
A Monthly Double-Blind Peer Reviewed Refereed Open Access International e-Journal - Included in the International Serial Directories.
International Research Journal of Mathematics, Engineering and IT (IRJMEIT)
27 | P a g e
Fig A: Lower and Upper bounds of Melatonin Production with Placebo for Post Menopausal women
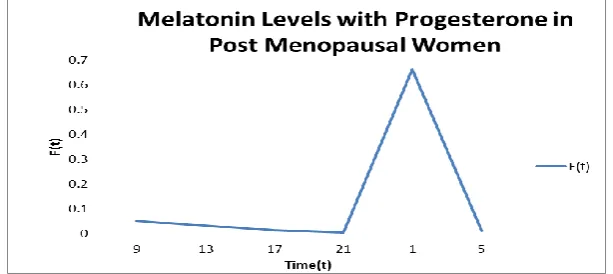
Fig B: Lower and Upper bounds of Melatonin Production with Progesterone for Post Menopausal women
Fig C: Melatonin Production with Placebo for Post Menopausal women
[image:12.595.101.378.35.189.2] [image:12.595.101.378.237.377.2] [image:12.595.100.400.426.564.2] [image:12.595.97.404.597.734.2]A Monthly Double-Blind Peer Reviewed Refereed Open Access International e-Journal - Included in the International Serial Directories.
International Research Journal of Mathematics, Engineering and IT (IRJMEIT)
28 | P a g e
Fig E: Melatonin Production in Pre-Menopausal women
Fig F: Lower and Upper bounds of Melatonin Production in Pre-Menopausal women
5. CONCLUSION
Mathematical Conclusions
We have shown the comparison of characterizing hormone Melatonin for Post-Menopausal
with respect to Placebo and Progesterone treatments and Pre-Menopausal Women. Even we
have shown the hormone Melatonin between Lower and Upper Bounds for different subjects.
The following observations are made:
o Figure A : The function f(t),h(t) varying with Time (t)
In Both functions f(t) and h(t) Melatonin levels are bounded between lower and upper
bounds thus showing the desired way, with relatively constant nocturnal levels followed by
an early morning rise in the concentration levels. The timings in the decline of the nocturnal
peak showed a vary in case as compared with the bounds in the progesterone treatment. Thus
showing progesterone treatment more effective in the case of combined effects of the
[image:13.595.98.415.23.393.2]A Monthly Double-Blind Peer Reviewed Refereed Open Access International e-Journal - Included in the International Serial Directories.
International Research Journal of Mathematics, Engineering and IT (IRJMEIT)
29 | P a g e
representing the levels of concentrations of Melatonin shows a hike in the Progesterone
treatment as compared to the Placebo one thus giving a good conclusion to the medical
professionals.
o Figure B:The function f(t),h(t) varying with Time (t)
In Both functions f(t) and h(t) Melatonin levels are bounded between lower and upper
bounds thus showing the desired way, with relatively constant day time levels followed by
an nocturnal rise in the concentration levels. The timings in the rise of the nocturnal peak
showed a vary in case as compared with the bounds in the placebo treatment. Thus showing
progesterone treatment more effective in the case of combined effects of the hormones in a
24-hr time profile for classic post-menopausal subjects. The Function f(t),h(t) representing
the levels of concentrations of Melatonin shows a hike in the Progesterone treatment as
compared to the Placebo one thus giving a good conclusion to the medical professionals.
o Figure C: The function F(t) varying with Time (t)
In Both Treatments, Melatonin concentrations followed the relative pattern, with
desirably constant daytime levels thus showing an nocturnal elevation in the concentration
levels. In Placebo treatment the variable viz.. Melatonin determined by the Function F(t)
showed a decline in the levels of concentrations from the mid-night time with a consequent
fall till 5a.m. whereas in case of progesterone treatment the Function F(t) shows a decrease at
mid-night time but with much higher values of the levels of concentrations. In both
conditions the variable characterising viz..Melatonin shows Progesterone treatment more
effective than the Placebo one. The timings in the rise of the peak in the progesterone
treatment is higher than the placebo one. Thus showing progesterone treatment more
effective in the case of effect of the hormone in a 24-hr time profile for post-menopausal
subjects. The Function F(t) representing the levels of concentrations of Melatonin shows a
hike in the Progesterone treatment as compared to the Placebo one thus giving a good
conclusion to the medical professionals.
o Figure D: The function F(t) varying with Time (t)
In Placebo Treatment Melatonin concentrations followed the desired way, with the
Function F(t) representing the levels of concentrations of Melatonin relatively constant
during daytime levels followed by an early nocturnal rise in the concentration levels. In
Progesterone treatment the Function F(t) representing the levels of concentrations of
Melatonin variable shows a fluctuating curve during day times followed by a rise of the
A Monthly Double-Blind Peer Reviewed Refereed Open Access International e-Journal - Included in the International Serial Directories.
International Research Journal of Mathematics, Engineering and IT (IRJMEIT)
30 | P a g e
progesterone treatment more effective in the case of combined effects of the hormone in a
24-hr time profile for classic post-menopausal subjects. The Function F(t) representing the
levels of concentrations of Melatonin shows a hike in the Progesterone treatment as
compared to the Placebo one thus giving a good conclusion to the medical professionals.
o Figure E: The function F(t) varying with Time (t)
In Pre-Menopausal women Melatonin concentrations followed the desired way, with
the Function F(t) representing the levels of concentrations of Melatonin relatively with slight
elevation during daytime levels followed by early nocturnal stable curve between 8p.m and
12a.m and then depletion in the concentration levels in the mid-night time till early morning
4a.m. This shows a disturbance in sleep cycle for such women at 4a.m thus giving again a
slight hike in the concentration levels of melatonin after 4a.m till noon 12. In Pre-Menopausal
women the Function F(t) representing the levels of concentrations of Melatonin variable
shows a fluctuating curve during day times followed by an rise of the nocturnal peak which
shows a variation in the cycle. Thus showing comparison between pre-menopausal and
post-menopausal women and giving more effective results in the case of effects of the hormone
in a 24-hr time profile for different subjects. The Function F(t) representing the levels of
concentrations of Melatonin shows a hike in the Post-Menopausal women as compared to the
Pre-Menopausal women thus giving a good conclusion to the medical professionals.
o Figure F: The function F(t) varying with Time (t)
In the functions F(t) Melatonin levels are bounded between lower and upper bounds
thus showing the desired way, with relatively constant day time levels followed by an
nocturnal rise in the concentration levels. The timings in the rise of the nocturnal peak
showed a vary in case as compared with the bounds in the Post-Menopausal women. Thus
showing comparison between pre-menopausal and post-menopausal women and giving
more effective results in the case of effects of the hormone in a 24-hr time profile for
different subjects. The Function F(t) representing the levels of concentrations of Melatonin
shows a hike in the Post-Menopausal women as compared to the Pre-Menopausal women
thus giving a good conclusion to the medical professionals.
In this direction we have developed a New Better Than used Processes Model to
analyse a data set of Melatonin hormone and compare the effects of the hormone in a 24 hr.
time profile for Post-Menopausal Women and Pre-Menopausal women. Here the model
concludes that the level of concentrations of the Melatonin hormone shows a hike in the
A Monthly Double-Blind Peer Reviewed Refereed Open Access International e-Journal - Included in the International Serial Directories.
International Research Journal of Mathematics, Engineering and IT (IRJMEIT)
31 | P a g e
conclusion to the medical professionals.
6. REFERENCES
1. Batra SK, MillerWL1985 Progesterone inhibits basal production of follicle-stimulating
hormone in ovine pituitary cell culture. Endocrinology 117:2443–2448
2. Chakravarty S, Rizvi SI: Physiological effects of melatonin: implications on human
health. Biomedicine 2008, 28:252–255.
3. ClevelandW1979 Robust locally weighted regression and smoothing scatterplots. J Am
Stat Assoc 74:829–836.
4. de Matos CA, de Bruin P, de Bruin V, Nunes D, Pereira E, Cavalcante M, Andrade G:
Melatonin reduces lung oxidative stress in patients with chronic obstructive pulmonary
disease: a randomise, double-blind,placebo-controlled study. J Pineal Res 2012,
53:238–244.
5. Dr.Lakshmi,S and Agalya,M., A Mathematical model for finding the Association of
Thyroid Stimulating hormone with LH and FSH ,International Journal of Mathematical
Sciences Vol-13,No.1-2.P-85-93,2014.
6. Dr. Lakshmi, S and Geetharani, B.,M/M/1/N queuing model for the secretion of DHEA
due to human stress, Bioscience Research Bulletrin Vol-26,Issue
No.2,2010,PP:123-129.
7. Dr.Lakshmi,S and Shanmugapriya,S ,Stochastic Model for endocrine stress responses
in chronic fatigue syndrome ,Bioscience Research Bulletin V0l-24,No-2,2008,P-63-67.
8. Dr.S.Lakshmi and Akanksha Desai,A Mathematical Model for finding the Moment
Generating Function of Multivariate Normal Distribution for the Four Variables
Melatonin , LH, Progesterone, Estradiol,ElixirInernational Journal,2016.
9. Dr,S.Lakshmi and M.AgalyaA, MathematicaL Model For Finding Maximum
Likelihood Estimator Functions of Luteinizing Hormone, Follicle Stimulating
Hormone, Estradiol and Progesterone., Feb2014.PP 41-46.
10.Karakawa T, Kurachi K, Aono T, MatsumotoK1976 Formation of 5alpha-reduced
C19-steroids from progesterone in vitro by a pathway through 5alpha-reduced C21-C19-steroids
in ovaries of late prepubertal rats. Endocrinology 98:571–579
11.Leproult R, Van Onderbergen A, L‟Hermite-BaleriauxM,VanCauter E, Copinschi G
2005 Phase-shifts of 24-h rhythms of hormonal release and body temperature following
early evening administration of the melatonin agonist agomelatine in healthy older
A Monthly Double-Blind Peer Reviewed Refereed Open Access International e-Journal - Included in the International Serial Directories.
International Research Journal of Mathematics, Engineering and IT (IRJMEIT)
32 | P a g e
12.Lerner N, Eckstein B 1976 Identification of two 5alpha-reduced pregnanes as major
metabolites of progesterone in immature rat ovaries (1000_g supernatant) in vitro.
Endocrinology 98:179–188
13.Matsumoto K, Yamada M, Tsujimura T 1976 Progesterone metabolism in vitro by
rabbit testes at different stages of development. Endocrinology 99:1269–1272
14.Rose, C. and Smith, M. D. "The Multivariate Normal Distribution." Mathematica J. 6,
32-37, 1996.
15.Rose, C. and Smith, M. D. "The Trivariate Normal." §6.B A in Mathematical Statistics
with Mathematica. New York: Springer-Verlag, pp. 226-228, 2002.
16.Stuart, A.; and Ord, J. K. Kendall's Advanced Theory of Statistics, Vol. 1: Distribution
Theory, 6th ed. New York: Oxford University Press, 1998.
17.So¨ derpalm AH, Lindsey S, Purdy RH, Hauger R, de Wit H 2004 Administration of
progesterone produces mild sedative-like effects in men and women.
Psychoneuroendocrinology 29:339–354.
18.Van Cauter E, Sturis J, Byrne MM, Blackman JD, Leproult R, OfekG,
L‟Hermite-Bale´riaux M, Refetoff S, Turek FW, Van Reeth O1994 Demonstration of rapid
light-induced advances and delays of the human circadian clock using hormonal phase