0095-1137/11/$12.00
doi:10.1128/JCM.05316-11
Copyright © 2011, American Society for Microbiology. All Rights Reserved.
Evaluation of
Aspergillus
PCR Protocols for Testing Serum Specimens
䌤
†
P. Lewis White,
1* Carlo Mengoli,
2Ste
´phane Bretagne,
3Manuel Cuenca-Estrella,
4Niklas Finnstrom,
5Lena Klingspor,
6Willem J. G. Melchers,
7Elaine McCulloch,
8Rosemary A. Barnes,
9J. Peter Donnelly,
7and Juergen Loeffler
10on behalf of the European
Aspergillus
PCR Initiative (EAPCRI)
PHW Microbiology, Cardiff, United Kingdom
1; University of Padua, Padua, Italy
2; Henri Mondor Hospital, Cre
´teil, France
3;
Spanish National Centre for Microbiology, Instituto de Salud Carlos III, Madrid, Spain
4; Cepheid AB, Stockholm, Sweden
5;
Karolinska University Hospital, Stockholm, Sweden
6; Radboud University Nijmegen Medical Centre, Nijmegen, The
Netherlands
7; Royal Hospital for Sick Children, Glasgow, United Kingdom
8; Cardiff University, UHW, Cardiff,
United Kingdom
9; and Wuerzburg University, Wuerzburg, Germany
10Received 10 August 2011/Returned for modification 30 August 2011/Accepted 9 September 2011
A panel of human serum samples spiked with various amounts of
Aspergillus fumigatus
genomic DNA was
distributed to 23 centers within the European
Aspergillus
PCR Initiative to determine analytical
perfor-mance of PCR. Information regarding specific methodological components and PCR perforperfor-mance was
requested. The information provided was made anonymous, and meta-regression analysis was performed
to determine any procedural factors that significantly altered PCR performance. Ninety-seven percent of
protocols were able to detect a threshold of 10 genomes/ml on at least one occasion, with 83% of protocols
reproducibly detecting this concentration. Sensitivity and specificity were 86.1% and 93.6%, respectively.
Positive associations between sensitivity and the use of larger sample volumes, an internal control PCR,
and PCR targeting the internal transcribed spacer (ITS) region were shown. Negative associations
between sensitivity and the use of larger elution volumes (
>
100
l) and PCR targeting the mitochondrial
genes were demonstrated. Most
Aspergillus
PCR protocols used to test serum generate satisfactory
analytical performance. Testing serum requires less standardization, and the specific recommendations
shown in this article will only improve performance.
PCR testing can be used as a screening tool to exclude
invasive aspergillosis (IA). High-frequency sampling is
re-quired, favoring easily obtainable specimens such as blood. In
contrast, invasive specimens, such as those from
bronchoalveo-lar lavage (BAL) or tissue, are used to confirm the presence of
IA once disease is already suspected.
The European
Aspergillus
PCR Initiative (EAPCRI)
re-ported on the process of standardizing molecular methods for
the detection of
Aspergillus
in whole blood (WB) and
high-lighted the importance of the nucleic acid extraction protocol
in achieving satisfactory analytical sensitivity (11). Compared
to alternative specimens (serum and plasma), WB processing is
technically demanding, requiring greater standardization.
Many centers routinely test other specimens, and it is
impor-tant to evaluate the processes in use and provide a
standard-ized approach for
Aspergillus
PCR testing of these specimen
types.
Aspergillus
PCR assays have been used to successfully
detect DNA in serum. Although the methodology varies, the
pooled sensitivity and specificity of serum PCR were 72% and
96.5%, respectively (2, 3, 10, 12, 14).
This article describes the EAPCRI process to evaluate the
analytical performance of methods currently in use for the
detection of
Aspergillus
DNA in serum through the blinded
distribution of a simulated serum panel to 23 centers in
Eu-rope, the United States, and Australia for molecular testing.
Statistical analysis of the results returned by each participant
was performed anonymously to determine factors that affected
analytical performance with an emphasis on analytical
sensi-tivity to maintain the optimal negative predictive value
re-quired for a screening assay.
MATERIALS AND METHODS
The study followed the STARD guidelines where applicable (1).
Participants.The participants comprised a core of eight laboratories and an extended group of a further 15 laboratories. To maintain impartiality throughout the analytical process, all centers were designated by a numerical code to allow blinded review of individual methodological procedures, determination of per-formance, and statistical analysis.
DNA source material.Conidia were harvested from a sporulating culture of Aspergillus fumigatus(ATCC strain 1022) using a wet microbiological loop and resuspended in sterile water containing a drop of Tween 20 to prevent clumping. Conidia were serially diluted in sterile water and quantified using a Fuchs-Rosenthal counting chamber. A volume of suspension containing the equivalent to 1.2⫻106conidia was harvested by centrifugation at 10,000⫻gfor 5 min. The supernatant was discarded, and conidia were exposed to mechanical disruption using the equivalent of 20l of ceramic beads (Roche, Burgess Hill, United Kingdom) and 30 s of bead-beating using a minibead beater (Biospec Products). After pulse centrifugation, the beads were washed with 200l molecular-grade water and DNA was extracted using the Roche High Pure Template DNA kit as per the manufacturer’s instructions with an elution volume of 100l. The DNA was serially diluted using molecular-grade Tris-EDTA buffer (Sigma-Aldrich, United Kingdom) to attain a range of DNA concentrations (Table 1).
Specimens.Blood was obtained by consent from healthy volunteers, screened for the presence of infectious agents as per the protocol of the Institute of Transfusional Medicine, Wuerzburg University (Wuerzburg, Germany), and pooled. The serum was tested for the presence of contaminatingAspergillusDNA before processing (13). After being divided into 30-ml aliquots, two aliquots were
* Corresponding author. Mailing address: PHW Microbiology
Car-diff, University Hospital of Wales, Heath Park, Cardiff CF14 4XN,
United Kingdom. Phone: 029 2074 6581. Fax: 029 2074 2161. E-mail:
[email protected].
䌤
Published ahead of print on 21 September 2011.
† The authors have paid a fee to allow immediate free access to this
article.
3842
on May 16, 2020 by guest
http://jcm.asm.org/
retained to provide negative-control material, while eight of the aliquots were spiked with various concentrations ofA. fumigatusDNA (Table 1). The 30-ml serum batches were further divided into 1-ml aliquots. To avoid airborne contamination, all processing of material took place in a category 2 laminar flow cabinet.
Panels.Each panel consisted of 10 1-ml serum samples (eight containingA. fumigatusDNA and two negative) and a PCR control consisting ofA. fumigatus DNA equivalent to 10 genomes/l to monitor PCR performance. The expedi-ency of the panel was tested by an “in-house”Aspergillus-specific real-time PCR (13) and by the commercially available MycAssay Aspergillus (Myconostica, Manchester, United Kingdom). After developing the panels, the distributing center froze all panels at⫺80°C with no freeze-thaw intervals. To validate panels, initial blind testing was performed by the core group (n⫽8) before distribution and blind testing by additional centers (n⫽15). The panels were circulated on dry ice for next day delivery by courier. Participating centers were asked to confirm receipt, comment on the state of the panel (frozen or thawed), and keep specimens frozen at⫺80°C until testing. Centers were requested to return results within a designated time frame and provide detailed protocols for their DNA extraction and PCR amplification systems. The information required included the sample volume used, extraction method, DNA elution volume, PCR method, PCR target, PCR template input volume, PCR total reaction volume, PCR amplification platform, and internal control PCR results.
The acceptable threshold for the PCR performance panel was equivalent to 10 genomes/ml serum. It was essential that all methods evaluated were able to attain this level of detection. Methods not performing to this standard were considered suboptimal. Two concentrations below this threshold were included (5 and 1 genome/ml serum), but the lower 95% confidence interval (95% CI) for the possible concentration in each 1-ml aliquot was below 1 genome per 1-ml sample at these concentrations (Table 1).
DNA extraction.All participants were encouraged to use their own method-ology. No recommendations were provided. A total of 15 different extraction systems were used (Table 2).
PCR amplification.Participating centers were asked to use their current am-plification system. It was recommended that DNA extracts be tested in dupli-cate—preferably triplicate. The use of an internal control PCR was recom-mended. The use of nested-PCR assays was discouraged, as these were considered too prone to false-positive results and unlikely to attain widespread acceptance outside specialist molecular centers. Twenty-two combinations of PCR target, input volume, final reaction volume, and amplification platform were provided (Table 2).
Data analysis.A data analysis subgroup collated the results and technical information and determined covariates for blinded statistical analysis by an independent party (Table 3).
Statistical analysis. (i) PCR positivity and genomic load.PCR positivity was determined according to the reported real-time PCR quantification cycle (Cq
value), using a universal positivity threshold of 45 cycles, and PCR results with a Cq value of⬎45 cycles were considered negative. In doing so, continuous Cq data were changed into qualitative positive and negative results, and positivity at each fungal burden was determined, along with the binomial exact 95% confi-dence interval. The specificity was calculated using the equation 1⫺positivity rate for the serum samples with no fungal burden. In addition, a receiver oper-ator curve (ROC) was constructed with PCR performance determined by a varying Cq threshold for positivity.
Mixed-model logistic regression analysis evaluated the probability of a positive result as a function of the genomic load using the PCR result as a binomial, positive or negative, outcome variable.
(ii) Linear analysis.The correlation between threshold cycle number (Cq) of real-time PCR and genomic load (log10transformed) was investigated by linear regression analysis. Samples with no fungal burden were excluded from the model, as data associated with a zero fungal burden would establish a disconti-nuity (genomes present/not present). To correctly evaluate the clustered nature of the data, a mixed (multilevel) random-coefficient model was used, grouping the various methods using the Stata command “xtmixed.” The basic model was Cq versus log10genomes/ml.
From the slope parameter, the mean reaction efficiency was calculated. The formula used was relative efficiency⫽10⫺1/slope⫺1, where the 100% efficiency corresponds to the doubling (⫻2) of the target sequence per PCR cycle. In this context, a slope of⫺3.32193 would correspond to a (full) relative efficiency of 100%. The same basic model was adapted to the analysis of covariates (sample volume, elution volume, template volume, PCR volume, extraction procedure, PCR platform, DNA sequence target, use of internal control). Each covariate was added singly to the above-described model (Cq versus log10genomes/ml. A 4-level categorical variable was used for extraction evaluation, with the following levels: Roche, Qiagen, bioMe´rieux, and Promega. A similar coding criterion was used for the PCR platform (four levels: ABI, LightCycler, Rotorgene, and SmartCycler) and DNA sequence target (four levels: 28S, 18S, internal tran-scribed spacer [ITS], and mitochondria). A multivariate approach was performed using the covariates indicated above. After adjustment, the final model retained the independently significant covariates.
RESULTS
[image:2.585.40.545.83.246.2]Twenty-two of the 23 centers requesting participation were
able to return results, but one of these centers used a
nested-PCR system, and the results were excluded from further
anal-ysis. A total of 29 different protocols (combined DNA
extrac-tion and PCR amplificaextrac-tion) were provided by the remaining
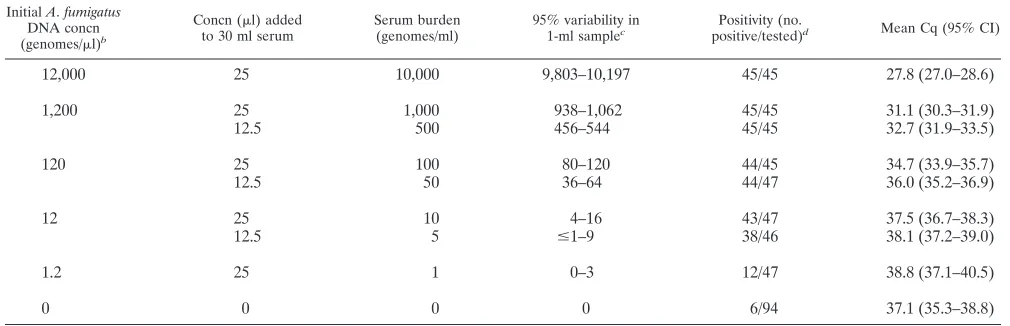
TABLE 1. Composition and corresponding positivity of the EAPCRI serum panel
a InitialA.fumigatusDNA concn (genomes/l)b
Concn (l) added to 30 ml serum
Serum burden (genomes/ml)
95% variability in
1-ml samplec Positivity (no.
positive/tested)d Mean Cq (95% CI)
12,000
25
10,000
9,803–10,197
45/45
27.8 (27.0–28.6)
1,200
25
1,000
938–1,062
45/45
31.1 (30.3–31.9)
12.5
500
456–544
45/45
32.7 (31.9–33.5)
120
25
100
80–120
44/45
34.7 (33.9–35.7)
12.5
50
36–64
44/47
36.0 (35.2–36.9)
12
25
10
4–16
43/47
37.5 (36.7–38.3)
12.5
5
ⱕ
1–9
38/46
38.1 (37.2–39.0)
1.2
25
1
0–3
12/47
38.8 (37.1–40.5)
0
0
0
0
6/94
37.1 (35.3–38.8)
a
Each panel was composed of one aliquot of each fungal burden and two negative control serum samples.
b
DNA extracted from 1.2⫻106
A. fumigatusconidia and serially diluted to attain desired concentrations assuming one conidium contains a single genome and 100% DNA extraction efficiency when initially extracting DNA. Initial DNA eluted in 100l.
c
Shown is the 95% confidence interval calculated on the basis of taking a 1-ml specimen from an initial 30-ml volume where the mean concentration will be as stated in the third column and assuming a Gaussian distribution.
d
Positivity defined as number of positive results per number of PCR replicates for each burden. Excluded are results from contaminated methods 10 and 21 and from unsuitable method 11 (Table 2).
on May 16, 2020 by guest
http://jcm.asm.org/
21 centers (Table 2). Two centers contributed three protocols,
four centers contributed two protocols, and 15 centers
contrib-uted a single protocol.
Aspergillus
PCR performance when testing serum
speci-mens.
Of the 29 different protocols used to test the serum
panel, 24 were able to reproducibly (100%) detect the
desig-nated threshold of 10 genomes/ml (Table 2). Despite detecting
the designated threshold, protocols 19 and 24 achieved 66.7%
and 0% positivity, respectively, when testing the 50-genome/ml
sample. Protocols 8 and 9 were able to detect the threshold in
two of three replicates, although protocol 9 was able to
repro-ducibly detect the sample containing 5 genomes/ml. Protocols
15 and 16 detected the threshold in one of two replicates.
[image:3.585.47.538.82.418.2]Protocol 11 was unable to detect the designated threshold;
most samples were determined to be inhibitory or as extraction
failures. Most protocols (21/24) attaining the threshold could
also reproducibly detect the sample with 5 genomes/ml,
al-though at this concentration protocols 14, 17, and 19 generated
positivity rates of 50% and 33.3%, respectively. Eleven
proto-cols (1, 3, 4, 6, 7, 10, 12, 13, 19, 21, and 25) were able to detect
the 1-genome/ml sample. At this concentration, not every 1-ml
aliquot will contain DNA (Table 1), and logistical regression
analysis generated a probability of 63.21% that an individual
1-ml aliquot of the 1-genome/ml specimen would actually
con-tain target, and this would be accentuated if volumes less than
1 ml were used for the initial DNA extraction. Protocols 10 and
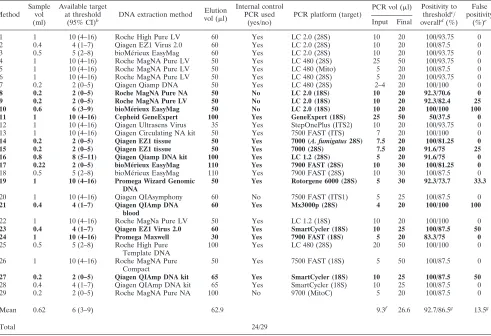
TABLE 2. Methods used to test the EAPCRI serum panel
aMethod Sample
vol (ml)
Available target at threshold
(95% CI)b DNA extraction method
Elution vol (l)
Internal control PCR used
(yes/no)
PCR platform (target)
PCR vol (l) Positivity to thresholdc
/ overalld
(%) False positivity
(%)e
Input Final
1 1 10 (4–16) Roche High Pure LV 60 Yes LC 2.0 (28S) 10 20 100/93.75 0
2 0.4 4 (1–7) Qiagen EZ1 Virus 2.0 60 Yes LC 2.0 (28S) 10 20 100/87.5 0
3 0.5 5 (2–8) bioMérieux EasyMag 60 Yes LC 2.0 (28S) 10 20 100/93.75 0
4 1 10 (4–16) Roche MagNA Pure LV 50 Yes LC 480 (28S) 25 50 100/93.75 0
5 1 10 (4–16) Roche MagNA Pure LV 50 Yes LC 480 (Mito) 5 20 100/87.5 0
6 1 10 (4–16) Roche MagNA Pure LV 50 Yes LC 480 (28S) 5 20 100/93.75 0
7 0.2 2 (0–5) Qiagen Qiamp DNA 50 Yes LC 480 (28S) 2–4 20 100/100 0
8 0.2 2 (0–5) Roche MagNA Pure NA 50 No LC 2.0 (18S) 10 20 92.3/70.6 0
9 0.2 2 (0–5) Roche MagNA Pure LV 50 No LC 2.0 (18S) 10 20 92.3/82.4 25
10 0.6 6 (3–9) bioMérieux EasyMag 50 No LC 2.0 (18S) 10 20 100/100 100
11 1 10 (4–16) Cepheid GeneExpert 100 Yes GeneExpert (18S) 25 50 50/37.5 0
12 1 10 (4–16) Qiagen Ultrasens Virus 35 Yes StepOnePlus (ITS2) 10 20 100/93.75 0
13 1 10 (4–16) Qiagen Circulating NA kit 50 Yes 7500 FAST (ITS) 7 20 100/100 0
14 0.2 2 (0–5) Qiagen EZ1 tissue 50 Yes 7000 (A. fumigatus28S) 7.5 20 100/81.25 0
15 0.2 2 (0–5) Qiagen EZ1 tissue 50 Yes 7000 (28S) 7.5 20 91.6/75 25
16 0.8 8 (5–11) Qiagen Qiamp DNA kit 100 Yes LC 1.2 (28S) 5 20 91.6/75 0
17 0.22 2 (0–5) bioMérieux EasyMag 110 Yes 7900 FAST (28S) 10 30 100/81.25 0
18 0.5 5 (2–8) bioMérieux EasyMag 110 Yes 7900 FAST (28S) 10 30 100/87.5 0
19 1 10 (4–16) Promega Wizard Genomic DNA
50 Yes Rotorgene 6000 (28S) 5 30 92.3/73.7 33.3
20 1 10 (4–16) Qiagen QIAsymphony 60 No 7500 FAST (ITS1) 5 25 100/87.5 0
21 0.4 4 (1–7) Qiagen QIAmp DNA blood
60 Yes Mx3000p (28S) 4 20 100/100 100
22 1 10 (4–16) Roche MagNa Pure LV 50 Yes LC 1.2 (18S) 10 20 100/100 0
23 0.4 4 (1–7) Qiagen EZ1 Virus 2.0 60 Yes SmartCycler (18S) 10 25 100/87.5 50
24 1 10 (4–16) Promega Maxwell 30 Yes 7900 FAST (18S) 5 20 83.3/75 0
25 0.5 5 (2–8) Roche High Pure Template DNA
100 Yes LC 480 (28S) 20 50 100/100 0
26 1 10 (4–16) Roche MagNA Pure Compact
50 Yes 7500 FAST (18S) 5 50 100/87.5 0
27 0.2 2 (0–5) Qiagen QIAmp DNA kit 65 Yes SmartCycler (18S) 10 25 100/87.5 50
28 0.4 4 (1–7) Qiagen QIAmp DNA kit 65 Yes SmartCycler (18S) 10 25 100/87.5 0
29 0.2 2 (0–5) Roche MagNA Pure NA 100 No 9700 (MitoC) 5 20 100/87.5 0
Mean 0.62 6 (3–9) 62.9 9.3f 26.6 92.7/86.5g 13.5g
Total 24/29
aResults for methods in boldface represent (i) procedures with less than 100% reproducibility at the designated threshold of 10 genomes/ml (n⫽5 protocols: 8, 9,
11, 15, and 16), (ii) positivity rates below the overall positivity of 86.1% (95% CI, 82.1 to 89.5%) (n⫽8 protocols: 8, 11, 14, 15, 16, 17, 19, and 24), or (iii) false-positivity rates (1⫺specificity) that result in specificity being below the overall specificity of 93.6% (95% CI, 86.6 to 97.6%) (n⫽7 protocols: 9, 10, 15, 19, 21, 23, and 27). Please note that despite reproducibly detecting the designating threshold, protocols 19 and 24 achieved 66.7% and 0% positivity, respectively, when testing the 50-genome/ml sample, resulting in⬍100% positivity to threshold. Please note that the overall sensitivity and specificity (stated above) were calculated excluding the data from methods 10, 11, and 21. LV, large volume; NA, nucleic acid; LC 2.0, Roche LightCycler 2.0; LC 480, Roche LightCycler 480; GeneExpert, Cepheid GeneExpert; StepOnePlus, ABI StepOnePlus; 7500 FAST, ABI 7500 FAST; 7000, ABI 7000; 7900 FAST, ABI 7900 FAST; Rotorgene 6000, Corbett Rotorgene 6000; LC 1.2, Roche LightCycler 1.2; Mx3000p, Stratagene Mx3000p; SmartCycler, Cepheid SmartCycler; 9700, ABI 9700; 28S, 28S rRNA gene; Mito, mitochondrial gene; 18S, 18S rRNA gene; ITS2, internal transcribed spacer 2; ITS, internal transcribed spacer; ITS1, Internal Transcribed Spacer 1; MitoC, mitochondrial cytochrome B.
bThe available burden and 95% CI when testing sample volumes less than 1 ml were determined assuming that the 1-ml aliquot provided contained the mid-point
value of 10 genomes/ml.
cPositivity to threshold represents the number of positive PCR results per test performed for each sample at, and above, the designated threshold of 10 genomes/ml
(10,000, 1,000, 500, 100, 50, and 10 genomes/ml).
dOverall positivity represents the number of positive PCR results per tests performed for the entire panel excluding the negative samples (10,000, 1,000, 500, 100,
50, 10, 5, and 1 genome/ml).
eFalse positivity represents the number of positive PCR results per test performed for both negative samples. fCalculated using a mid-point value of 3l for method 7.
gIncludes results for all 29 protocols listed in the table.
on May 16, 2020 by guest
http://jcm.asm.org/
21 generated a 100% (4/4) false-positivity rate with Cq values
almost identical to those for the samples containing
ⱕ
10
ge-nomes/ml, casting doubt on the validity of the “true”-positive
results. Additional false positivity was noted for protocols 9, 15
(1/4), 19 (2/6), 23, and 27 (1/2).
In determining overall serum PCR performance, assays 10
and 21 (extensive false positivity) and 11 (commercial method
designed to process WB and unsuitable for serum testing) were
considered unsatisfactory, leaving 26 protocols for analysis.
The overall sensitivity and specificity for
Aspergillus
PCR,
in-cluding all burdens were 86.1% (95% CI, 82.1 to 89.5%) and
93.6% (95% CI, 86.6% to 97.6%), respectively. Positive and
negative likelihood ratios and the diagnostic odds ratio (DOR)
were 13.5, 0.15, and 90.9, respectively.
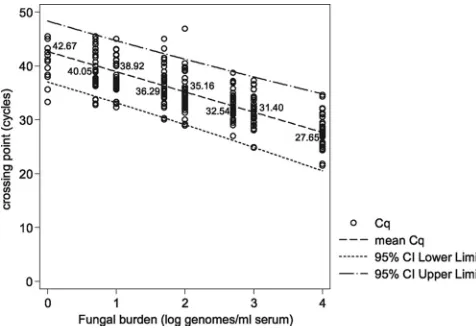
PCR performance and relationship with fungal burden.
Pre-dictably, there was a correlation between available fungal
bur-den and PCR positivity (basic linear model: slope,
⫺
3.756;
z
value,
⫺
27.99;
P
⬍
0.0001). The mean PCR efficiency
calcu-lated from the slope coefficient of the regression line was
84.6% (95% CI, 77.4 to 93.3) (Fig. 1). Positivity rates and mean
Cq values at the individual burdens are shown in Table 1 and
Fig. 1 and 2. One hundred percent positivity was attained when
testing the sample containing the equivalent of 500 genomes/
ml, although at 100, 50, and 10 genomes/ml, positivity
re-mained above 90%, and the difference in positivity rates
be-tween the four samples was not statistically significant (Table
1). The positivity rate for detecting burdens at or greater than
the predesignated detection limit of 10 genomes/ml was 97.1%
(95% CI, 94.5 to 99.6%). At 5 and 1 genome/ml, the positivity
rates were 82.6% and 25.5%, respectively. The latter result was
significantly lower than the positivity rates for every other
burden tested (difference between 5 and 1 genome/ml, 57.1%;
95% CI, 37.8 to 70.3;
P
⫽
0.0001). Logistical regression
anal-ysis determined that a sample containing a burden of 1.82
genomes/ml would be associated with a 50% positivity rate,
and the positivity rate when testing samples containing 1
ge-nome/ml would be 27.59% (Fig. 2), as predicted by the Poisson
distribution for a mean of 1 genome/ml.
[image:4.585.46.537.80.201.2]ROC analysis indicated that a Cq threshold of
ⱕ
43 cycles
ensured a good diagnostic accuracy (DOR
⫽
105) with a
sen-sitivity and specificity of 85.6% and 94.7%, respectively, and
using this threshold, 87.4% of samples were correctly classified
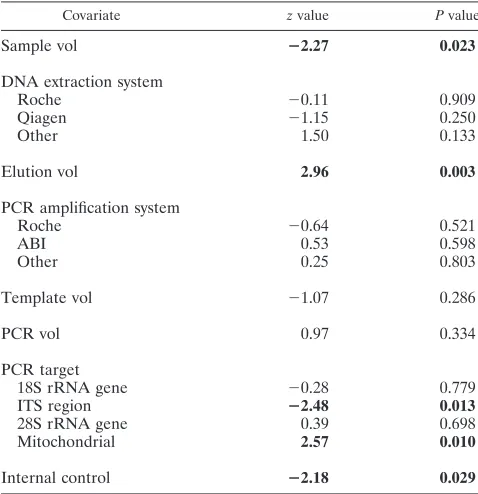
TABLE 3. Covariates investigated by linear regression methods in this study
Covariate Explanation
Sample vol ...Vol of sample used for DNA extraction
DNA extraction system...Extraction platform used to extract DNA from sample—Roche, Qiagen, or
combined other systems
aElution vol ...Vol used to elute DNA at the end of extraction
PCR amplification system...Amplification platform used to perform real-time PCR—Roche, Applied
Biosystems, or combined other systems
bTemplate vol ...Vol of DNA eluate used in each PCR
PCR vol...Final vol of each PCR
PCR target...Internal transcribed spacer target, 18S rRNA target, 28S rRNA target, or
mitochondrial DNA target for
Aspergillus
PCR
Internal control ...Internal control PCR used (yes/no)
abioMérieux EasyMag and Promega Wizard and Maxwell systems. Note one Qiagen system and one method using the bioMérieux EasyMag were excluded due to systemic contamination. The Cepheid GeneExpert was excluded on the basis of not being designed for use with serum.
b
[image:4.585.42.280.515.679.2]Cepheid SmartCycler and Corbett Rotorgene 6000. Note one method using the Stratagene Mx3000p and one using the Roche Lightcycler 2.0 were excluded due to systemic contamination. The Cepheid GeneExpert was excluded on the basis of not being designed for use with serum.
FIG. 1. Crossing point (Cq) values for
Aspergillus
PCR when
test-ing DNA extracted from serum spiked with various fungal burdens as
determined by linear regression. The linear equation for the mean Cq
values is
y
⫽ ⫺
3.76 log(
x
)
⫹
42.67, where log(
x
)
⫽
log
10genomes/ml.
[image:4.585.301.542.517.706.2]The 95% CI for the slope was
⫺
3.49 to
⫺
4.02.
FIG. 2. Probability of PCR positivity at various fungal burdens as
determined by logistic regression.
on May 16, 2020 by guest
http://jcm.asm.org/
(Fig. 3). Using a Cq threshold of
ⱕ
34 cycles generated a
specificity of 100%.
Linear regression analysis.
Bivariate linear regression
deter-mined a statistically significant positive association between PCR
sensitivity and larger sample volumes, use of an internal control,
and targeting the ITS region for PCR amplification. Separating
the PCR performance on the basis of sample volume used (
ⱖ
0.5
ml or
⬍
0.5 ml) generated sensitivities of 88.6% and 82.5%
(dif-ference, 6.1%; 95% CI, 14.9 to
⫺
1.0%;
P
⫽
0.1157), respectively.
When only low burdens (
ⱕ
10 genomes/ml) were included,
sensi-tivities of 76.9% and 54.7% for
ⱖ
0.5-ml and
⬍
0.5-ml starting
sample volumes, respectively, were generated. The difference in
sensitivity at this clinically typical level was significant (difference,
21.8%; 95% CI, 5.6 to 37.1%;
P
⫽
0.0091).
A negative effect on the sensitivity of the PCR assay was
de-tected for large elution volumes and for using mitochondrial
tar-gets for PCR (Table 4). When using elution volumes of
ⱖ
100
l,
40% of methods generated a positive PCR result, on at least one
occasion, for burdens of
ⱕ
5 genomes/ml, compared to 69.0% for
methods eluting DNA in
⬍
100-
l volumes, the difference in
pos-itivity being 29.0% (95% CI,
⫺
3.4 to 55.1%;
P
⫽
0.1424). More
significantly when detecting samples containing
ⱕ
5 genomes/ml,
Cq values occurred earlier for DNA extraction methods eluting
DNA in
⬍
100-
l volumes. The mean Cq for
⬍
100-
l elution
volumes was 37.8 cycles, compared to 41.7 cycles for methods
eluting DNA in volumes of
ⱖ
100
l (difference, 3.9 cycles; 95%
CI, 1.9 to 5.8 cycles;
P
⫽
0.0002).
Multivariate analysis confirmed the negative association
be-tween sensitivity and elution volume (
P
⫽
0.003) and PCR
amplifying the mitochondrial targets (
P
⫽
0.011).
DISCUSSION
The testing of serum is less technically demanding than the
testing of WB (7), since lysis of red and white cells is not required.
The perceived target in serum is free circulating DNA
(DNAe-mia), released from the organism through the actions of the host’s
immune defenses, antifungal therapy, autolysis, and possibly
ex-ponential growth (6, 9). Any cell-associated DNA sources in
se-rum will be limited, being trapped during blood clot formation
and/or removed during blood fractionation (12). If the target in
serum is free DNA, then the extraction process is straightforward,
although it is necessary to remove any serum components
(pro-teins, electrolytes, waste products, drugs, etc.) that may interfere
with the PCR amplification process.
[image:5.585.43.284.68.224.2]Theoretically, targeting free circulating DNA through serum
testing requires less standardization as commercial extraction
methods can be employed. The commercial DNA extraction
systems evaluated in the study provided comparable levels of
performance. Nevertheless, each extraction system is directly
associated with other variables such as sample input and
elu-tion volume, and it is essential to determine the analytical
performance thresholds of any protocols utilizing commercial
kits, highlighting methodologies that provide inadequate
per-formance and should not be used in clinical practice. In this
study, only five protocols (8, 9, 11, 15, and 16) failed to
repro-ducibly detect the designated detection threshold of 10
ge-nomes/ml serum (Table 2). Method 11 had been designed to
test WB samples, providing excellent performance when
test-ing this specimen type (11). Betest-ing fully automated, it could not
be adjusted for serum testing; consequently, results were poor,
and it should not be used for
Aspergillus
PCR testing of serum.
Each protocol is constructed of many individual, yet linked,
steps that will influence further steps downstream, and it is
important to identify the critical step or steps that impact
performance. For example, methods 8 and 9 use extraction
platforms similar to methods 4 to 6 and 22, yet the latter
methods provide better performance. It would be easy to
con-clude that the extraction platform provided inconsistent
inter-laboratory performance. However, detailed examination of the
protocols showed that methods 8 and 9 only extracted 0.2 ml of
TABLE 4. Bivariate linear regression analysis between Cq and the
additional covariates, excluding log
10genomes/ml
a
Covariate zvalue Pvalue
Sample vol
ⴚ
2.27
0.023
DNA extraction system
Roche
⫺
0.11
0.909
Qiagen
⫺
1.15
0.250
Other
1.50
0.133
Elution vol
2.96
0.003
PCR amplification system
Roche
⫺
0.64
0.521
ABI
0.53
0.598
Other
0.25
0.803
Template vol
⫺
1.07
0.286
PCR vol
0.97
0.334
PCR target
18S rRNA gene
⫺
0.28
0.779
ITS region
ⴚ
2.48
0.013
28S rRNA gene
0.39
0.698
Mitochondrial
2.57
0.010
Internal control
ⴚ
2.18
0.029
a
[image:5.585.300.539.453.700.2]Significant associations are highlighted in boldface. Note that a negativez value predicts an earlier Cq, and thus a higher probability of PCR positivity, whereas a positive value has the opposite effect.
FIG. 3. Receiver operator curve for
Aspergillus
PCR methods when
testing serum samples. PCR positivity was determined according to a
variable Cq threshold. (Representative Cq thresholds are highlighted.)
The area under the ROC was 0.9150 (95% CI, 0.89184 to 0.93806).
on May 16, 2020 by guest
http://jcm.asm.org/
the available specimen, compared to 1.0 ml for methods 4 to 6
and 22, limiting the amount of DNA target for extraction and
negatively affecting final performance. In this study, a positive
association between PCR positivity and the volume of starting
material was shown.
False positivity was not a major issue, although two methods,
10 and 21, consistently generated false-positive results,
sug-gesting a contamination issue. Both DNA extraction systems in
these protocols had previously been associated with
Aspergillus
DNA contamination (4) (EAPCRI, group communication),
but within this study, other centers had also used these systems
without contamination, highlighting the transient, possibly
batch-variable nature of this problem. Alternatively, the
con-tamination issue may be associated with the individual center
or other parts of these individual processes, and fungal DNA
contamination of certain PCR reagents has been noted (5).
A PCR positivity threshold of 43 cycles should be used to
provide the greatest degree of diagnostic accuracy, and at this
threshold, 87.4% of results were correctly classified. This is in
keeping with a previous report where the authors also
con-cluded that clinically the burden of DNA in serum was very
low (fg/
l), to such a degree that positive PCR signals
be-came inconsistent (8).
The overall sensitivities and and specificities for
Aspergillus
[image:6.585.39.543.76.477.2]PCR testing of serum were 86.1% and 93.6%, respectively.
This compares favorably with the same performance
parame-ters for
Aspergillus
PCR methods testing WB (11). When
test-ing WB ustest-ing protocols compliant with the EAPCRI
recom-mendations provided to participants, the sensitivity and
specificity were 88.7% and 91.6%, respectively. The probability
of obtaining positive PCR results at specific fungal burdens is
higher for serum than WB PCR, which is probably a
conse-quence of the additional processing required when testing WB
(results not shown). As the initial evaluation of existing serum
PCR methods provides performance that is comparable to that
of the agreed WB PCR protocol, it is not necessary to attempt
to enhance performance through the evaluation of further
serum panels with associated procedural recommendations.
Indeed, our initial hypothesis that serum PCR methods would
require less technical standardization appears to be correct.
TABLE 5. Recommendations of the EAPCRI for
Aspergillus
PCR protocols when testing serum
Result Recommendation
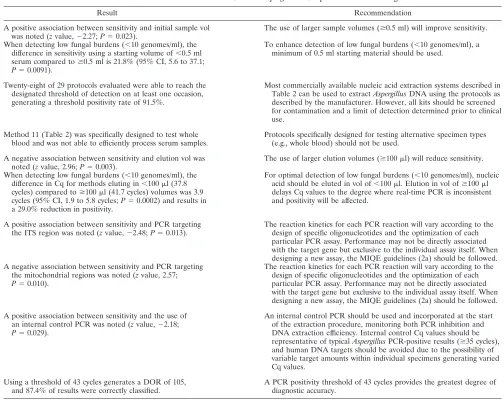
A positive association between sensitivity and initial sample vol was noted (zvalue,⫺2.27;P⫽0.023).
The use of larger sample volumes (ⱖ0.5 ml) will improve sensitivity.
When detecting low fungal burdens (⬍10 genomes/ml), the difference in sensitivity using a starting volume of⬍0.5 ml serum compared toⱖ0.5 ml is 21.8% (95% CI, 5.6 to 37.1;
P⫽0.0091).
To enhance detection of low fungal burdens (⬍10 genomes/ml), a minimum of 0.5 ml starting material should be used.
Twenty-eight of 29 protocols evaluated were able to reach the designated threshold of detection on at least one occasion, generating a threshold positivity rate of 91.5%.
Most commercially available nucleic acid extraction systems described in Table 2 can be used to extractAspergillusDNA using the protocols as described by the manufacturer. However, all kits should be screened for contamination and a limit of detection determined prior to clinical use.
Method 11 (Table 2) was specifically designed to test whole blood and was not able to efficiently process serum samples.
Protocols specifically designed for testing alternative specimen types (e.g., whole blood) should not be used.
A negative association between sensitivity and elution vol was noted (zvalue, 2.96;P⫽0.003).
The use of larger elution volumes (ⱖ100l) will reduce sensitivity.
When detecting low fungal burdens (⬍10 genomes/ml), the difference in Cq for methods eluting in⬍100l (37.8 cycles) compared toⱖ100l (41.7 cycles) volumes was 3.9 cycles (95% CI, 1.9 to 5.8 cycles;P⫽0.0002) and results in a 29.0% reduction in positivity.
For optimal detection of low fungal burdens (⬍10 genomes/ml), nucleic acid should be eluted in vol of⬍100l. Elution in vol ofⱖ100l delays Cq values to the degree where real-time PCR is inconsistent and positivity will be affected.
A positive association between sensitivity and PCR targeting the ITS region was noted (zvalue,⫺2.48;P⫽0.013).
The reaction kinetics for each PCR reaction will vary according to the design of specific oligonucleotides and the optimization of each particular PCR assay. Performance may not be directly associated with the target gene but exclusive to the individual assay itself. When designing a new assay, the MIQE guidelines (2a) should be followed. A negative association between sensitivity and PCR targeting
the mitochondrial regions was noted (zvalue, 2.57;
P⫽0.010).
The reaction kinetics for each PCR reaction will vary according to the design of specific oligonucleotides and the optimization of each particular PCR assay. Performance may not be directly associated with the target gene but exclusive to the individual assay itself. When designing a new assay, the MIQE guidelines (2a) should be followed.
A positive association between sensitivity and the use of an internal control PCR was noted (zvalue,⫺2.18;
P⫽0.029).
An internal control PCR should be used and incorporated at the start of the extraction procedure, monitoring both PCR inhibition and DNA extraction efficiency. Internal control Cq values should be representative of typicalAspergillusPCR-positive results (ⱖ35 cycles), and human DNA targets should be avoided due to the possibility of variable target amounts within individual specimens generating varied Cq values.
Using a threshold of 43 cycles generates a DOR of 105, and 87.4% of results were correctly classified.
A PCR positivity threshold of 43 cycles provides the greatest degree of diagnostic accuracy.
on May 16, 2020 by guest
http://jcm.asm.org/
Nevertheless, mixed-model linear analysis did highlight several
important parameters that form the basis of the EAPCRI
recommendations for
Aspergillus
PCR when testing serum
samples, as highlighted in Table 5.
There were no significant associations between sensitivity
and DNA template volume, PCR amplification platform, and
final PCR volume, although PCR amplification of the ITS
region was positively associated with sensitivity, and the
oppo-site was true for the mitochondrial targets. This should be
interpreted with caution as the reaction kinetics for each PCR
will vary according to the design of specific oligonucleotides,
and the optimization of each particular PCR assay and
perfor-mance may not be directly associated with the target gene but
exclusive to the individual assay.
To conclude, the testing of serum by
Aspergillus
PCR can
be performed using commercial nucleic acid extraction
methods, providing standardization and quality control. The
EAPCRI previously showed PCR amplification not to be
rate limiting, and commercial extraction in combination
with most amplification methods will provide acceptable
analytical performance(11). The use of serum is less
tech-nical than testing of WB, reducing both time to result
re-porting and labor, and permits fully automated nucleic acid
extraction, limiting performance variability. It allows the use
of a single sample for galactomannan enzyme-linked
immu-nosorbent assay (ELISA),

-
D-glucan, and PCR analysis,
thereby reducing costs if throughput screening of
high-risk patients is required. As with WB PCR testing, a
multi-center clinical trial is paramount to determine the true
clin-ical validity and utility of serum PCR testing. More so, as the
clinically relevant biological target circulating in blood has
not been precisely determined, a multicenter comparison of
WB PCR (targeting fungal cell-associated DNA) and serum
PCR (targeting free circulating DNA) is required to
deter-mine the clinically relevant biological target and
conse-quently the optimal clinical specimen for PCR testing.
ACKNOWLEDGMENTS
We acknowledge the European Aspergillus Initiative of the ISHAM.
The EAPCRI thanks Andreas Opitz (Institute of Transfusional
medicine, Wuerzburg University Hospital, Wuerzburg, Germany) for
drawing and screening the blood kindly donated by our volunteers.
The EAPCRI Steering Group consists of the following members: J.
Peter Donnelly, chair of foundation, Radboud University Nijmegen
Medical Centre, Nijmegen, The Netherlands; Juergen Loeffler,
Secre-tary, Wuerzburg University, Wuerzburg, Germany; Rosemary A
Barnes, treasurer, Cardiff University, Cardiff, United Kingdom.
The EAPCRI Laboratory Working Group consists of the following
members: Juergen Loeffler, Laboratory Working Group—lead, Data
Analysis Group, Wuerzburg University, Wuerzburg, Germany; P.
Lewis White, panel development and distribution, Data Analysis
Group, NPHS Microbiology, Cardiff, United Kingdom; Stephane
Bretagne, Data Analysis Group, Henri Mondor Hospital, Creteil,
France; Willem Melchers, EAPCRI website administrator, Radboud
University, Nijmegen Medical Centre, Nijmegen, The Netherlands;
Lena Klingspor, Karolinska University Hospital, Stockholm, Sweden;
Niklas Finnstrom, Cepheid AB, Toulouse, France; Elaine McCulloch,
External Quality Control Programme, Royal Hospital for Sick
Chil-dren, Glasgow, United Kingdom; Craig Williams, External Quality
Control Programme, Royal Hospital for Sick Children, Glasgow,
United Kingdom; and Manuel Cuenca-Estrella, Sapnish National
Cen-tre for Microbiology, Instituto de Salud Carlos III, Madrid, Spain.
The EAPCRI Clinical Working Group consists of the following
members: Rosemary A. Barnes, Clinical Working Group—lead,
Car-diff University, CarCar-diff, United Kingdom; Catherine Cordonnier,
Henri Mondor Hospital, Creteil, France; Johan Maertens, University
Hospital Gasthuisberg, Leuven, Belgium; Lena Klingspor, Karolinska
University Hospital, Stockholm, Sweden; Werner Heinz, Wuerzburg
University, Wuerzburg, Germany; and Brian Jones, Glasgow Royal
Infirmary, Glasgow, United Kingdom.
The EAPCRI Statistical Working Group consists of the following
members: Carlo Mengoli, University of Padua, Padua, Italy; Mario
Cruciani, University of Verona, Verona, Italy; Juergen Loeffler,
Wuer-zburg University, WuerWuer-zburg, Germany; Rosemary A. Barnes, Cardiff
University, Cardiff, United Kingdom; and J Peter Donnelly, Radboud
University Nijmegen Medical Centre, Nijmegen, The Netherlands.
We thank the following members of the participating laboratories:
Vanda Chrenkova, Motol Hospital, Prague, Czech Republic; Malcolm
Guiver, HPA Northwest, Manchester, United Kingdom; Catriona
Halli-day and Sue Sleiman, Westmead Hospital, Westmead, NSW, Australia;
Chris Linton and Elizabeth Johnson, UK Mycology Reference Lab, HPA
Southwest, Bristol, United Kingdom; Rebecca Gorton and Chris Kibbler,
Royal Free Hospital, London, United Kingdom; Martina Lengerova,
Central Molecular Biology, Gene Therapy and Haematology Clinic,
Brno, Czech Republic; Eva Rosello Mayans, Vall d’Hebron University
Hospital, Barcelona, Spain; Tom Rogers and Oliver Morton, Trinity
Col-lege, Dublin, Ireland; Boualem Sendid, Lille University, Lille, France;
Angie Caliendo, Emory University, Atlanta, GA; Tom Patterson,
UTH-CSA, San Antonio, TX; Katrien Lagrou, University Hospital
Gasthuis-berg, Leuven, Belgium; Mark Wilks, Barts and the London Hospital,
London, United Kingdom; Adrian Moody, Myconostica, Ltd.,
Man-chester, United Kingdom; Maria J. Buitrago and Leticia Bernal-Martinez,
Spanish National Centre for Microbiology, Madrid, Spain; and Jaques
Billes and Phillippe Hauser, Lausanne, Switzerland.
REFERENCES
1.Bossuyt, P. M., et al.2004. Towards complete and accurate reporting of studies of diagnostic accuracy: the STARD initiative. Fam. Pract.21:4–10. 2.Bretagne, S., et al.1998. Comparison of serum galactomannan antigen
de-tection and competitive polymerase chain reaction for diagnosing invasive aspergillosis. Clin. Infect. Dis.26:1407–1412.
2a.Bustin, S. A., et al.2009. The MIQE guidelines: minimum information for the publication of quantitative real-time PCR experiments. Clin. Chem.55:611–622. 3.Costa, C., et al.2002. Real-time PCR coupled with automated DNA extraction and detection of galactomannan antigen in serum by enzyme-linked immu-nosorbent assay for diagnosis of invasive aspergillosis. J. Clin. Microbiol.40: 2224–2227.
4.Jaeger, E. E., et al.2000. Rapid detection and identification ofCandida, Aspergillus, and Fusariumspecies in ocular samples using nested PCR. J. Clin. Microbiol.38:2902–2908.
5.Loeffler J., et al.1999. Contaminations occurring in fungal PCR assays. J. Clin. Microbiol.37:1200–1202.
6.Mennink-Kersten, M. A., D. Ruegebrink, N. Wasei, W. J. Melchers, and P. E. Verweij.2006. In vitro release byAspergillus fumigatusof galactofuranose antigens, 1,3-beta-D-glucan, and DNA, surrogate markers used for diagnosis of invasive aspergillosis. J. Clin. Microbiol.44:1711–1718.
7.Millon, L., et al.2011. Ribosomal and mitochondrial DNA target for real-time PCR diagnosis of invasive aspergillosis. J. Clin. Microbiol.49:1058–1063. 8.Millon, L., et al.2005. Use of real-time PCR to process the first
galacto-mannan-positive serum sample in diagnosing invasive aspergillosis. J. Clin. Microbiol.43:5097–5101.
9.Morton, C. O., et al.2010. Dynamics of extracellular release ofAspergillus fumigatus DNA and galactomannan during growth in blood and serum. J. Med. Microbiol.59:408–413.
10.Pham, A. S., et al.2003. Diagnosis of invasive mold infection by real-time quantitative PCR. Am. J. Clin. Pathol.119:38–44.
11.White, P. L., et al.2010.AspergillusPCR: one step closer towards standard-ization. J. Clin. Microbiol.48:1231–1240.
12.White, P. L., and R. A. Barnes.2009.AspergillusPCR, p. 373–390.InJ.-P. Latge and W. J. Steinbach (ed.),Aspergillus fumigatusand aspergillosis. ASM Press, Washington, DC.
13.White, P. L., C. J. Linton, M. D. Perry, E. M. Johnson, and R. A. Barnes. 2006. The evolution and evaluation of a whole blood polymerase chain reaction assay for the detection of invasive aspergillosis in hematology pa-tients in a routine clinical setting. Clin. Infect. Dis.42:479–486.
14.Williamson, E. C., et al.2000. Diagnosis of invasive aspergillosis in bone marrow transplant recipients by polymerase chain reaction. Br. J. Haematol. 108:132–139.