6
II
February 2018
A Comparative Study of Different Classification
Algorithms on Kidney Disease Prediction
Rajni Garg1, Vikas Mongia2 1, 2
Assistant Professor, Guru Nanak College, Moga.
Abstract: Medical wellness is very basic need of everyone in today’s society. Medical problems are increasing exponentially day by day, so as data is also increased like medical data, healthcare data, patient data, their treatment and source management data. So it becomes difficult to take the right decision at the right time from the large medical dataset. Medical diagnosis is an important but complicated task that should be performed accurately and efficiently and its automation would be very useful. A system for automated medical diagnosis would enhance medical care and reduce costs. Data mining play a vital role to discover the hidden pattern of medical diagnosis. In this paper systematic study on “Data mining in Chronic_Kidney_Disease dataset” has been done. In this study five data mining algorithms are executed on Chronic_Kidney_Disease dataset. Quality of these algorithms is measured on the basis of four parameters like correctly classified instance, incorrectly classified instance, execution time, error rate. The experiment is done using 10 fold cross validation method. The study has proven that accuracy of Naïve Byaes classification algorithm is being considered highest i.e. 98.75% and minimum execution time is taken by random tree i.e. 0.005 seconds. Feature reduction technique is used for identifying and removing those at tributes that do not contribute towards classification of the dataset. In this work, chi square attribute selection technique is used to evaluate the worth of an at tribute with respect to the class. Then ranker algorithm is used to arrange these attributes in descending order according to their chi square value and last 5 attributes having lowest ranked value are removed based on assumption that these attribute don’t contribute to the classification. The comparison is also made in this study which shows the affect of computation time and accuracy before feature reduction and after feature reduction applied. Our study shows that after feature reduction most of the algorithms improved their accuracy and computation.
Keyword: Data mining, classification, chi square, ranker algorithm
I. INTRODUCTION
Introduction: Kidney problem is a most prevailing problem in the society. Every year million of cases of Kidney diseases are reported worldwide. In the past decades many innovative methods and techniques have been developed for earlier detection of kidney diseases but further advancement are required for detection, prevention or cure of this disease. Past data of Kidney patients can be very useful for prediction of presence of kidney problem in a patient through symptoms. In this study data of 400 patients have been collected and five data mining algorithms are applied on this dataset to identify the best classifier for prediction of kidney disease in the patient.
II. DATA MINING
To discover new information from the present data, different data mining techniques proposed by [1] are used. N.T. Nghe. et.al has made comparative study of these data mining techniques on WEKA tool [2]. Due to the computational efficiency and speed of WEKA [3] the same is used in this research. The most commonly used data mining methods are: Association, classification and clustering.
A. Association
association rule is used to find the relationship between one instance to another instance [4]. In the context of our research association rule can be used to find the linking between patient’s attribute and kidney disorder. If the patient’s red blood cells, serum creatinine, blood glucose random, sodium are not in range then he is most likely to chance of kidney disorder.
B. Classification
help of training data and in the next phase this model is tested with test tuples and its accuracy is determined. Back propagation. K-nearest neighbor and decision tree are good example of classification technique. In this research decision tree are used for the prediction.
C. Clustering
Clustering divides the dataset into different regions called clusters [4]. Cluster comes under un-supervised learning because classes are not predefined. Object under one cluster have similar values and this value differs from other clusters for instance, in this dataset, clusters can be generated on the basis of patient’s serum creatinine, specific gravity, packed cell volume etc.
III. LITERATURE REVIEW
In [5] analyzed three different classification algorithms named Artificial Neural Network, Logical Regression and Decision tree. All these algorithms are analyzed in Tanagra machine learning tool. The 10 fold cross validation is used. These classification algorithms have been applied on kidney dialysis dataset. Their research show that artificial neural network classification technique produced more correctly classified instance than decision tree and logical regression. I n [6] followed a hybrid approach that takes the advantage of Artificial Neural Network and Logical Regression. In this study author revealed that artificial neural network and logical regression are both considered good classifier on kidney transplantation problem but both approaches are complimentary to each other. Comparison has been done based on the sensitivity and specificity of logistic regression and artificial neural network in prediction of kidney rejection in ten training and validating data set of kidney transplantation recipient. In [7] showed that clustering algorithm produce better result as compare to other technique of data mining on kidney dialysis parameters. In their study author has used K-mean clustering algorithm which is used to find the correlation between the parameter and information about patient survival. In [8] used six classification algorithms named Naïve Bayes, MLP, J48, SVM, Decision Table, Conjunction rule on Kidney disease dataset. All three algorithms are fetched and analyzed in WEKA machine learning tool. In this study MLP algorithm produced 99.75% accuracy, which is highest among fellow classification techniques. In [9] has implemented three different neural network model named modular neural network (MNN), back propagation neural network (BPN), and generalized feed forward neural network (GRNN) on chronic kidney disease dataset. N Builder tool is used to analyze the performance of three neural networks. In their study Genetic Algorithm (GA) is embedded in their neural factor. After applying GA performance of three neural networks has improved. Among all three neural networks BPN recorded the highest accuracy. In [10] developed a system which is used to predict the function of kidney by applying three classification algorithms named BPN, RBF, RF. R Tool and WEKA machine learning tool were used to analyze the result of three algorithms. In their study 1000 patient of kidney disease with 15 attributes are studied.
IV. DATA MINING TECHNIQUES
In this research four classification techniques are used: Decision Tree, Bayesian, Support Vector Machine and lazy learner. These models are used in data mining to improve prediction in our research these algorithms are compared to find out best algorithm that predicts the possibility of kidney disorder in a patient. In the next section brief description of these classification models is provided.
A. Decision Tree
Decision Trees are most powerful classification models used in prediction. These models construct tree like structure with class labels as its leaf node and used to predict different medical problems [11]. The Random Tree decision tree classification model is used in our research. This algorithm uses some mathematical models like: information gain. Gain ration and ginni index. These mathematical models are used to find out splitting attribute from the input parameter.
B. Bayesian Classification
It is a predicted model which is based on bayes’ theorem. Naïve Bayesian classifier works on assumptions “class conditional independence” which means that the effect of an attribute value on a given class is independence of the values of other attributes. In Bayesian classification, a tuple X only belongs to a class Ci only in the class has highest posterior probability condition on X i.e
P(Ci/X) > P(Cj/X) ∀ 1<= j <= m, j≠ i
Where P(Ci/X) = ( / ) ( ) ( )
C. Support Vector Machine
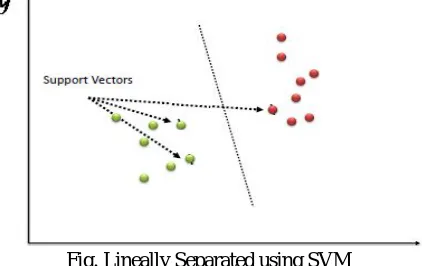
[image:4.612.202.413.154.287.2]SVM is a classification algorithm which is based on supervised machine learning. In SVM every data element is plotted in n-dimensional space. Number of dimension is equal to number of attributes. After plotting all data elements a line is drawn in such a way that separate two classes completely. Sequential Minimum Optimization(SMO) is used in this research to classify kidney disease training data.
Fig. Lineally Separated using SVM
D. Lazy Learner
It is a classification model which is also called ‘learning from your neighbors’. Lazy Learner classification model is so called because unlike either learner these models do not create classification model when the training data is provided. It simply stores the training data. When a test tuple is inserted then this algorithm compares it with the similar tuple of training data. KStar classifier and cased based reasoning classifier is lazy learner. In our research K Star algorithm is used. This algorithm compares the test tuple to the training tuples that are very similar to the test tuple. The closeness can be measured by the following formula.
Dist(X1, X2) = ∑ (x1i− x2i )2
Where X1, X2 are tuples and x1i, x2i are attributes of these tuples.
V. DATA MINING PROCESS
A. Problem Definition
Kidney disorder is a severe problem in which kidney malfunctions drastically. It is a major problem prevailing in women worldwide. Till now, exact factor responsible for this problem are unknown. But some attribute like age, life style and family history can play significant role in this disease. Other factors like hemoglobin, serum creatinine, specific gravity, packed volume cell and albumin are also dominating attribute for diagnose of kidney disorder. In our research the aim is to find the best classifier that predicts the possibility of kidney disease on the basis of some attribute of patient in advance so that necessary action can be taken to save life of a patient.
B. Data Source
To perform research, data is collected from UCI repository. It is an online repository having 412 different datasets. The aim of this repository is to provide data to machine learning community. The UCI program is known for its completeness in data and its accuracy.
C. Understanding the Data
VI. EXPERIMENT AND RESULT
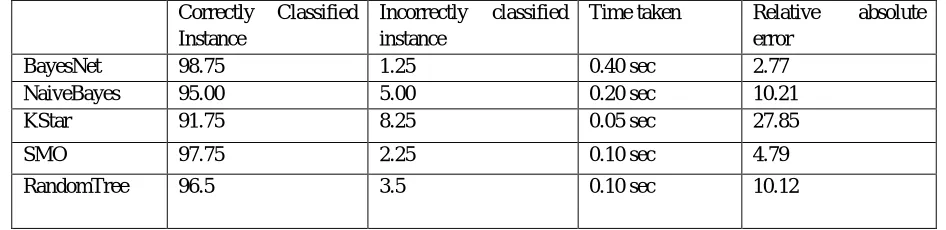
In this section, five different classification algorithms applied are on Chronic Kidney Dataset. WEKA machine learning tool is used to analyze the result of these algorithms. Parameters like correctly classified, incorrectly classified, time taken, Relative absolute error are observed of each classification algorithms which is shown in the following table.
Correctly Classified Instance
Incorrectly classified instance
Time taken Relative absolute error
BayesNet 98.75 1.25 0.40 sec 2.77
NaiveBayes 95.00 5.00 0.20 sec 10.21
KStar 91.75 8.25 0.05 sec 27.85
SMO 97.75 2.25 0.10 sec 4.79
[image:5.612.69.542.535.650.2]RandomTree 96.5 3.5 0.10 sec 10.12
Table Representing result of five classification algorithms on Kidney Dataset
A. Accuracy and computation
In this research BayesNet classifier gave 98.75% accuracy, which is the highest among the other classification algorithms. Other classifier algorithms like SMO and Random Tree also gave accuracy near to the Bayes Net. On the contrary KStar took minimum time i.e .05 second to compute 400 instances with 25 attributes. But the accuracy rate of KStar is not as good as Bayes Net.
Sr. No Attributes Attribute’s Description
1 Hemo Hemoglobin
2 Sc serum creatinine
3 Sg specific gravity
4 Pcv packed cell volume
5 Al Albumin
6 Htn hypertension
7 Dm diabetes mellitus
8 Rbcc red blood cell count
9 Bu blood urea
10 Bgr blood glucose random
11 Sod Sodium
12 Bp blood pressure
13 Pc pus cell
14 Appet Appetite
15 Pot potassium
16 Pe pedal edema
17 Age Age
18 Rbc red blood cells
19 Su Sugar
20 Ane Hemoglobin
21 Wbcc white blood cell count
22 Pcc pus cell clumps
23 Cad coronary artery disease
B. Dimensionality Reduction
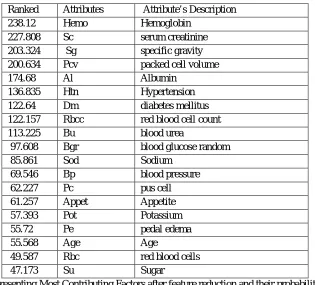
[image:6.612.151.466.196.481.2]Dimensionality reduction is features of classification technique in which those attribute are removed from the studies which don’t or hardly contribute to the results. So if these attribute are removed from the study then overall result can be improved. In this study gain ration technique is used to find the most contributing attribute and then ranker algorithm is applied to rank the attribute according to their importance in descending order according and last three attributes having lowest gain ratio can be removed. The attributes hemoglobin, white blood cell count, pus cell clumps, coronary artery disease and bacteria has minimum gain ratio. These five attributes are removed because they do not contribute toward data classification. This will result in less computation time and less memory requirement.
Table representing Most Contributing Factors after feature reduction and their probability
Comparison of results before and after feature reduction has been done. Result shows that three algorithms name NaiveBayes, KStar and SMO have improved their results in term of correctly classified instance. Time taken by these algorithms after feature reduction has also reduced. On contrary, result of some algorithms like BayesNet and RandomTree has not been affected.
VII. CONCLUSION
The experimental results have shown that different classification algorithms behave differently on the same dataset. Some algorithms are good in correctly classification, some are good in execution time and some algorithms are good in mean squared error etc… Some attributes do not contribute to the target variable and if remove these attribute from the data set, overall performance of the algorithm can be improved. In our experiment there are five variable named hemoglobin, white blood cell count, pus cell clumps,
Ranked Attributes Attribute’s Description
238.12 Hemo Hemoglobin
227.808 Sc serum creatinine 203.324 Sg specific gravity 200.634 Pcv packed cell volume
174.68 Al Albumin
136.835 Htn Hypertension 122.64 Dm diabetes mellitus 122.157 Rbcc red blood cell count
113.225 Bu blood urea
97.608 Bgr blood glucose random
85.861 Sod Sodium
69.546 Bp blood pressure 62.227 Pc pus cell 61.257 Appet Appetite
57.393 Pot Potassium
55.72 Pe pedal edema
55.568 Age Age
49.587 Rbc red blood cells
47.173 Su Sugar
Before Feature Reduction After Feature Reduction Increased Result in % Correctly Classified Correctly classified
BayesNet 98.75 98.75 0.0
NaiveBayes 95.00 95.5 0.52
KStar 91.75 93.25 1.60
SMO 97.75 98.5 0.76
coronary artery disease and bacteria do not contribute the class attribute and if we remove these attribute, correctly classified instance will remain same but execution speed of the algorithm sure increase.
REFERENCES
[1] H. Trevor, T. Robert, and F. Jerome, The Elements of Statistical Learning: Data Mining, Inference, and Prediction, 2nd ed., vol. 2. Springer: New York, 2009, pp. 32-36.
[2] N.T.Nghe, P. Janecek, and P. Haddawy, “A comparative analysis of techniques for predicting academic performance", ASEE/IEEE Frontiers in Education Conference, pp. T2G7-T2G12, 2007.
[3] M. Lichman, UCI Machine Learning Repository, http://www.cs.waikato.ac.nz/ml/weka,2013
[4] J. Han and M. Kamber, Data Mining: Concepts and Techniques, 2nd ed. University of Illinois at Urbana-Champaign Elsevier San Francisco, 2009, pp. 285-306
[5] Lakshmi. K.R, Nagesh. Y and VeeraKrishna. M, (2014) Performance Comparison Of Three Data Mining Techniques For Predicting Kidney Dialysis Survivability, International Journal of Advances in Engineering & Technology, Mar., Vol. 7, Issue 1, pg no. 242-254.
[6] Giovanni Caocci, Roberto Baccoli, Roberto Littera, Sandro Orrù, Carlo Carcassi and Giorgio La Nasa, Comparison Between an Artificial Neural Network and Logistic Regression in Predicting Long Term Kidney Transplantation Outcome, Chapter 5, an open access article distributed under the terms of the Creative Commons Attribution License, http://dx.doi.org/10.5772/53104
[7] B. V. Ravindra,N. Sriraam and M.Geetha "Discovery of significant parameters in kidney dialysis data sets by K-means algorithm," in , 2014 International Conference on Circuits, Communication, Control and Computing, Bangalore, 2014, November.
[8] Lambodar Jeena, Narendra Ku. Kamila, “Distributed Data Mining Classification Algorithms for Prediction of Chronic Kidney Disease”, International Journal of Engineering Research in management and Technology ISSN : 2278-9359 (Vol-4, issue-11)
[9] Ruey Key, “Constructing Models for Chronic Kidney Disease Detection and Risk Estimation”, IEEE International Symposium on Intelligent Control. [10] S. Ramya , Dr. N. Radha, “Diagnosis of Chronic Kidney Disease Using Machine Learning Algorithms”, International Journal of Innovative Research in
Computer and Communication Engineering, Vol 4, issue 1, January 2016.