J
OURNAL OFC
LINICALM
ICROBIOLOGY, Nov. 2010, p. 4072–4082
Vol. 48, No. 11
0095-1137/10/$12.00
doi:10.1128/JCM.00659-10
Copyright © 2010, American Society for Microbiology. All Rights Reserved.
Improved Identification of Epidemiologically Related Strains of
Salmonella enterica
by use of a Fusion Algorithm Based on
Pulsed-Field Gel Electrophoresis and Multiple-Locus
Variable-Number Tandem-Repeat Analysis
䌤
†
S. L. Broschat,
1,2* D. R. Call,
1,2M. A. Davis,
2D. Meng,
1S. Lockwood,
1R. Ahmed,
3and T. E. Besser
2School of Electrical Engineering and Computer Science
1and Department of Veterinary Microbiology and Pathology,
2Washington
State University, Pullman, Washington 99164, and National Microbiology Laboratory, Canadian Science Centre for
Human and Animal Health, Winnipeg, MB, Canada
3Received 29 March 2010/Returned for modification 18 June 2010/Accepted 17 August 2010
Pulsed-field gel electrophoresis (PFGE) and multiple-locus variable-number tandem-repeat analysis
(MLVA) are used to assess genetic similarity between bacterial strains. There are cases, however, when neither
of these methods quantifies genetic variation at a level of resolution that is well suited for studying the
molecular epidemiology of bacterial pathogens. To improve estimates based on these methods, we propose a
fusion algorithm that combines the information obtained from both PFGE and MLVA assays to assess
epidemiological relationships. This involves generating distance matrices for PFGE data (Dice coefficients)
and MLVA data (single-step stepwise-mutation model) and modifying the relative distances using the two
different data types. We applied the algorithm to a set of
Salmonella enterica
serovar Typhimurium isolates
collected from a wide range of sampling dates, locations, and host species. All three classification methods
(PFGE only, MLVA only, and fusion) produced a similar pattern of clustering relative to groupings of common
phage types, with the fusion results being slightly better. We then examined a group of serovar Newport isolates
collected over a limited geographic and temporal scale and showed that the fusion of PFGE and MLVA data
produced the best discrimination of isolates relative to a collection site (farm). Our analysis shows that the
fusion of PFGE and MLVA data provides an improved ability to discriminate epidemiologically related isolates
but provides only minor improvement in the discrimination of less related isolates.
Salmonellosis is one of the most common food-borne
dis-eases in the United States (5). Consequently, it is important to
understand how
Salmonella
strains disseminate within and
be-tween reservoirs and environments. Many molecular typing
tools have been used for this purpose (11). Of these methods,
pulsed-field gel electrophoresis (PFGE) is considered by many
to be the gold standard for strain typing, and variable-number
tandem-repeat (VNTR) assays are powerful alternative or
complementary typing tools (3, 22). Both methods offer a high
degree of genetic resolution for strain typing, depending on
several factors.
PFGE involves separating chromosomal DNA
macro-re-striction fragments by size, and strains are discriminated based
on the resulting band pattern observed after electrophoresis
has been completed. It is one of the most reproducible and
highly discriminatory typing techniques and has been widely
and successfully used for a variety of
Salmonella enterica
sero-vars (12, 15); for many situations, PFGE is capable of
discrim-inating between closely related strains. In addition, the use of
the assay to analyze different serovars does not require a great
deal of modification, as might be required with procedures that
are dependent on PCR. Difficulties arise when strains are very
closely related (i.e., poor discrimination [18, 27]) or when
bands comigrate in the gel or identically sized bands represent
completely different fragments of chromosomal DNA and
thereby produce spurious matches (6). These complications
are more pronounced when a large number of bands are
gen-erated by the restriction digest (4). In addition, while band
patterns convey a crude degree of genetic relatedness, a large
number of independent restriction digests would be needed to
infer an accurate phylogenetic relationship (6).
Multiple-locus
variable-number
tandem-repeat
analysis
(MLVA) is a PCR-based technique that relies on the
amplifi-cation of chromosomal or plasmid DNA that encompasses
short tandem repeats of a DNA sequence. The tandem repeats
are prone to higher-than-background mutation rates due to
DNA strand slippage during replication (23), and thus, the
amplified fragments will vary in length depending on the
num-ber of repeats harbored at a given locus. Different fragment
lengths are tallied either as the total length (base pairs) or the
estimated number of repeat units, and each discretely sized
fragment is considered a unique “allele” for the locus under
investigation. Because of the relatively high mutation rate,
strains can accumulate distinctive allele patterns within a
rel-atively short period of time (5). Furthermore, the technique
can be multiplexed and automated and is conducive to rapid
and relatively high-throughput strain typing. MLVA assays are
relatively robust (5, 15–17) and, while not perfect, they can
provide phylogenetic information even with a limited number
* Corresponding author. Mailing address: School of EECS,
Wash-ington State University, P.O. Box 642752, Pullman, WA 99164-2752.
Phone: (509) 335-5693. Fax: (509) 335-3818. E-mail: [email protected]
.edu.
† Supplemental material for this article may be found at http://jcm
.asm.org/.
䌤
Published ahead of print on 25 August 2010.
4072
on May 16, 2020 by guest
http://jcm.asm.org/
of loci (13, 18). While access to a sequenced genome
dramat-ically speeds the ability to establish new assays (3), it is not a
requisite to assay development. The primary limitations of the
technique include the potential need for a new set of loci for
every species or serovar under investigation and the fact that
some loci are very “unstable” and can “disappear” from some
strains or lineages; this produces the equivalent of an
uninfor-mative “null” allele. Mutation rates can also vary between loci
(5, 24, 25); if ignored, this factor can introduce bias into
com-parative analyses.
Clearly, PFGE and MLVA offer different technical and
in-terpretive advantages and disadvantages, but it is important to
emphasize that the nature of the methodological and
interpre-tive errors is independent between the techniques. For
exam-ple, errors due to comigration of bands for PFGE are
inde-pendent of band size estimation errors for MLVA because
differences in MLVA band size are not detectable using PFGE
and macro-restriction fragments are generally independent of
tandem-repeat sequences. Provided that most of the
experi-mental variation from these two methods is uncorrelated (i.e.,
independent), it is possible to combine results from the two
methods to produce improved estimates (8), and this premise
underlies the current study.
Our objective was to determine whether combining the
in-formation obtained from both PFGE and MLVA assays
pro-duces more rigorous and discriminatory analyses of bacterial
pathogens, such as
Salmonella
. Two sets of
Salmonella enterica
isolates were used in this study; one set included serovar
Ty-phimurium isolates from a wide range of sampling dates,
lo-cations, and host species while the other set included a group
of serovar Newport isolates collected over a limited geographic
and temporal scale for a single host species. The results of the
different typing methods were assessed by comparison with
those of phage-typing assays (serovar Typhimurium) and with
known epidemiological relationships (serovar Newport). To
interpret the MLVA data, we employed a metric that
incor-porates a stepwise-mutation model, and to interpret the PFGE
data, we employed Dice coefficients to construct distance
ma-trices. Our analysis shows that the fusion of the two typing
methods provides an improved ability to discriminate between
isolates when PFGE and MLVA separately provide partial but
incomplete discrimination between strains with a high degree
of probable genetic similarity.
MATERIALS AND METHODS
Salmonellastrains.Two sets of isolates were used for this study. Set A included 37S. entericaserovar Typhimurium strains that were previously collected from different animal hosts and from different locations and time periods (see the figures for strain designations and descriptors). Because these isolates were epidemiologically unrelated, we assumed that they encompassed a high degree of
genetic variability. Set B included 63S. entericaserovar Newport isolates, mostly
collected from cattle in Washington State, and this set was assumed to represent less genetic diversity because of the restricted geographic representation, inclu-sion of multiple isolates from individual farms, and a limited temporal scale.
Salmonellaserovar Typhimurium strains were phage typed at the National Mi-crobiology Laboratory, Canadian Science Center for Human and Animal Health, Winnipeg, Manitoba. Serovar Newport isolates were tested for antibiotic resis-tance using a disc diffusion method (2) according to Clinical and Laboratory Standards Institute (NCCLS) guidelines (19, 20). Northwestern isolates from cattle were tested for susceptibility to a panel of antimicrobial drugs that
in-cluded ampicillin (10g), chloramphenicol (30g), gentamicin (10g),
kana-mycin (30g), streptomycin (10g), tetracycline (30g), triple-sulfa (a
combi-nation of sulfadiazine, sulfamethazine, and sulfamerazine) (250 g),
trimethoprim-sulfamethoxazole (1.25 g to 23.75g), ceftazidime (30 g),
amoxicillin-clavulanic acid (20/10g), and nalidixic acid (30g) (BD
Diagnos-tics, Sparks, Maryland). Northeastern isolates were tested with the same panel
except that a sulfisoxazole disc (250g) was substituted for the triple-sulfa disc.
Pulsed-field gel electrophoresis.We followed a standard PFGE protocol for
Salmonella enterica, using an XbaI restriction digest (21). Briefly, genomic DNA was digested in agarose plugs with the restriction enzyme XbaI, and the resulting DNA fragments were gel separated using a CHEF-DR II (Bio-Rad, Hercules, CA) apparatus. The electrophoresis conditions included an initial pulse time of 2.2 s, final pulse time of 63.8 s, running temperature of 14°C, and run time of 18 to 20 h at 6 V/cm. PFGE gels were stained with ethidium bromide and visualized using a UV transilluminator. Gel images were analyzed using Bionumerics ver-sion 4.6 (Applied Maths, Sint-Martens-Latem, Belgium). Estimated band sizes were exported from Bionumerics for the current study.
Multiple-locus variable-number tandem-repeat analysis.ForS. enterica
sero-var Typhimurium isolates, four of five previously described VNTR loci were employed for MLVA (STTR5, STTR6, STTR9, and STTR10pl), following a published protocol (18) with the addition of a VNTR locus identified in-house (STTR11) (Forward, GATAAGCCGTACTGTTCAGG, and
STTR11-Reverse, TACTCCTTTGTGGTCTACGC). For theS. entericaserovar Newport
strains, two Typhimurium loci (STTR5 and STTR6) (18) and four published Newport-specific loci were employed (NewportA, NewportB, NewportM, and NewportL) (6). The PCRs for both serovars were conducted as previously de-scribed (6, 20). Capillary electrophoresis was carried out at the Washington State University Genomics Core using a 3730 DNA analyzer with Pop-7 polymer (Applied Biosystems). The resulting electropherograms were analyzed using GeneMarker software (Softgenetics LLC, State College, PA).
Data analysis.Dice similarity coefficients were calculated using Bionumerics
(Applied Maths, Austin, TX) from PFGE data to generate the distance matrix, and the unweighted-pair group method with arithmetic mean (UPGMA) algo-rithm was used to construct a dendrogram. For the MLVA data, the total length of the tandem repeats was divided by the estimated size of each repeat to obtain the number of tandem repeats for each locus and each strain. There were five
available loci with tandem repeats forS. entericaserovar Typhimurium, but data
from one locus were not used because it was from a plasmid locus and⬍73% of
37 bacterial isolates were positive for this locus. ForS. entericaserovar Newport,
there were six loci, all of which were used. Because passage experiments indicate that VNTR mutations are usually composed of a single step (5, 24), we modeled our data using a single-step stepwise-mutation model (SMM). Based on this
statistical model, we estimated the distanceS(the total number of single steps)
between two lineages (two different isolates) and their most recent common
ancestor (MRCA) using the number of tandem repeats,XL, of the two lineages.
The distances,S, for all lineage pairs were then used to construct the distance
matrix, and UPGMA was used to obtain a dendrogram.
Ifis the rate of stepwise mutations per generation and if we assume that the
gain or loss of a repeat is equally probable, then the following conditional
probabilities,P, characterize the single-step SMM:P(Xt⫹1⫽i⫹1兩Xt⫽i)⫽
P(Xt⫹1⫽i⫺1兩Xt⫽i)⫽ /2,P(Xt⫹1⫽i兩Xt⫽i)⫽1⫺ , andP(储Xt⫹1⫺Xt储ⱖ
2兩Xt⫽i)⫽0, whereidenotes the number of tandem repeats at distancetand
tis an integer number between zero and infinity. Based on these conditional
probabilities, the probability of the distancetis given by (26)P(t兩n0, …, nk)⫽
N(t)/D(t), whereN(t)⫽e⫺( ⫹2n)t⌸
j k
⫽0[Ij(2t)]j n
andD(t)⫽ 兰0⬁e⫺
( ⫹2n)t
⌸jk⫽0[Ij(2t)]jndt. The equation forPassumes that the mutation rateis
constant for all loci, which is approximately true for ourS. entericaserovar
Typhimurium data;nmdenotes the locus number where the subscriptm⫽0, 1,
2,…,kis the difference between the number of tandem repeats for two lineages,
andm⫽kis the maximum number of differences;nis the number of loci used;
is a parameter associated with the distance to a MRCA (in this work, ⫽
0.0002 was found to give satisfactory results [26]); andIjis thejth-order modified
Bessel function of type 1. The distanceSis the value oftwith the maximum
probability.
Fusion algorithm.Dendrograms constructed from PFGE or MVLA data can
differ substantially. Consequently, if we assume that both types of data contain useful information as well as error, it is possible that better results can be obtained by combining the data. In fact, it is known that (i) if two different algorithms used to describe a set of samples give different results, (ii) if the error for each result is less than the error associated with randomly generated results, and (iii) if the errors for both are uncorrelated, then a combination of these algorithms will give better results than either of the two algorithms alone (8). For our problem, we have different data (PFGE and MLVA) from the same sets of samples. We can safely assume that the error for both the MLVA and PFGE algorithms is less than the error for random clustering, because both PFGE and
on May 16, 2020 by guest
http://jcm.asm.org/
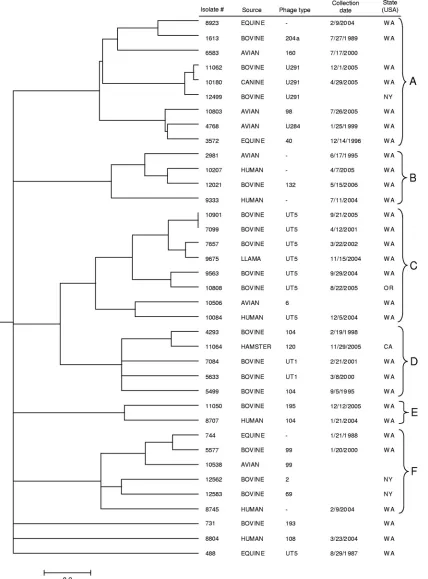
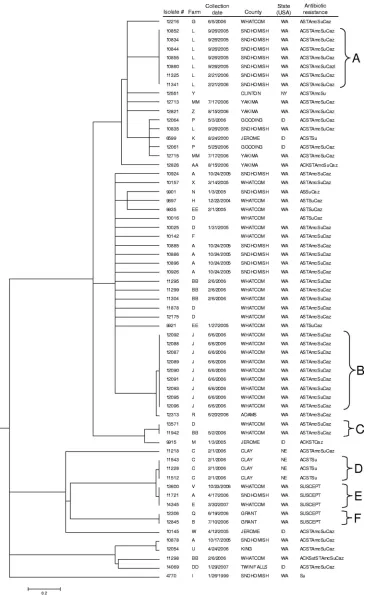
FIG. 1. Generalized tree for 37
S. enterica
serovar Typhimurium isolates generated from the fusion algorithm. Parameters used in this analysis
included
r
between 0 and 1 and the threshold parameter
thr
between 0.05 and 1. Information includes isolate designation, source, phage type,
collection date (month/day/year), and state where the isolate was collected. The scale bar represents a composite measure of genetic distance
determined using the averaged values of the normalized distance matrices (see Materials and Methods).
4074
BROSCHAT ET AL.
J. C
LIN. M
ICROBIOL.
on May 16, 2020 by guest
http://jcm.asm.org/
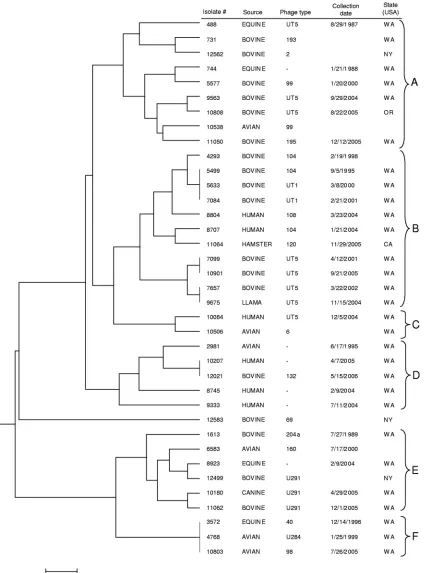
FIG. 2. Dendrogram for 37
S. enterica
serovar Typhimurium isolates constructed using UPGMA and a distance matrix obtained using a
single-step stepwise mutation model for VNTR data (MLVA only). The scale bar represents a measure of genetic distance.
on May 16, 2020 by guest
http://jcm.asm.org/
MLVA can recapitulate epidemiological relationships (6, 14). Furthermore, we can assume that the errors are uncorrelated because the PFGE and MLVA assays measure differences that arise from different genetic mechanisms. Con-sequently, because the two methods provide different results, it is probable that
combining the PFGE and MLVA data will provide a more comprehensive picture of the underlying population structure of these strains.
Several strategies can be used to combine different types of data. One strategy is to treat each data type independently and produce two independent
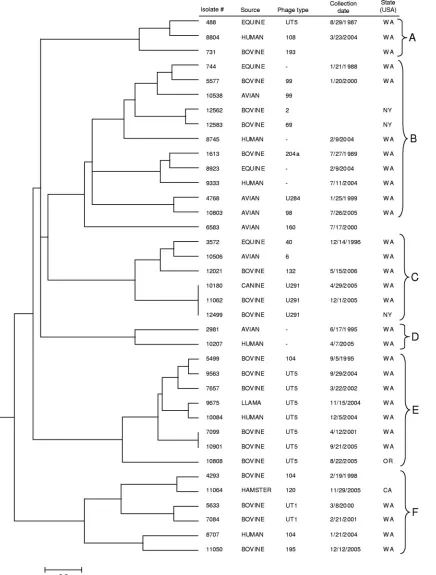
dendro-FIG. 3. Dendrogram for 37
S. enterica
serovar Typhimurium isolates constructed using UPGMA with Dice coefficients for PFGE data (PFGE
only). The scale bar represents a measure of genetic distance.
4076
BROSCHAT ET AL.
J. C
LIN. M
ICROBIOL.
on May 16, 2020 by guest
http://jcm.asm.org/
[image:5.585.83.519.71.646.2]grams that are then combined to form a single dendrogram. While conceptually simple, this approach weights all sources of information equally, which may not be an optimal approach. Another strategy is to combine the data sets together before generating a dendrogram, but it may be difficult to combine the data if they differ in type (e.g., discrete and continuous), and even if this is accom-plished, a suitable approach for evaluating the combined data may not exist. An alternative approach is to process each type of data using an algorithm that is appropriate for that data type and then fuse the results at some midpoint in the process; this is the approach we employed.
We begin with two distance matrices, one for the PFGE data set and one for the MLVA data set, as described above. One distance matrix is used to construct a dendrogram, and a threshold is selected (see below) to define distinct clusters from this dendrogram. If two strains in the second distance matrix are grouped together in one of the clusters formed from the first distance matrix, the distance between them is reduced (see below); if these two strains are not grouped together, then the distance in the second matrix is left unchanged. After all pairwise distance values are adjusted based on the clusters from the first matrix, a final dendrogram is generated. Both sets of data can be used in alternating roles: PFGE data are used to create the clusters while MLVA data are used to create a second distance matrix to be modified, and MLVA data are used to create the clusters while PFGE data are used to create a second distance matrix to be modified.
For the fusion algorithm described above, values for two parameters must be
chosen. The first is the threshold value,thr, which divides the initial dendrogram
into distinct clusters. The second is the degree that each distance value should be
reduced in the modified distance matrix. If Dis the distance matrix to be
modified with elementsd(i,j) andD*is the modified distance matrix, the
ele-ments ofD*are given in terms ofd(i,j) by the equationd*(i,j)⫽d(i,j) if bacterial
samplesiandjare not in the same cluster and by the equationd*(i,j)⫽r䡠d(i,j)
if bacterial samplesiandjare in the same cluster, with 0⬍rⱕ1. Thus, the
weight parameterrdictates how much the distance value will be reduced. The
choice of these two parameters,thrandr, changes the results, and there is no
obvious way of knowing what values are the best to use. Our approach was to use
the entire range of values for the thresholdthr, i.e., 0.05 to 1, and several ranges
of values for the weight parameterr. For the former, this corresponds to a range
from having each strain form its own cluster (thr⫽0.05) to the opposite extreme
where all strains are grouped into a single cluster (thr⫽1). For each set of
ranges, we created a dendrogram using UPGMA with the modified distance matrix; from the resulting set of dendrograms, we constructed a “generalized tree” using Consense from the software package PHYLIP (version 3.68) with the default parameters (10).
The set of dendrograms used to construct the generalized tree is a combination of two sets of data, one created when PFGE clusters are used to modify the distance matrix and the other when MLVA clusters are used. When the sets are combined, a conflict will occur if they disagree completely on the relationship between two strains. For example, the PFGE data may indicate that strains A and B always occur as a pair, while the MLVA data may indicate that strains A and C always occur as a pair. If this happens, Consense (10) will construct a tree that depends on the order of the input. To prevent such an occurrence, we “break the tie” by multiplying the values of one set of data by 0.501 and the other set by 0.499.
One other issue arises when the two different data sets are combined; their distance measures are not the same. The manner in which we resolved this was to scale the dendrogram produced by Consense using an average-distance matrix obtained by averaging the values of the normalized PFGE and MLVA distance matrices. Normalization was achieved by dividing all matrix values by the max-imum distance to obtain values between 0 and 1. Then, the final distances were determined as follows. Find all leaves on a branch (e.g., branch 1 contains A and B; branch 2 contains C, D, and E; and F contains itself). Find all combinations of leaves on one branch and leaves on the other branch and obtain the distance for each combination from the average distance matrix. Use the maximum value as the distance between the two branches.
The fusion program can be downloaded at http://www.vetmed.wsu.edu /research_vmp/MicroArrayLab/.
RESULTS AND DISCUSSION
Comparison of genetically diverse strains of
S. enterica
sero-var Typhimurium.
To compare genetically diverse strains of
S.
enterica
serovar Typhimurium, generalized trees were
con-structed using the fusion, MLVA, and PFGE algorithms
de-scribed above. For the fusion algorithm, we present results
from weight parameter
r
between 0 and 1. Potential ties were
broken by multiplying PFGE cluster data by a factor of 0.499
and MLVA cluster data by a factor of 0.501. This weights the
analysis in favor of MLVA under the assumption that there is
more phylogenetically relevant information available from
MLVA data than from PFGE (7).
Assessing the validity of our analysis is complicated by the
lack of a gold standard with which to compare our results.
Indeed, barring a complete genome sequence for each strain
and suitable algorithms for assessing genetic relationships, the
only potential gold standards available are multilocus sequence
typing (MLST) and phenotypic characteristics. Given the
prob-able lack of genetic variation for intraserovar MLST
compar-isons (9), we chose to compare the
S. enterica
serovar
Typhi-murium strains using susceptibility to a panel of lytic phages as
a measure of relatedness. The Centre for Infections of the
Health Protection Agency (Colindale, London, United
King-dom) provided 38 phages (1), and 5 additional phages were
developed at the National Microbiology Laboratory
(Win-nepeg, Canada). Our analysis assumes that strains with similar
phage susceptibilities are more closely related than strains with
dissimilar phage susceptibilities. All of the strains were
sub-jected to susceptibility testing using a panel of 31 phages.
Strains that were judged untypeable with this panel were
sub-jected to testing with an additional 12 phages. Only one strain
(8745) was considered untypeable using the combined panel of
43 lytic phages (see Tables S1a and b in the supplemental
material).
Each dendrogram was divided into six clusters, A to F, and
the strains within a cluster were compared according to their
phage susceptibilities with the expectation that, on average,
strains with greater genetic similarity will have fewer phage
susceptibility mismatches. Because lytic phage susceptibility is
unlikely to have a 1:1 correspondence with genetic similarity,
we arbitrarily selected a cutoff where isolates were considered
“more similar” if they had
ⱕ
7 differences in the lytic phage
panel or “less similar” if they had
⬎
7 differences in lytic phage
susceptibility. For this putatively diverse set of isolates, the
correspondence between lytic phage results, fusion (Fig. 1),
MLVA (Fig. 2), and PFGE (Fig. 3) was small but measurable
(Table 1). The fusion results included one or three fewer phage
susceptibility mismatches relative to the MLVA and PFGE
results, respectively. We also examined the ability of the three
approaches to distinctly classify unique phage types within the
same clusters (Fig. 1 to 3). With a discrimination index
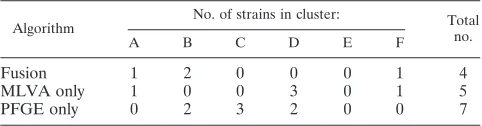
calcu-TABLE 1. Number of unrelated strains in each of the clusters
delineated in the dendrograms of Fig. 1 to 3
aAlgorithm No. of strains in cluster: Total
no.
A B C D E F
Fusion
1
2
0
0
0
1
4
MLVA only
1
0
0
3
0
1
5
PFGE only
0
2
3
2
0
0
7
a
A phage susceptibility panel (see Tables S1a and b in the supplemental material) was used as a proxy for genetic similarity in which we arbitrarily
classified isolates as genetically similar if differing byⱕ7 lytic phage
susceptibil-ities and genetically distinct if differing by⬎7 lytic phage susceptibilities. Note
that the number of strains in each cluster is not the same for each algorithm.
on May 16, 2020 by guest
http://jcm.asm.org/
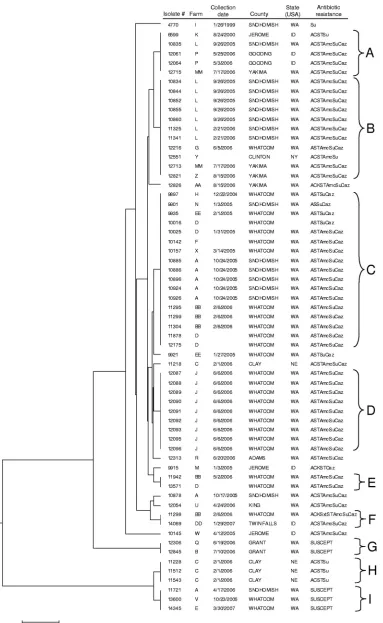
[image:6.585.301.542.90.153.2]FIG. 4. Generalized tree for 63
S. enterica
serovar Newport isolates generated from 160 dendrograms. The dendrograms were obtained using
the fusion algorithm with the weight parameter,
r
, between 0 and 1 and the threshold parameter,
thr
, between 0.05 and 1. Information includes
isolate designation, collection date, county where the isolate was collected (Washington counties include Adams, Grant, King, Snohomish,
Whatcom, and Yakima; Idaho counties include Gooding, Jerome, and Twin Falls; Clay, Clinton, and Utah Counties are in Nebraska, New York,
and Utah, respectively), and antibiotic resistance phenotype (see Materials and Methods). Resistance profile abbreviations: A, ampicillin; C,
chloramphenicol; K, kanamycin; Sxt, trimethoprim-sulfamethoxazole; S, streptomycin; T, tetracycline; Amc, amoxicillin-clavulanic acid; Su,
triple-sulfa; Caz, ceftazidime; SUSCEPT, susceptible to all antimicrobials tested.
4078
on May 16, 2020 by guest
http://jcm.asm.org/
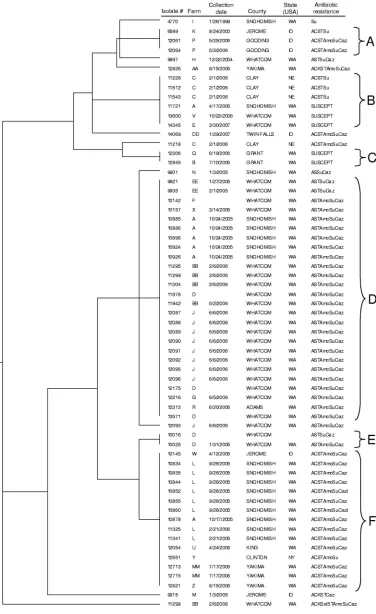
FIG. 5. Dendrogram for 63
S. enterica
serovar Newport isolates constructed using UPGMA and a distance matrix obtained using a single-step
stepwise mutation model for VNTR data (MLVA only). The scale bar represents a measure of genetic distance.
on May 16, 2020 by guest
http://jcm.asm.org/
FIG. 6. Dendrogram for 63
S. enterica
serovar Newport isolates constructed using UPGMA with Dice coefficients for PFGE data (PFGE only).
The scale bar represents a measure of genetic distance.
4080
BROSCHAT ET AL.
J. C
LIN. M
ICROBIOL.
on May 16, 2020 by guest
http://jcm.asm.org/
lated as one minus the average proportion of unique phage
types per cluster, the fusion algorithm had an improved but not
statistically significantly different discrimination index (0.34
⫾
0.13 [average
⫾
standard error of the mean]) compared with
those of PFGE (0.25
⫾
0.12) and MLVA (0.20
⫾
0.10). Thus,
for this relatively diverse set of isolates, we did not find a
compelling benefit to merging PFGE and MLVA data using
the fusion algorithm, although the fusion algorithm does
give better statistical performance than random allocation
of phage types to clusters (0.10, standard deviation
⫽
0.03,
n
⫽
1,000).
Comparison of genetically similar
S. enterica
serovar
New-port strains.
To compare genetically similar
S. enterica
serovar
Newport strains, generalized dendrograms were constructed
using the fusion algorithm, PFGE-only data, and MLVA-only
data with the same parameters discussed in the previous
sec-tion (Fig. 4, 5, and 6). As with the serovar Typhimurium
anal-ysis, we lacked a gold standard for assessing the performance
of our results relative to the true genetic relationships, but we
did have epidemiologically relevant information as inferred
from the location (farm) where the isolates were collected. We
assumed that isolates collected from the same farm were more
likely to be genetically similar relative to isolates collected at
different farms. Consequently, we examined all cases in the
dendrogram where serovar Newport isolates were
indistin-guishable and calculated a discrimination index as one minus
the average proportion of distinct farms within these
“mono-phyletic” groups. The number of monophyletic groups ranged
from 6 (fusion and PFGE) (Fig. 4 and 6) to 9 (MLVA) (Fig. 5),
with a significantly better discrimination index for the fusion
algorithm (0.76
⫾
0.05) than for MLVA (0.31
⫾
0.12) and
PFGE (0.39
⫾
0.09) (
P
⫽
0.004; analysis of variance). Based on
this assessment procedure, it is clear that combining the data
from PFGE and MLVA analyses provided a greater degree of
isolate discrimination as a function of the farm where the
isolates were collected. While the antimicrobial resistance
pro-files cannot be used quantitatively to validate the fusion results,
the clustering of the susceptible strains by the fusion algorithm
(Fig. 4) relative to the clustering by the MLVA (Fig. 5) and
PFGE (Fig. 6) algorithms provides further evidence that the
fusion algorithm provides more biologically consistent
classifi-cations.
Clearly, combining data from PFGE and MLVA can serve
to buffer the extremes in the level of genetic variation
mea-sured by these two methods alone, but the degree of benefit
may be a function of the genetic similarity among the
iso-lates under consideration. In cases in which isoiso-lates
repre-sent a relatively diverse and epidemiologically unrelated
group of bacteria, combining PFGE and MLVA data may
provide a minor benefit. In contrast, for closely related
isolates, as judged by their collection from identical farm
locations in this study, the combination of PFGE and
MLVA data are likely to provide a higher degree of
dis-crimination at the farm level. The advantage of increased
discrimination for closely related isolates should extend to
other cases of epidemiologically related strains, including
situations where there is a need to trace food-borne disease
outbreaks and infections in clinical settings.
ACKNOWLEDGMENTS
K. N. K. Baker provided invaluable technical assistance. Martin
Wiedmann, Cornell University, kindly provided northeastern
S
.
Typhi-murium isolates.
This project has been funded in part with federal funds from the
National Institute of Allergy and Infectious Diseases, National
Insti-tutes of Health, Department of Health and Human Services, under
contract no. NO1-AI-30055, and by the Agricultural Animal Health
Program, College of Veterinary Medicine, Washington State
Univer-sity, Pullman, WA. Scholarship support for D.M. was provided by the
Carl M. Hansen Foundation.
REFERENCES
1.Anderson, E. S., L. R. Ward, M. J. Saxe, and J. D. de Sa.1977.
Bacterio-phage-typing designations ofSalmonella typhimurium. J. Hyg. (Lond).78:
297–300.
2.Bauer, A. W., W. M. Kirby, J. C. Sherris, and M. Turck.1966. Antibiotic
susceptibility testing by a standardized single disk method. Am. J. Clin.
Pathol.45:493–496.
3.Benson, G.1999. Tandem repeats finder: a program to analyze DNA
se-quences. Nucleic Acids Res.27:573–580.
4.Call, D. R., J. G. Hallett, S. G. Mech, and M. Evans.1998. Considerations for measuring genetic variation and population structure with multilocus
finger-printing. Mol. Ecol.7:1337–1346.
5.Call, D. R., L. Orfe, M. A. Davis, S. Lafrentz, and M. S. Kang.2008. Impact of compounding error on strategies for subtyping pathogenic bacteria.
Food-borne Pathog. Dis.5:505–516.
6.Davis, M. A., K. N. K. Baker, D. R. Call, L. D. Warnick, Y. Soyer, M.
Wiedmann, Y. Gro¨hn, P. L. McDonough, D. D. Hancock, and T. E. Besser.
2009. Multilocus variable-number tandem-repeat method for typing
Salmo-nella entericaserovar Newport. J. Clin. Microbiol.47:1934–1938.
7.Davis, M. A., D. D. Hancock, T. E. Besser, and D. R. Call.2003. Evaluation
of pulsed-field gel electrophoresis as a tool for determining the degree of
genetic relatedness between strains of Escherichia coliO157:H7. J. Clin.
Microbiol.41:1843–1849.
8.Dietterich, T. G.2000. Ensemble methods in machine learning, p. 1–15.
InJ. Kittler and F. Roli (ed.), Proceedings of the First International
Workshop on Multiple Classifier Systems. Springer Verlag, London, United Kingdom.
9.Fakhr, M. K., L. K. Nolan, and C. M. Logue.2005. Multilocus sequence
typing lacks the discriminatory ability of pulsed-field gel electrophoresis for
typingSalmonella entericaserovar Typhimurium. J. Clin. Microbiol.43:2215–
2219.
10.Felsenstein, J.1989. PHYLIP: Phylogeny Inference Package (version 3.2).
Cladistics5:164–166.
11.Foley, S. L., S. Zhao, and R. D. Walker.2007. Comparison of molecular
typing methods for the differentiation ofSalmonellafoodborne pathogens.
Foodborne Pathog. Dis.4:253–276.
12.Gerner-Smidt, P., K. Hise, J. Kincaid, S. Hunter, S. Rolando, E.
Hyytia-Trees, E. M. Ribot, and B. Swaminathan.2006. PulseNet USA: a five-year
update. Foodborne Pathog. Dis.3:9–19.
13.Gulati, P., R. K. Varshney, and J. S. Virdi.2009. Multilocus variable
number tandem repeat analysis as a tool to discern genetic relationships
among strains of Yersinia enterocoliticabiovar 1A. J. Appl. Microbiol.
107:875–884.
14.Harbottle, H., D. G. White, P. F. McDermott, R. D. Walker, and S. Zhao.
2006. Comparison of multilocus sequence typing, pulsed-field gel elec-trophoresis, and antimicrobial susceptibility typing for characterization of
Salmonella enterica serotype Newport isolates. J. Clin. Microbiol.44:
2449–2457.
15.Hopkins, K. L., C. Maguire, E. Best, E. Liebana, and E. J. Threlfall.2007.
Stability of multiple-locus variable-number tandem repeats inSalmonella
entericaserovar Typhimurium. J. Clin. Microbiol.45:3058–3061.
16.Lindstedt, B. A., E. Heir, E. Gjernes, and G. Kapperud.2003. DNA
finger-printing ofSalmonella entericasubsp.entericaserovar Typhimurium with
emphasis on phage type DT104 based on variable number of tandem repeat
loci. J. Clin. Microbiol.41:1469–1479.
17.Lindstedt, B. A., M. Torpdahl, E. M. Nielsen, T. Vardund, L. Aas, and G.
Kapperud.2007 Harmonization of the multiple-locus variable-number
tan-dem repeat analysis method between Denmark and Norway for typing
Sal-monellaTyphimurium isolates and closer examination of the VNTR loci.
J. Appl. Microbiol102:728–735.
18.Lindstedt, B. A., T. Vardund, L. Aas, and G. Kapperud.2004. Multiple-locus
variable-number tandem-repeats analysis ofSalmonella entericasubsp.
en-tericaserovar Typhimurium using PCR multiplexing and multicolor capillary
electrophoresis. J. Microbiol. Methods59:163–172.
19.NCCLS.2003. Methods for dilution antimicrobial susceptibility tests for
bacteria that grow aerobically; approved standard M7-A6. National Com-mittee for Clinical Laboratory Standards, Wayne, PA.
20.NCCLS.2003. Performance standards for antimicrobial susceptibility testing,
on May 16, 2020 by guest
http://jcm.asm.org/
14th informational supplement, 13th ed. Approved standard M100-S13. Na-tional Committee for Clinical Laboratory Standards, Wayne, PA.
21.Ribot, E. M., M. A. Fair, R. Gautom, D. N. Cameron, S. B. Hunter, B.
Swaminathan, and T. J. Barrett.2006. Standardization of pulsed-field gel
electrophoresis protocols for the subtyping of Escherichia coliO157:H7,
Salmonella, andShigellafor PulseNet. Foodborne Pathog. Dis.3:59–67.
22.Torpdahl, M., G. Sorensen, B. A. Lindstedt, and E. M. Nielsen.2007.
Tan-dem repeat analysis for surveillance of human Salmonella Typhimurium
infections. Emerg. Infect. Dis.13:388–395.
23.van Belkum, A., S. Scherer, L. van Alphen, and H. Verbrugh.1998.
Short-sequence DNA repeats in prokaryotic genomes. Microbiol. Mol. Biol. Rev.
62:275–293.
24.Vogler, A. J., C. Keys, Y. Nemoto, R. E. Colman, Z. Jay, and P. Keim.2006.
Effect of repeat copy number on variable-number tandem repeat mutations inEscherichia coliO157:H7. J. Bacteriol.188:4253–4263.
25.Vogler, A. J., C. E. Keys, C. Allender, I. Bailey, J. Girard, T. Pearson, K. L.
Smith, D. M. Wagner, and P. Keim.2007. Mutations, mutation rates, and
evolution at the hypervariable VNTR loci ofYersinia pestis. Mutant. Res.
616:145–158.
26.Walsh, B.2001. Estimating the time to the most recent common ancestor for
the Y chromosome or mitochondrial DNA for a pair of individuals. Genetics
158:897–912.
27.Zheng, J., C. E. Keys, S. Zhao, J. Meng, and E. W. Brown.2007. Enhanced
subtyping scheme forSalmonella enteritidis. Emerg. Infect. Dis.13:1932–1935.