Copyright © 2001, American Society for Microbiology. All Rights Reserved.
Fluconazole and Voriconazole Multidisk Testing of
Candida
Species for Disk Test Calibration and MIC Estimation
GO
¨ RAN KRONVALL*
ANDINGA KARLSSON
Department of Microbiology and Tumor Biology—MTC, Clinical Microbiology,
Karolinska Institute, Karolinska Hospital, Stockholm SE-17176, Sweden
Received 11 September 2000/Returned for modification 29 December 2000/Accepted 26 January 2001
Fluconazole and voriconazole MICs were determined for 114 clinical
Candida
isolates, including isolates of
Candida albicans, Candida glabrata, Candida krusei, Candida lusitaniae, Candida parapsilosis
, and
Candida
tropi-calis
. All strains were susceptible to voriconazole, and most strains were also susceptible to fluconazole, with
the exception of
C. glabrata
and
C. krusei
, the latter being fully fluconazole resistant. Single-strain regression
analysis (SRA) was applied to 54 strains, including American Type Culture Collection reference strains. The
regression lines obtained were markedly different for the different
Candida
species. Using an MIC limit of
sus-ceptibility to fluconazole of
<
8
g/ml, according to NCCLS standards, the zone breakpoint for susceptibility
for the 25-
g fluconazole disk was calculated to be
>
18 mm for
C. albicans
and
>
22 mm for
C. glabrata
and
C. krusei
. SRA results for voriconazole were used to estimate an optimal disk content according to rational
criteria. A 5-
g disk content of voriconazole gave measurable zones for a tentative resistance limit of 4
g/ml,
whereas a 2.5-
g disk gave zones at the same MIC level for only three of the species. A novel SRA modification,
multidisk testing, was also applied to the two major species,
C. albicans
and
C. glabrata
, and the MIC estimates
were compared with the true MICs for the isolates. There was a significant correlation between the two
mea-surements. Our results show that disk diffusion methods might be useful for azole testing of
Candida
isolates.
The method can be calibrated using SRA. Multidisk testing gives direct estimations of the MICs for the isolates.
Infections with
Candida
species are common complications
in immunocompromised patients and require adequate
treat-ment, often with newer azole drugs. Particularly in AIDS
pa-tients with oropharyngeal and/or esophageal candidiasis there
have been reports of increased azole resistance among
Can-dida
isolates (6, 14, 24, 29, 32–34, 44). This emergence of
resistance to drugs has led to a growing demand for
suscepti-bility testing of clinical yeast isolates (14, 32, 41, 43).
Compar-isons between the standardized NCCLS broth macrodilution
method (27) and microdilution methods (12, 22, 33, 38),
E-tests (7, 8, 12, 25, 33, 38), and disk diffusion methods (2, 3, 26,
35, 36, 41) suggest a possibility of using the less expensive disk
method in clinical microbiology laboratories. We have
ex-tended the analysis of azole disk diffusion tests by using
single-strain regression analysis (SRA) for studying azole regression
lines among
Candida
species and for calibration of the disk
test. Such a calibration method is required since no
interpre-tive zone breakpoints are yet available. The SRA-derived
mul-tidisk test (M-test) was also used for MIC estimations of
sus-ceptibility to fluconazole and voriconazole, the two azole drugs
included. Voriconazole is a new azole with more avid binding
to the sterol 14
␣
-demethylase, thereby more effectively
inhib-iting ergosterol synthesis (22, 34).
MATERIALS AND METHODS
Candidaisolates, species identification and culture conditions.The clinical isolates ofCandidaspecies were obtained from blood cultures at the Karolinska Hospital, Stockholm, Sweden, during the years 1994 to 1998. A total of 118
consecutive strains were included and comprised 86Candida albicansstrains, 19
Candida glabratastrains, 3Candida kruseistrains, 2Candida lusitaniaestrains,
5Candida parapsilosisstrains, and 3Candida tropicalisstrains. Four strains of
C. albicans were excluded because of poor growth. The following reference
strains were also included in the studies:C. albicansATCC 90028,C. glabrata ATCC 90030,C. kruseiATCC 6258,C. parapsilosisATCC 22019, andC.
tropi-calis ATCC 750. For SRA calculations 24C. albicansstrains, 12C. glabrata
strains, 3C. kruseistrains, 2C. lusitaniaestrains, 5C. parapsilosisstrains, and 3 C. tropicalisstrains were studied, in all 54 strains including the reference strains. Speciation of clinical isolates was performed using colony characteristics on Sabouraud dextrose agar and CHROM agarCandidadifferential plates (ILS AB Laboratories, Sollentuna, Sweden) and conventional biochemical and assimila-tion tests according to established procedures (1, 42).
For E-tests and disk diffusion testsCandidaisolates were grown on Sabouraud dextrose agar, and from each strain five colonies were picked and suspended to a 0.5 McFarland density, which was then diluted 1:5 in saline. This suspension was flooded onto RPMI 1640 (AB Biodisk, Solna, Sweden) agar medium plates including MOPS (morpholinepropanesulfonic acid) and 2% glucose, and the excess suspension was aspirated, and this was followed by drying at 37°C for 15 min. E-test strips or disks were then applied, and the plates were incubated and read as described below. The flooding method was used instead of swabbing for inoculation because of improved readability of results with more clear-cut zone edges. This variant has also been suggested by the producer of the E-test (AB Biodisk, oral communication). For many years the flooding method of inocula-tion was the recommended procedure in Scandinavia for disk testing of clinical bacterial isolates (11).
MIC determinations.E-tests were performed according to the instructions from the manufacturer (AB Biodisk), using substrates and inoculates as de-scribed above and with readings after 24 and 48 h. The E-test strips with flucon-azole and voriconflucon-azole were kindly provided by AB Biodisk. Criteria for defining the edge of growth followed recommendations by AB Biodisk (E-test technical guide, 1994). MIC determinations were performed once for each strain. Studies have shown good correlations between E-test results and reference dilution method MICs (7, 8, 12, 13, 24, 33, 38). A similar correlation between the NCCLS macrodilution method and the E-test was obtained for fluconazole by E. Chrys-santhou (in our laboratory), who tested 29C. albicansisolates and 110 strains of otherCandidaspecies. She found 80% agreement within 1 dilution step and 88% within 2 dilution steps (E. Chryssanthou, personal communication). The E-test was therefore used as the reference method in the present comparisons with M-test MIC estimations.
* Corresponding author. Mailing address: Clinical Microbiology—
MTC, Karolinska Hospital L2:02, Stockholm SE-17176, Sweden. Phone:
46-8-51774910. Fax: 46-8-308099. E-mail address: goran.kronvall@ks
.se.
1422
on May 15, 2020 by guest
http://jcm.asm.org/
Range and median MICs for groups were calculated using the full range of E-test values. For the geometric mean value and the MICs at which 50 and 90% of isolates tested were inhibited (MIC50and MIC90values, respectively) the
E-test results were adjusted to the nearest higher regular 2-log dilution. The 48-h results gave less edge-reading problems forC. albicans, whereas all other species were more easily read after 24 h of incubation. The 48-h results were, however, used throughout the studies in conformity with established procedures (25; AB Biodisk E-test technical guide). When the discrepancy between the 24- and 48-h results was more than fourfold (fluconazole, three strains; voriconazole, four strains) this difference could be attributed to endpoint reading difficulties. In accordance with recent studies by Rex et al. (30) these results were corrected toward the 24-h readings by measuring the outer zone of inhibition in the E-test. MIC limits for interpretation of susceptibility to fluconazole wereⱕ8g/ml (susceptible) andⱖ64g/ml (resistant) according to NCCLS guidelines (12, 26, 27, 31). The intermediate category is called S-DD, which stands for susceptible dependent upon dose, i.e., 400 mg or more of fluconazole per day (27). Studies of the MIC correlation with response to fluconazole gave an MIC limit for susceptibility of⬍25g/ml and for resistance ofⱖ25g/ml (34). Similar studies with voriconazole indicated an MIC limit for voriconazole resistance ofⱖ6.25 g/ml, but proper interpretive guidelines from the NCCLS or other reference authorities are yet to come (34).
SRA and M-test.The SRA equation was developed from early equations describing the formation of the inhibition zone in diffusion tests. In the SRA equation the disk content is retained as a variable, which makes it possible to calculate a regression line for a bacterial species using one single, representative strain and several different disk contents of the antibiotic (15, 19). SRA permits the calibration of disk diffusion tests and the calculation of species-related in-terpretive zone breakpoints (4, 19, 21, 28), as well as the evaluation of an optimal disk potency for susceptibility testing (16, 18, 21). A modification of the SRA equation, the so called M-test, has shown a potential for MIC estimations (17). In the M-test the Q-zero value is first calculated directly from the modified SRA equation (17). This value is proportional to the MIC for the strains. The Q-zero value multiplied by a conversion factor gives the MIC. In the first description of the M-test the conversion factor was around 2, but other figures (unpublished data) have been found for other combinations of antibiotics and microorganisms (17). These methods have now been applied in the present studies to azole susceptibility testing ofCandidaspecies.
Disk diffusion antibiotic susceptibility tests.Disk diffusion testing ofCandida species to determine antibiotic susceptibility has been evaluated by several in-vestigators and shown to have potential (2, 3, 12, 23, 35, 36, 41). We applied SRA for the calculation of interpretive zone diameter equivalents of MIC limits for the susceptibility categories and also for estimation of MICs for strains using the M-test (15, 17–20). For SRA experiments two series of disks were produced, containing 2.5, 5.0, 10, 20, 40, and 80g of fluconazole and 0.64, 1.25, 2.5, 5.0, 10, 20, and 40g of voriconazole, respectively. The production of disks and their control followed established procedures in our laboratory (21). Fluconazole and voriconazole substance was kindy provided by Pfizer (Pfizer Ltd., Sandwich, Kent, England). All clinical isolates were tested by SRA once and the reference strains were tested four times. The fluconazole disk content for routine disk testing has tentatively been set to 25g (2, 3, 26, 36, 37). No disk recommen-dations are available for voriconazole testing.
RESULTS
Determination of MICs of fluconazole and voriconazole for
Candida
isolates.
The MICs of
Candida
isolates were
deter-mined using E-tests, and the results are shown in Table 1. All
Candida
species showed homogeneous populations of
flucon-azole susceptibility, and all strains were within the susceptible
category except for strains belonging to
C. glabrata
and
C.
kru-sei
.
C. glabrata
isolates clustered in the S-DD interpretation
region, with only 5 of 19 strains falling in the susceptible
cat-egory. The MIC
50of fluconazole was 16
g/ml, and the MIC
90for
C. glabrata
was 32
g/ml. The three strains of
C. krusei
were
fully resistant. The MIC for one strain of
C. albicans
was 4
g/
ml, higher than that for the main population of strains of this
species.
For voriconazole the MIC results of the different
Candida
species were of a magnitude 10 to more than 100 times lower
(Table 1). For no clinical isolate was the voriconazole MIC
⬎
2
g/ml. The increase in susceptibility to voriconazole compared
to fluconazole was parallel in the different species, and this
drug was therefore also least effective against
C. glabrata
and
C. krusei
in comparison to the other
Candida
species. No MIC
limits for interpretations are available for this drug, but judging
from a tentative resistance limit obtained from clinical
out-come studies (34), all strains would belong to the susceptible
category. When the fluconazole and voriconazole MICs for all
individual strains were plotted on a logarithmic scale there was
a significant correlation between the MICs for the two drugs
(
R
2⫽
0.848), with a five-step 2-log difference between the two.
Fluconazole SRA studies of
Candida
species.
SRA was
ap-plied to
Candida
isolates including 24
C. albicans
, 12
C.
glabra-ta
, 3
C. krusei
, 2
C. lusitaniae
, 5
C. parapsilosis
, and 3
C.
tropi-calis
strains. Five American Type Culture Collection (ATCC)
reference
Candida
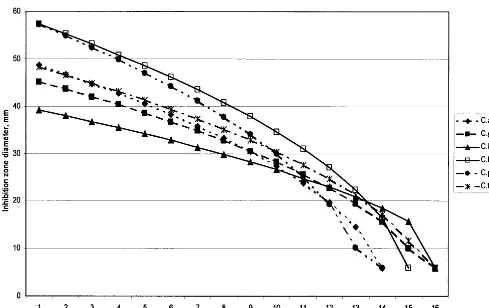
strains were also analyzed. Fluconazole
re-gression lines calculated for a 25-
g disk content from the
means of the constants for the clinical isolates specieswise
showed a substantial variation between the different species
(Fig. 1). A statistical analysis showed that the species differed
significantly in their constant
A
values (Kruskal-Wallis test and
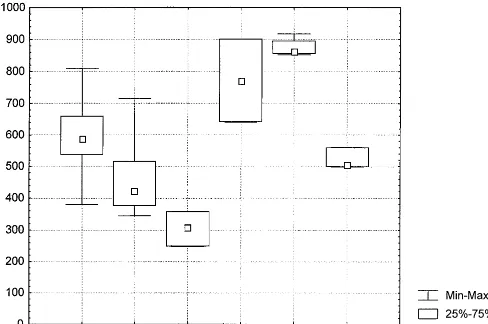
Mann-Whitney U test after Bonferroni correction). A box-plot
of the constant
A
values is shown in Fig. 2.
C. krusei
gave
the lowest value for the slope constant
A
(
A
⫽
305) whereas
C. lusitaniae
and
C. parapsilosis
showed the steepest curves
(
A
⫽
771 and
A
⫽
876, respectively [Fig. 2]). Among isolates
from the same species the
A
constants were relatively
homo-geneous, with coefficients of variation between 3 and 25%. The
results indicated that the different
Candida
species should be
treated separately. Results for the ATCC reference strains
showed a similar pattern, with
C. parapsilosis
giving the
steep-est curve. The
A
constants were within the 25 to 75% range of
the clinical isolates for only
C. glabrata
, and
C. krusei
. The
[image:2.612.52.555.83.173.2]C. parapsilosis
and
C. tropicalis
values were outside the full
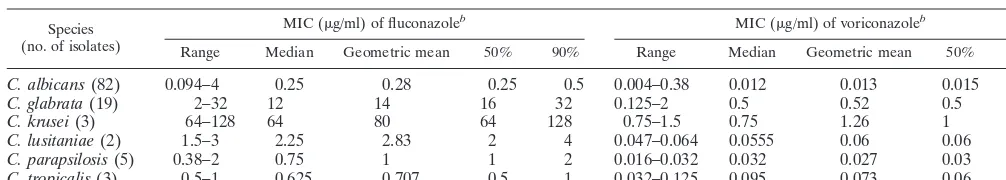
TABLE 1. Fluconazole and voriconazole susceptibility of
Candida
isolates
aSpecies (no. of isolates)
MIC (g/ml) of fluconazoleb MIC (g/ml) of voriconazoleb
Range Median Geometric mean 50% 90% Range Median Geometric mean 50% 90%
C. albicans
(82)
0.094–4
0.25
0.28
0.25
0.5
0.004–0.38
0.012
0.013
0.015
0.015
C. glabrata
(19)
2–32
12
14
16
32
0.125–2
0.5
0.52
0.5
2
C. krusei
(3)
64–128
64
80
64
128
0.75–1.5
0.75
1.26
1
2
C. lusitaniae
(2)
1.5–3
2.25
2.83
2
4
0.047–0.064
0.0555
0.06
0.06
0.06
C. parapsilosis
(5)
0.38–2
0.75
1
1
2
0.016–0.032
0.032
0.027
0.03
0.03
C. tropicalis
(3)
0.5–1
0.625
0.707
0.5
1
0.032–0.125
0.095
0.073
0.06
0.125
aMICs of strains were determined using the E-test according to the instructions of the manufacturer. bRange and median calculated on full range of MICs from E-tests. 50% and 90%, MIC
50and MIC90, respectively.
V
OL. 39, 2001
CANDIDA
SUSCEPTIBILITY TO FLUCONAZOLE AND VORICONAZOLE
1423
on May 15, 2020 by guest
http://jcm.asm.org/
range of the clinical isolates of the same species and the
C.
al-bicans
constant
A
was just within this range. Therefore, these
reference strains should perhaps not be used as representatives
without further investigations. In these studies the mean values
of the constants from the clinical isolates were used for
cali-brations.
Calibration of fluconazole disk diffusion testing of
Candida
species.
Using the fluconazole regression lines shown in Fig. 1
the zone diameter interpretive breakpoints corresponding to
the MIC limits (for susceptibility,
ⱕ
8
g/ml, and for resistance,
ⱖ
64
g/ml for fluconazole, according to NCCLS guidelines)
were calculated for the most common species. For the 25-
g
fluconazole disk the calculated zone breakpoints for
suscepti-bility were
ⱖ
18 mm for
C. albicans
and
ⱖ
22 mm for
C. glabrata
and
C. krusei
. A disk content of 20
g of fluconazole will give
zone diameters just below the results obtained using a 25-
g
disk, i.e., about 1 mm less. When the zone breakpoints were
tested on the available 20-
g disk results, all
C. albicans
strains
were susceptible in accordance with the MIC results. The
C. glabrata
isolates clustered around the susceptibility
break-point, in line with the MIC results.
C. krusei
isolates were all
resistant. It was thus apparent that calibration of the disk test
yielded results which corresponded to MIC results.
Determination of an optimal disk potency for voriconazole
disk testing.
A rational definition of an optimal disk content
has been proposed in earlier studies (16, 21). It was defined as
the smallest amount of antibiotic in the disk still capable of
producing measurable inhibition zones corresponding to the
MIC limit for resistance and for all bacterial species
encoun-tered. The interesting point is that this criterion can be tested
using SRA. Since no recommendations on MIC susceptibility
limits are yet available, a resistance breakpoint of
ⱖ
6.25
g/ml
given in studies of voriconazole (34) was taken as an indication
of the level of the MIC limit. We therefore used 4
g/ml as an
MIC limit for calculation of an optimal disk content, but there
is reason to believe that the limit might be set at a lower level.
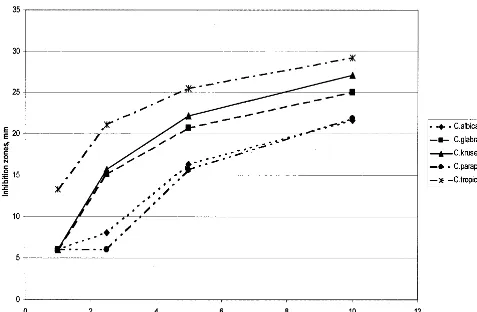
The zone equivalents of 4
g/ml were then calculated for five
Candida
species using regression lines with mean equation
constants from SRA studies of the clinical isolates (Fig. 3).
Both 10- and a 5-
g voriconazole disks gave adequate zones at
4
g/ml for all five
Candida
species, whereas a 2.5-
g disk gave
zones at the same MIC for only three of the species (Fig. 3). A
5-
g voriconazole disk seems optimal if an MIC limit for
voriconazole resistance is around 4
g/ml. Calibration of
vori-conazole disk diffusion testing of
Candida
species would also
be possible, analogous to the calibration for fluconazole, but
such calculations await the proper announcement of MIC
lim-its for the susceptibility categories.
M-test of azole MICs for Candida species.
SRA will permit
[image:3.612.58.547.70.378.2]the estimation of the MICs for strains according to recent
modifications and the development of the M-test (17). We
applied the M-test principle to fluconazole and voriconazole
testing of the two most frequent
Candida
species in the present
studies. The Q-zero values were determined for 24 strains of
FIG. 1. Regression lines for a 25-g fluconazole disk and different
Candida
species, calculated using the mean SRA equation constants
A
and
B
obtained from tests of clinical isolates. The SRA equation uses the zone size squared, which gives a curved appearance of the regression lines
in this linear plot. Abbreviations: C.albic.,
C. albicans
; C.glabr.,
C. glabrata
; C.lusit.,
C. lusitaniae
; C.paraps.,
C. parapsilosis
; C.tropic.,
C. tropicalis
.
on May 15, 2020 by guest
http://jcm.asm.org/
C. albicans
and for 12 strains of
C. glabrata
. Comparisons with
the true MICs obtained by E-tests permitted a calculation of
the conversion factors required to convert Q-zero to an
MIC. Their mean values were 1.55 (standard deviation [SD],
1.0) and 4.12 (SD, 1.9), respectively, for fluconazole and 2.71
(SD, 3.1) and 7.41 (SD, 11.2), respectively, for voriconazole.
Earlier studies have shown mean conversion values of ca. 2,
and until further studies have confirmed the species-related
conversion factors above, a factor of two was used in the
present studies for estimating the MICs for the strains (17).
When the estimated MICs were compared with the
E-test-generated MICs there was a positive correlation between the
two, for both
Candida
species and the two antibiotics. The
r
value was 0.859 for the fluconazole-
C. glabrata
combination
and 0.70 for the fluconazole-
C. albicans
combination and was
lower for voriconazole testing. These results are very
interest-ing and should be further evaluated usinterest-ing reference methods
for MIC determinations and with particular emphasis on the
possible correlation between different conversion factors and
Candida
species.
DISCUSSION
Using the E-test for MIC determinations we could confirm
the susceptibility of 114 clinical
Candida
isolates to
voricon-azole, including the species
C. albicans, C. glabrata, C. krusei,
C. lusitaniae, C. parapsilosis
, and
C. tropicalis
(Table 1) (22, 34).
The fluconazole MICs for the 114
Candida
isolates were as
expected from earlier reports, with all species susceptible,
ex-cept
C. glabrata
, which was susceptible to S-DD, and
C. krusei
,
which was fully resistant (22, 33, 34, 38). When we compared
the results for MICs of fluconazole and voriconazole for each
strain there was a correlation between the two as reported
earlier for azole drugs including voriconazole (5, 29, 34, 40).
The five 2-log steps by which MICs of voriconazole were lower
brought the less fluconazole-susceptible species
C. glabrata
and
C. krusei
into the range of voriconazole susceptibility. This
azole cross-resistance in
Candida
isolates might suggest that
earlier azole drugs with lower activity should be avoided and
that the more potent azoles should be used in all instances,
calling for this kind of drug.
Earlier studies have indicated that disk diffusion might be
used for the susceptibility testing of
Candida
isolates (2, 3, 23,
26, 35–37, 41). There are, however, problems with the reading
of the results as pointed out by others, which we can verify. The
E-test is also a diffusion-based method, and the instructions for
[image:4.612.59.547.75.399.2]Candida
E-testing can serve as a useful guide for the
determi-nation of the proper edge of the inhibition zone (AB Biodisk
E-test technical guide). The other problem with azole disk
testing of
Candida
isolates is the lack of proper guidelines for
disk contents and susceptibility interpretations. In the present
studies we have shown that this problem can be solved by
calculating the zone diameter equivalent of the MIC limit for
FIG. 2. Box plot of SRA constant
A
values from clinical isolates in fluconazole SRA tests using an M-test series of disks containing 2.5, 5.0,
10, 20, 40, and 80
g of fluconazole, respectively. C. alb,
C. albicans
(see the legend to Fig. 1 for other abbreviations).
V
OL. 39, 2001
CANDIDA
SUSCEPTIBILITY TO FLUCONAZOLE AND VORICONAZOLE
1425
on May 15, 2020 by guest
http://jcm.asm.org/
susceptibility using SRA (15, 19–21, 28). The regression lines
can be determined for the individual species, and the
labora-tory-specific influence is automatically included when this
anal-ysis is performed in the individual clinical microbiology setting.
This method seems promising as a new tool for calibration of
disk testing in those laboratories where large volumes of
iso-lated pathogens are tested daily for antibiotic susceptibility.
Often, the ATCC reference strain for a species shares the
characteristics of most clinical isolates and can therefore be
used as the reference strain for SRA calibration. For the
Can-dida
species studied here this does not seem to be the case, and
further studies are therefore required in order to select
repre-sentative ATCC or National Collection of Type Cultures
strains for SRA reference purposes in disk test calibration.
A rational definition of the optimal disk content of an
anti-biotic for disk testing has recently been proposed by Kronvall
and Holst (18; see also references 16 and 21): “the lowest disk
content of antibiotic which will distinguish resistant strains of
any bacterial species from strains of the intermediate or
sus-ceptible category.” This means that measurable inhibition
zones should be produced corresponding to the MIC limit for
resistance, a criterion which can easily be tested using SRA
calculations. This definition ensures that the disk content will
not be too low but will not be unnecessarily high either. We
applied this definition to voriconazole susceptibility testing,
assuming an MIC limit for voriconazole resistance of 4
g/l
based on levels obtained by oral medication (34). The results
indicated that a 5-
g disk content of voriconazole would
suf-fice. However, a lower MIC limit for resistance might be
pos-sible, and then a 2- to 2.5-
g disk content could be sufficient.
A final calculation awaits the NCCLS guidelines for
voricon-azole testing when the MIC limits for susceptibility have been
decided upon.
A novel SRA modification based on principles known for
several years (9, 10, 39) was also tested in the present studies,
the M-test (17). When the antibiotic applications are made on
a strip it might look like the E-test, but the latter is based on
the diffusion of a predefined continous gradient of antibiotic
whereas in contrast the M-test uses three to five different disk
contents of antibiotics and the MICs are calculated using the
modified SRA equation (17). The M-test was applied to the
two major species,
C. albicans
and
C. glabrata
, and the MIC
estimates (using a general conversion factor of 2.0) were
com-pared with the true MICs of the isolates. There was a
signifi-cant correlation between the two measurements. We also found
clear species-related differences for the conversion factor.
Re-ports have shown that E-test results indicate MICs that are
higher than true MIC for some species, e.g.,
C. albicans
, but
lower for other species, e.g.,
C. glabrata, C. tropicalis
, and
C. parapsilosis
(7, 25, 43). Species-related conversion factors
might remedy such deviations in M-tests.
[image:5.612.66.543.72.384.2]The results of the present studies on azole susceptibility
testing of
Candida
species have shown that voriconazole might
be a first-choice azole in treating
Candida
infections. It was
FIG. 3. Calculated inhibition zone diameter equivalents of a voriconazole MIC of 4
g/ml around disks with 1, 2.5, 5, and 10
g of voriconazole,
respectively.
on May 15, 2020 by guest
http://jcm.asm.org/
also clear that the lack of proper zone diameter breakpoints
for susceptibility interpretations can be remedied by SRA
cal-ibration of the azole disk test. This calcal-ibration procedure will
also provide species-related and laboratory-specific
interpre-tive breakpoints corresponding to the reference
authority-rec-ommended MIC limits for the susceptibility categories.
More-over, a novel modification of SRA, the M-test, will permit the
direct estimation of MICs for clinical isolates. However, there
are still some uncertainties regarding the proper conversion
factors to be used for the different combinations of drugs and
species, and these uncertainties have to be solved by extended
studies on the applicability of the M-test.
ACKNOWLEDGMENTS
This research work was supported by a grant from Pfizer AB, Ta¨by,
Sweden; by funds from the Karolinska Institute; and by the
Scandina-vian Society for Antimicrobial Chemotherapy Foundation.
We acknowledge Erja Chryssanthou for valuable advice and fruitful
discussions and Anne Bolmstro¨m, AB Biodisk, for providing E-test
strips for MIC determinations.
REFERENCES
1.Barnett, J. A., R. W. Payne, and D. Yarrow.1990. Yeasts: characteristics and identification. Cambridge University Press, Cambridge, England. 2.Barry, A. L., and S. D. Brown.1996. Fluconazole disk diffusion procedure for
determining susceptibility ofCandidaspecies. J. Clin. Microbiol.34:2154– 2157.
3.Bille, J., and M. P. Glauser.1997. Evaluation of the susceptibility of patho-genic Candida species to fluconazole. Fluconazole Global Susceptibility Study Group. Eur. J. Clin. Microbiol. Infect. Dis.16:924–928.
4.Bjo¨rklind, A., S. Ringertz, and G. Kronvall.1989. Types of interpretive errors in susceptibility testing. APMIS97:941–948.
5.Cartledge, J. D., J. Midgley, and B. G. Gazzard.1997. Clinically significant azole cross-resistance in Candida isolates from HIV-positive patients with oral candidosis. AIDS11:1839–1844.
6.Chryssanthou, E., J. Torssander, and B. Petrini.1995. Oral Candida albi-cans isolates with reduced susceptibility to fluconazole in Swedish HIV-infected patients. Scand. J. Infect. Dis.27:391–395.
7.Colombo, A. L., F. Barchiesi, D. A. McGough, A. W. Fothergill, and M. G. Rinaldi.1995. Evaluation of the E test system versus a microtitre broth method for antifungal susceptibility testing of yeasts against fluconazole and itraconazole. J. Antimicrob. Chemother.36:93–100.
8.Colombo, A. L., F. Barchiesi, D. A. McGough, and M. G. Rinaldi.1995. Comparison of Etest and National Committee for Clinical Laboratory Stan-dards broth macrodilution method for azole antifungal susceptibility testing. J. Clin. Microbiol.33:535–540.
9.Delignette-Muller, M. L., and J. P. Flandrois.1994. An accurate diffusion method for determining bacterial sensitivity to antibiotics. J. Antimicrob. Chemother.34:73–81.
10. Drugeon, H. B., M.-E. Juvin, J. Caillon, and A.-L. Courtieu.1987. Assess-ment of formulas for calculating critical concentration by the agar diffusion method. Antimicrob. Agents Chemother.31:870–875.
11. Ericsson, H. M., and J. C. Sherris.1971. Antibiotic sensitivity testing. Report of an international collaborative study. Acta Pathol. Microbiol. Scand. Sect. B (Suppl. 217:1–90.
12. Espinel-Ingroff, A., F. Barchiesi, K. C. Hazen, J. V. Martinez-Suarez, and G. Scalise.1998. Standardization of antifungal susceptibility testing and clinical relevance. Med. Mycol.36(Suppl. 1):68–78.
13. Espinel-Ingroff, A., M. Pfaller, M. E. Erwin, and R. N. Jones.1996. Inter-laboratory evaluation of Etest method for testing antifungal susceptibilities of pathogenic yeasts to five antifungal agents by using Casitone agar and solidified RPMI 1640 medium with 2% glucose. J. Clin. Microbiol.34:848– 852.
14. Franz, R., S. L. Kelly, D. C. Lamb, D. E. Kelly, M. Ruhnke, and J. Mor-schhauser.1998. Multiple molecular mechanisms contribute to a stepwise development of fluconazole resistance in clinicalCandida albicansstrains. Antimicrob. Agents Chemother.42:3065–3072.
15. Kronvall, G.1982. Analysis of a single reference strain for determination of gentamicin regression line constants and inhibition zone diameter break-points in quality control of disk diffusion antibiotic susceptibility testing. J. Clin. Microbiol.16:784–793.
16. Kronvall, G.1998. Improving the accuracy of disc diffusion antibiotic sus-ceptibility testing using species-related interpretive zone breakpoints. Indian J. Med. Microbiol.16:138–142.
17. Kronvall, G.2000. MIC determination of fusidic acid and of ciprofloxacin using multidisk diffusion tests. Clin. Microbiol. Infect.6:483–489. 18. Kronvall, G., and E. Holst.2000. Calibration of the disk diffusion test for
trovafloxacin susceptibility testing of four anaerobic species. Clin. Microbiol. Infect.6:195–201.
19. Kronvall, G., and S. Ringertz.1991. Antibiotic disk diffusion testing revis-ited. Single strain regression analysis. APMIS99:295–306.
20. Kronvall, G., S. Ringertz, I. Karlsson, E. Go¨ransson, and K. Dornbusch.
1988. Laboratory- and species-specific interpretive breakpoints for disk dif-fusion tests of chloramphenicol susceptibility ofHaemophilus influenzae. Antimicrob. Agents Chemother.32:1484–1489.
21. Kronvall, G., M. Rylander, M. Walder, L. Lind-Brandberg, P. Larsson, E. To¨rnqvist, and T. Monsen.1999. Calibration of disk diffusion antibiotic susceptibility testing: species-related trovafloxacin interpretive zone break-points and selection of disk potency. Scand. J. Infect. Dis.31:573–578. 22. Lozano-Chiu, M., S. Arikan, V. L. Paetznick, E. J. Anaissie, and J. H. Rex.
1999. Optimizing voriconazole susceptibility testing ofCandida: effects of incubation time, endpoint rule, species ofCandida, and level of fluconazole susceptibility. J. Clin. Microbiol.37:2755–2759.
23. Lozano-Chiu, M., P. W. Nelson, V. L. Paetznick, and J. H. Rex.1999. Disk diffusion method for determining susceptibilities ofCandidaspp. to MK-0991. J. Clin. Microbiol.37:1625–1627.
24. Martin, M. V.1999. The use of fluconazole and itraconazole in the treatment of Candida albicans infections: a review. J. Antimicrob. Chemother.44:429– 437.
25. Martin-Mazuelos, E., M. J. Gutierrez, A. I. Aller, S. Bernal, M. A. Martinez, O. Montero, and G. Quindos.1999. A comparative evaluation of Etest and broth microdilution methods for fluconazole and itraconazole susceptibility testing of Candida spp. J. Antimicrob. Chemother.43:477–481.
26. Meis, J., M. Petrou, J. Bille, D. Ellis, D. Gibbs, and Global Antifungal Surveillance Group.2000. A global evaluation of the susceptibility of Can-didaspecies to fluconazole by disk diffusion. Diagn. Microbiol. Infect. Dis.
36:215–223.
27. National Committee for Clinical Laboratory Standards.1997. Reference method for broth dilution antifungal susceptibility testing of yeasts, p. 1–29. Approved standard. Document M27-A. National Committee for Clinical Laboratory Standards, Wayne, Pa.
28. Oppenheimer, M., G. Kronvall, I. Karlsson, and E. Holst.2000. Fusidic acid disk diffusion testing of Clostridium difficile can be calibrated using SRA, single strain regression analysis. Scand. J. Infect. Dis.32:633–637. 29. Pelletier, R., J. Peter, C. Antin, C. Gonzalez, L. Wood, and T. J. Walsh.2000.
Emergence of resistance ofCandida albicansto clotrimazole in human im-munodeficiency virus-infected children: in vitro and clinical correlations. J. Clin. Microbiol.38:1563–1568.
30. Rex, J. H., P. W. Nelson, V. L. Paetznick, M. Lozano-Chiu, A. Espinel-Ingroff, and E. J. Anaissie.1998. Optimizing the correlation between results of testing in vitro and therapeutic outcome in vivo for fluconazole by testing critical isolates in a murine model of invasive candidiasis. Antimicrob. Agents Chemother.42:129–134.
31. Rex, J. H., M. A. Pfaller, J. N. Galgiani, M. S. Bartlett, A. Espinel-Ingroff, M. A. Ghannoum, M. Lancaster, F. C. Odds, M. G. Rinaldi, T. J. Walsh, and A. L. Barry.1997. Development of interpretive breakpoints for antifungal susceptibility testing: conceptual framework and analysis of in vitro-in vivo correlation data for fluconazole, itraconazole, and candida infections. Sub-committee on Antifungal Susceptibility Testing of the National Committee for Clinical Laboratory Standards. Clin. Infect. Dis.24:235–247.
32. Rex, J. H., M. G. Rinaldi, and M. A. Pfaller.1995. Resistance ofCandida species to fluconazole. Antimicrob. Agents Chemother.39:1–8.
33. Ruhnke, M., A. Schmidt-Westhausen, E. Engelmann, and M. Trautmann.
1996. Comparative evaluation of three antifungal susceptibility test methods
forCandida albicansisolates and correlation with response to fluconazole
therapy. J. Clin. Microbiol.34:3208–3211.
34. Ruhnke, M., A. Schmidt-Westhausen, and M. Trautmann.1997. In vitro activities of voriconazole (UK-109,496) against fluconazole-susceptible and -resistantCandida albicansisolates from oral cavities of patients with human immunodeficiency virus infection. Antimicrob. Agents Chemother.41:575– 577.
35. Sandven, P.1999. Detection of fluconazole-resistantCandidastrains by a disc diffusion screening test. J. Clin. Microbiol.37:3856–3859.
36. Scheven, M.1993. Testing susceptibility of fungi to fluconazole. Eur. J. Clin. Microbiol. Infect. Dis.12:393–395.
37. Schmalreck, A. F., and I. Kottmann.1996. Empfindlichkeitspru¨fung von Hefen gegenu¨ber Fluconazol: Vorschlag fu¨r eine standardisierte Agardiffu-sions-Methode mit 25-g-Fluconazol-Testbla¨ttchen. Mycoses39(Suppl. 2):
27–30.
38. Sewell, D. L., M. A. Pfaller, and A. L. Barry.1994. Comparison of broth macrodilution, broth microdilution, and E test antifungal susceptibility tests for fluconazole. J. Clin. Microbiol.32:2099–2102.
39. Shannon, R., A. J. Hedges, and R. J. Edwards.1975. Distribution of levels of penicillin resistance among freshly isolated strains ofN. gonorrhoeae. Appli-cation of a novel sensitivity assay. Br. J. Venereal Dis.51:246–250. 40. Stevens, D. A., and J. A. Stevens.1996. Cross-resistance phenotypes of
V
OL. 39, 2001
CANDIDA
SUSCEPTIBILITY TO FLUCONAZOLE AND VORICONAZOLE
1427
on May 15, 2020 by guest
http://jcm.asm.org/
fluconazole-resistant Candida species: results with 655 clinical isolates with different methods. Diagn. Microbiol. Infect. Dis.26:145–148.
41.Troillet, N., C. Durussel, J. Bille, M. P. Glauser, and J. P. Chave.1993. Correlation between in vitro susceptibility of Candida albicans and flucon-azole-resistant oropharyngeal candidiasis in HIV-infected patients. Eur. J. Clin. Microbiol. Infect. Dis.12:911–915.
42.Warren, N. G., and K. C. Hazen.1999.Candida, Cryptococcus, and other yeasts of medical importance, p. 1184–1199.InP. R. Murray, E. J. Baron,
M. A. Pfaller, F. C. Tenover, and R. H. Yolken (ed.), Manual of Clinical Microbiology. ASM Press, Washington, D.C.
43.White, T. C., K. A. Marr, and R. A. Bowden.1998. Clinical, cellular, and molecular factors that contribute to antifungal drug resistance. Clin. Micro-biol. Rev.11:382–402.
44.Xu, J., A. R. Ramos, R. Vilgalys, and T. G. Mitchell.2000. Clonal and spontaneous origins of fluconazole resistance inCandida albicans. J. Clin. Microbiol.38:1214–1220.