www.impactjournals.com/oncotarget/ Oncotarget, Vol. 7, No. 41
MYCN and HDAC5 transcriptionally repress
CD9
to trigger
invasion and metastasis in neuroblastoma
Johannes Fabian1,2, Desirée Opitz1, Kristina Althoff3, Marco Lodrini1,4, Barbara Hero5, Ruth Volland5, Anneleen Beckers6,7, Katleen de Preter6,7, Anneleen Decock6,7, Nitin Patil8, Mohammed Abba8, Annette Kopp-Schneider9, Kathy Astrahantseff4, Jasmin Wünschel1,4, Sebastian Pfeil4, Maria Ercu4, Annette Künkele4, Jamie Hu1,10, Theresa Thole1,4, Leonille Schweizer11, Gunhild Mechtersheimer12, Daniel Carter13, Belamy B. Cheung13, Odilia Popanda14, Andreas von Deimling11,15, Jan Koster16, Rogier Versteeg16, Manfred Schwab17, Glenn M. Marshall13,18, Frank Speleman6,7, Ulrike Erb19, Margot Zoeller19, Heike Allgayer8, Thorsten Simon5, Matthias Fischer5,20,21, Andreas E. Kulozik22, Angelika Eggert4, Olaf Witt1,22, Johannes H. Schulte4 and Hedwig E. Deubzer1,4,22,23
1 Clinical Cooperation Unit Pediatric Oncology, German Cancer Research Center (DKFZ) and German Consortium for Translational Cancer Research (DKTK), INF, Heidel berg, Germany
2 Phenex Pharmaceuticals AG, Waldhofer Straße, Heidelberg, Germany
3 Department of Pediatric Hematology and Oncology, University Children’s Hospital Essen, Essen, Germany
4 Department of Pediatric Hematology, Oncology and SCT, Charité - University Hospital Berlin, Campus Virchow-Klinikum, Berlin, Germany
5 Department of Pediatric Hematology and Oncology, University of Cologne, Cologne, Ger many 6 Center for Medical Genetics Ghent, Ghent University, De Pintelaan, Ghent, Belgium
7 Cancer Research Institute Ghent, De Pintelaan, Ghent, Belgium
8 Department of Experimental Surgery, Medical Faculty Mannheim, University of Heidelberg, Centre for Biomedicine and Medical Technology, Mannheim, Germany
9 Department of Biostatistics, German Cancer Research Center (DKFZ), INF, Heidelberg, Germany 10 Yale University, New Haven, CT
11 Department of Neuropathology, University of Heidelberg, INF, Heidelberg, Germany 12 Department of Pathology, University of Heidelberg, INF, Heidelberg, Germany 13 Children’s Cancer Institute, UNSW, Randwick, NSW, Australia
14 Division of Epigenomics and Cancer Risk Factors, DKFZ, INF, Heidelberg, Germany 15 Clinical Cooperation Unit Neuropathology, DKFZ, INF, Heidelberg, Germany
16 Department of Oncogenomics and Emma Children’s Hospital, Academic Medical Center, University of Amster- dam, Meibergdreef, Amsterdam, the Netherlands
17 Neuroblastoma Genetics, DKFZ, INF, Heidelberg, Germany
18 Kids Cancer Centre, Sydney Children’s Hospital Randwick, Randwick, NSW, Australia
19 Experimental Surgery and Tumor Cell Biology, University of Heidelberg, INF, Heidelberg, Germany 20 Center for Molecular Medicine Cologne, University of Cologne, Cologne, Germany
21 Max Plank Institute for Metabolism Research, Cologne, Germany
22 Department of Pediatric Hematology and Oncology, Heidelberg University, INF, Heidelberg, Germany
23 Junior Neuroblastoma Research Group, Experimental and Clinical Research Center of the Max-Delbrück Center for Molecular Medicine in the Helmholtz Community and the Charité - University Medicine Berlin, Lindenberger Weg, Berlin, Germany Correspondence to: Hedwig E. Deubzer, email: hedwig.deubzer@charite.de
Keywords: antimetastatic therapy, chromatin modulation, histone deacetylases, grainyhead-like transcription factor family, tet-raspanin family
Received: April 29, 2016 Accepted: August 24, 2016 Published: August 27, 2016
INTRODUCTION
Neuroblastoma, an embryonic tumor of neuroectodermal origin, accounts for 11% of all cancer-related deaths in children [1]. Molecular aspects create the extreme heterogeneity of this disease, spanning spontaneous regression to rapid metastasizing progression [1, 2]. Treatment scenarios range between observation only and multimodal concepts including high-dose chemotherapy with autologous stem cell rescue, surgery, radiotherapy and immunotherapy[3]. Despite decades of considerable international efforts to improve outcome, long-term survival of high-risk disease remains as low as 20%[3]. Managing resistance to induction therapy, causing tumor progression and early death in ultrahigh-risk patients, and managing chemotherapy-resistant relapses, which can occur years after initial diagnosis, remain major obstacles. MYCN amplifications [4, 5],
telomerase activation by genomic rearrangements [6, 7],
ATRX loss-of-function mutations or deletions [8-10] and germline or somatically acquired activating ALK mutations
[11-14] define patient subgroups with highly aggressive
and frequently therapy-resistant neuroblastomas. A commonality among these aggressive subgroups is that tumors undergo an as yet poorly understood invasion-metastasis cascade, which may be druggable to prevent increasing metastatic colonization.
Tetraspanin proteins all have four membrane-spanning domains, and form clusters between themselves and a large variety of molecules, predominantly including integrins, proteases and gangliosides. Tetraspanins can become engaged in signal transduction by recruiting cytoplas- mic kinases to the glycolipid- and cholesterol-enriched membrane microdomains to which they are
localized [15-17]. CD9 tetraspanin expression strongly
varies among different organs, with the highest expression found in endocrine tissues and the gastrointestinal tract, and the lowest expression reported both in liver and gall
bladder [18]. Here, we assessed the significance of CD9
expression in primary neuroblastomas using clinical and molecular tumor data, unraveled the upstream activating and repressive control including epigenetic events and
analyzed the functional role of CD9 using targeted CD9
re-expression in cell and animal models of neuroblastoma.
RESULTS
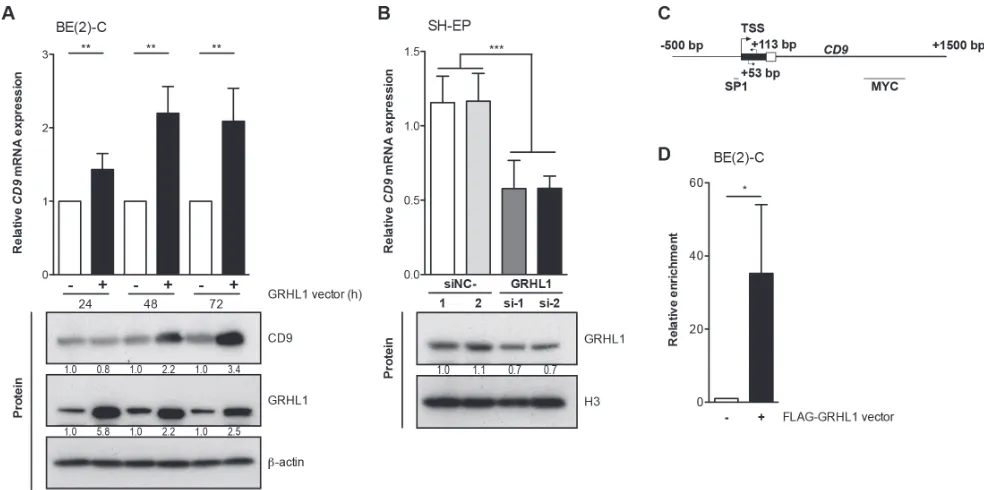
GRHL1 is a transcriptional activator of CD9
High-level GRHL1 expression favorably influences
neuroblastoma biology at the molecular and phenotypic
levels [19]. Time-resolved whole-genome expression
ABSTRACT
The systemic and resistant nature of metastatic neuroblastoma renders it largely incurable with current multimodal treatment. Clinical progression stems mainly from the increasing burden of metastatic colonization. Therapeutically inhibiting the
migration-invasion-metastasis cascade would be of great benefit, but the mechanisms
driving this cycle are as yet poorly understood. In-depth transcriptome analyses
and ChIP-qPCR identified the cell surface glycoprotein, CD9, as a major downstream
analyses on BE(2)-C cells transfected with empty- or
GRHL1 vectors resulted in differential regulation over time of 170 genes, including CD9 [19]. Increasing CD9
expression following enforced GRHL1 expression in
BE(2)-C cells was confirmed both on the mRNA level by qRT-PCR and on the protein level by western blot
analysis (Figure 1A). Transient knockdown of GRHL1
in SH-EP cells by two different siRNAs to control for
unspecific and off-target effects reduced CD9 expression
by approximately 50% (Figure 1B). We next conducted ChIP-qPCR using an antibody against the FLAG tag of FLAG-GRHL1 in overexpressing BE(2)-C cells to
assess whether GRHL1 is recruited to the CD9 promoter
region (Figure 1C). GRHL1 was significantly enriched (Figure 1D) above the control (ChIP for IgG) in the CD9
transcriptional start site distal to a previously described
SP1 binding site [20] and proximal to a MYC binding site (http://genome.ucsc.edu). We conclude that GRHL1
activates CD9 transcription in neuroblastoma cells.
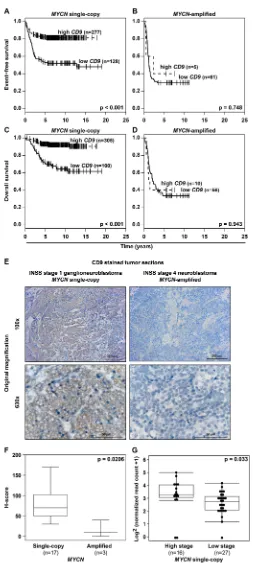
High-level CD9 expression in neuroblastomas predicts favorable survival as an independent prognostic marker
Having shown that CD9 is downstream of GRHL1 in neuroblastoma cells, we assessed whether
CD9 is differentially expressed in primary tumors. We
reanalyzed microarray expression data from a cohort
of 476 neuroblastomas [21]. Kaplan-Meier analysis
showed that high-level CD9 expression in tumors,
irregardless of International Neuroblastoma Staging System (INSS) stage or patient age, correlated both with
favorable event-free and overall patient survival (Figure 2A-2F and Supplementary Figure S1A-S1D). These
correlations were confirmed in microarray expression
data from an independent cohort of 122 neuroblastomas [22] (Supplementary Figure S2A-S2D). High-level CD9
expression in neuroblastomas from the 476-tumor cohort also significantly correlated with established clinical and
molecular markers for favorable tumor biology, including
INSS localized or 4S disease stages, age at diagnosis ≤ 18 months, favorable Shimada/International Neuroblastoma Pathology Classification (INPC) tumor histology, lack
of MYCN amplifications or 1p aberrations and a
low-Figure 1: GRHL1 triggers CD9 expression. A., CD9 expression in BE(2)-C cells 24h-72h after GRHL1 plasmid or empty-vector transfection on mRNA (upper panel; qRT-PCR; mean ± SD; n = 3) and protein level (lower panel; western blot). B., CD9 expression in SH-EP cells 96h after GRHL1 knockdown with small interfering RNAs (si-1, si-2) (upper panel; qRT-PCR; mean fold-change over mock ± SD; n = 3). Controls were transfected with two different negative control siRNAs (siNC-1, siNC-2). GRHL1 knockdown efficacy was measured by western blot at 96h (lower panel) while CD9 protein expression in SH-EP was below detection. Histone H3 served as loading
control. C., schematic representation of the CD9 promoter indicating the primer positions (arrows), the transcriptional start site (TSS) and
[image:3.612.61.553.364.609.2]risk tumor transcriptional profile previously defined by PAM analysis [23] (Figure 2G-2L). Correlations between
elevated CD9 tumor expression and all available clinical and molecular parameters for favorable tumor biology
were confirmed in the 122-tumor cohort (Supplementary Figure S2E-S2H). These included localized INSS localized or 4S disease stages, age at diagnosis ≤ 18
months, lack of MYCN amplifications or 1p aberrations.
Multivariate survival analysis was performed in the
476-tumor cohort to determine whether CD9 expression provides additional predictive power over established clinical and molecular prognostic markers. Established risk factors were associated both with favorable event-free and overall survival in univariate survival analyses (Supplementary Table S3) and the prognostic value of
CD9 expression was independent of these established risk markers in multivariate analyses testing all factors together (event-free survival, P = 0.001; overall survival,
P = 0.005; Supplementary Table S3). Taken together, high-level CD9 expression in primary neuroblastomas
signals a favorable tumor biology and patient prognosis independent of established clinical and molecular risk factors.
MYCN is a transcriptional repressor of CD9
A major factor influencing neuroblastoma biology is
the MYCN status in the tumor, which inversely correlated with CD9 expression in primary neuroblastomas
(Figure 2J, Supplementary Figure S2G).
Kaplan-Meier analyses comparing the predictive power of
CD9 expression in tumors lacking or harboring MYCN
amplifications produced only a significant correlation between high CD9 expression and favorable
event-free and overall survival in the patient cohort with tumors lacking MYCN amplifications (Figure 3A-3D), suggesting that MYCN may be upstream of CD9. To assess whether differential CD9 expression in primary neuroblastomas with and without MYCN amplifications
(Figure 2J, Supplementary Figure S2G) is mirrored at
the protein level, we semiquantified CD9 expression
immunohistochemically in 20 selected samples from tumors with the most divergent characteristics. Tumors lacking MYCN amplifications expressed CD9 in a variably
strong manner, and expression was localized to the cell
membrane, whereas no CD9 expression was detected in
any of the MYCN-amplified tumors (Figure 3E-3F). We
investigated CD9 gene methylation status by reanalyzing
existing methyl-CpG-binding domain sequencing data from 60 neuroblastomas [24, 25]. The CD9 promoter was differentially methylated within the group of tumors lacking MYCN amplifications (n = 43), and high-level
promoter methylation was associated with advanced stage
disease as defined by INSS stages 3 and 4 (Figure 3G). These results confirm the inverse correlation between
MYCN status and CD9 expression at the protein level
and point towards a functional role of CD9 promoter methylation in tumors lacking MYCN amplifications. We
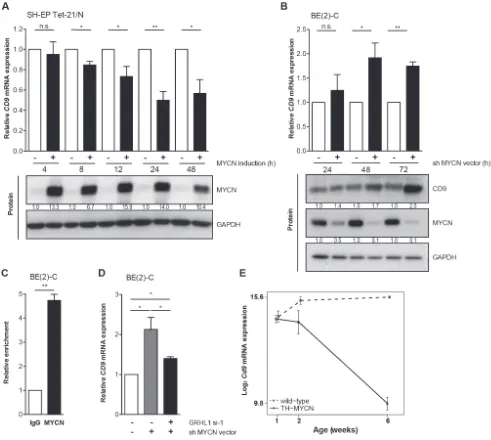
next used several different neuroblastoma cell and mouse models to investigate the nature of this relationship and
the influence of MYCN on CD9 expression. We analyzed
changes in CD9 expression occurring between 4h to 48h in the synthetic MYCN-inducible system, SH-EP Tet-21/N. Conditional MYCN expression downregulated CD9
expression by approximately 15% after 4h and by 50% after 24h (Figure 4A). Endogenous MYCN expression was depleted in BE(2)-C cells by transient expression
of a short hairpin RNA (shRNA) plasmid directed against MYCN. CD9 expression increased between 24h
and 72h time-dependently, reaching a 2-fold increase in
CD9 mRNA expression and a 2.4-fold increase in CD9 protein expression (Figure 4B). Results from these two models suggest that MYCN suppresses CD9 expression. We performed ChiP-qPCR experiments to test whether MYCN directly associates with the CD9 promoter. Not
only was MYCN enriched in the CD9 promoter (compare
Figure 4C with Figure 1C), but this enrichment was confined to the region enriched for GRHL1 (Figure 1D). We have previously shown that MYCN is a transcriptional
repressor of GRHL1 [19]. To test whether GRHL1
is required for CD9 induction mediated by MYCN
depletion, we transiently knocked down both GRHL1
and MYCN in BE(2)-C. Transient GRHL1 knockdown
diminished induction of the CD9 transcript by MYCN depletion by 35%, indicating that GRHL1 contributes to
CD9 transcriptional activating when silencing MYCN (Figure 4D). We next used the TH-MYCN neuroblastoma
progression model to analyze the temporal CD9 expression pattern. CD9 expression was strongly reduced during progressive development of neuroblastic tumors in
TH-MYCN+/+ mice and remained far below CD9 expression
in ganglia from wildtype TH-MYCN-/- mice (Figure 4E).
Collectively, our data argue for a role of MYCN in the
transcriptional repression of CD9 in neuroblastoma cells.
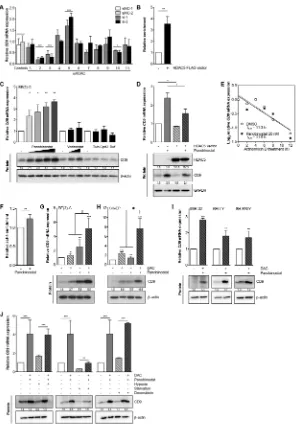
HDAC5 negatively regulates CD9 and combined inhibition of HDAC5 and DNA MTases synergistically induces CD9
A model for transcriptional repression via MYCN involves histone deacetylase (HDAC) recruitment to promoter regions. To identify HDACs potentially
involved in CD9 transcriptional repression, we transiently
knocked down each of the eleven HDACs (using two different siRNAs for each to control for unspecific and
off-target effects, Supplementary Table S2) belonging to
classes I, II a/b and IV in BE(2)-C cells, then assessed
CD9 expression. Only HDAC5 depletion induced CD9
expression, which reached 1.7- to 2.3-fold of the control
Figure 2: High-level CD9 expression in primary neuroblastomas predicts favorable patient survival in a cohort of 476 tumors and correlates with favorable established clinical and molecular markers. Kaplan-Meier analysis of event-free
A.-C. and overall patient survival D.-F. irregardless of INSS stage A., D. and in INSS stage 3 B., E. and stage 4 patients C., F. Box-plots
compare CD9 expression in tumors with varying stages according to INSS G., in tumors from patients with age at diagnosis under or over
18 months H., in tumors with favorable or unfavorable classification according to Shimada/INPC I., in tumors either lacking or harboring
Figure 3: MYCN status and CD9 expression inversely correlate in primary neuroblastomas, and CD9 promoter hypermethylation is associated with advanced stage disease in tumors lacking MYCN amplifications. A.-D., high-level
CD9 expression in MYCN single-copy but not in MYCN-amplified tumors predicts favorable patient survival in a cohort of 476 tumors.
Kaplan-Meier analysis of event-free A.-B. and overall C.-D. patient survival. E.-F., the differential pattern of CD9 expression is translated to the protein level in neuroblastomas having the most divergent tumor biologies. CD9 immunohistochemical staining (brown) is exemplarily
shown E. for a low-risk INSS stage 1 ganglioneuroblastoma lacking MYCN amplification and an INSS stage 4 poorly differentiated
high-risk neuroblastoma harboring a MYCN amplification. CD9 expression was semi-quantitatively analyzed, and the data for all 20 tumors
were presented as box-plots comparing the MYCN single-copy and MYCN-amplified tumor groups F.G., Box-plots compare CD9 promoter
while depleting HDACs 2, 3 and 10 decreased CD9
levels (Figure 5A), suggesting HDACs 2, 3 and 10 may counteract HDAC5 influence on CD9 expression. To test
whether HDAC5 is recruited to the CD9 promoter site, we
[image:7.612.63.554.170.610.2]performed ChIP-qPCRs using anti-FLAG M2-conjugated agarose to capture immunocomplexes after HDAC5-FLAG enforced expression in BE(2)-C cells. HDAC5 was enriched by ~3.5-fold at the CD9 promoter (compare
Figure 5B with Figure 1C), and localized to the region
where GRHL1 was also enriched as a transcriptional
activator and MYCN was enriched as a transcriptional
repressor.
As an alternative approach to HDAC5 knockdown, we treated BE(2)-C cells with a variety of small molecule HDAC inhibitors, then assessed CD9 expression. CD9 induction by the clinically approved pan-HDAC inhibitor,
Figure 4: MYCN inhibits CD9 expression. A.-B., CD9 expression was assessed on the mRNA (qRT-PCR; mean ± SD, n = 3) and protein level (western blots) in the synthetic MYCN-inducible SH-EP Tet-21/N cell model with/without MYCN induction in time-course
A. and in BE(2)-C at designated time points after MYCN depletion B. CD9 protein expression in SH-EP Tet-21/N was below detection.
GAPDH served as loading control. C., ChIP-qPCR showing an enrichment of CD9 promoter DNA associated with MYCN. BE(2)-C lysates
were immunoprecipitated with antibodies against MYCN or IgG, as negative control, and 0.1% of the input served for normalization (mean ± SD, n = 3). D., CD9 expression was assessed on the mRNA level (qRT-PCR; mean ± SD, n = 3) in BE(2)-C 96h after GRHL1 knockdown using a small interfering RNA (si-1) and 72h after MYCN depletion using a short hairpin RNA (shRNA) directed against MYCN. Controls
were transfected with respective negative control siRNA and empty vector. E., the expression of Cd9 during neuroblastoma progression
from tumor-prone ganglia to tumors in transgenic mice (n = 4; full line) and in comparison to Cd9 expression in wild-type ganglia (n = 4;
Figure 5: HDAC5 negatively regulates CD9, and combined DAC/HDAC inhibitor treatment synergistically triggers CD9 expression. A., RNAi targeting HDACS 1-11 singly in BE(2)-C cells with siRNAs (si-1, si-2). Control were transfected with two different negative control siRNAs (siNC-1, siNC-2). CD9 expression was measured by qRT-PCR 96 hours after transfection and is represented as mean fold-change over mock control ± SD (n ≥ 2). B., ChIP-qPCR (mean ± SD, n = 3) showing an enrichment of CD9
promoter DNA associated with HDAC5. BE(2)-C lysates were immunoprecipitated with an antibody against HDAC5 or IgG as negative
control. C., CD9 expression (assessed by qRT-PCR and Western blotting) after treating BE(2)-C cells with panobinostat (5 nM, 10 nM, 15
nM, 20 nM), vorinostat ( 0.5 µM, 1 µM), 5 µM tubacin (Tub), 20 µM compound 2 (Cpd2), 30 µM bufexamac (Buf) or respective solvent controls for 48 hours (mean fold-change over control ± SD is shown, n ≥ 3). D., CD9 expression (assessed by qRT-PCR and Western blotting) in BE(2)-C cells transfected with HDAC5 or empty vector for 72h and treated with 15 nM panobinostat or solvent control for 48h. GAPDH served as loading control. E., CD9 expression (assessed by qRT-PCR) in BE(2)-C cells treated up to 12 hours with 1 µg/ml
Actinomycin D, 20 nM panobinostat or solvent control (n = 3). F., the mean enrichment (±SD, n = 3) of CD9 promoter DNA associated
with pan-acetylated histone H4 after 5 hours of 20 nM panobinostat treatment is shown from ChIP-qPCR experiments. BE(2)-C lysates were immunoprecipitated with an antibody against pan-acetylated histone H4, and 0.1% input lysate was used as a loading control for comparing ChIPs. G.-H., CD9 expression was assessed on the mRNA (qRT-PCR; mean ± SD, n = 3) and protein level (western blotting) in the neuroblastoma cell lines BE(2)-C G. and SH-EP H. 96 hours after treatment with 3 µM DAC, 10 nM panobinostat or combined 3 µM DAC/10 nM panobinostat treatment. β-actin served as loading control. I., CD9 expression in the neuroblastoma cell lines IMR-32, Kelly and SH-SY5Y 48 hours after combined treatment with 3 µM DAC and 5 (IMR-32) - 10 nM panobinostat (Kelly, SH-SY5Y) or solvent controls. J, RNA and protein were isolated from BE(2)-C cells 48 hours after combined treatment with 3 µM DAC/10 nM panobinostat
or solvent controls under normoxia (21% O2) versus hypoxia (3% O2), serum substitution (10% FCS) versus starvation (0.1% FCS) and
normal condition versus genotoxic stress (0.1 µg/ml doxorubicin). CD9 expression was measured at the mRNA and protein levels using
qRT-PCR (mean fold-change over solvent ± SD, n = 3) and western blotting. DAC, 5-aza-2’-deoxycytidine. *P < 0.05; **P ≤ 0.01; ***P ≤
panobinostat, was dose-dependent, and ranged between 2.3- and 3.8-fold on the mRNA level and between 2-
and 5.3-fold on the protein level (Figure 5C). Another clinically approved HDAC-inhibitor, vorinostat, weakly inhibited HDAC5, and only induced CD9 expression by
1.4-fold and CD9 protein levels by 2-fold (Figure 5C). CD9 mRNA or protein expression was not induced by the HDAC6-selective inhibitor, tubacin; the HDAC8-selective
inhibitor, compound 2; or by bufexamac, which inhibits
[image:9.612.60.551.163.628.2]both HDAC6 and HDAC10 (Figure 5C). To test whether enforced HDAC5 expression could at least partially counteract CD9 induction by HDAC inhibitor treatment, BE(2)-C, Kelly and SH-EP cells were transiently transfected with a HDAC5 expression vector then treated with panobinostat. Enforced HDAC5 expression decreased the CD9 induction triggered by panobinostat
Figure 6: High-level CD9 expression inhibits migration and invasion of neuroblastoma cells in Boyden chambers and metastatic disease to the chicken embryo bone marrow. The stable CD9-inducible SH-EP cell model and the respective stable control cells were used to determine the effect of CD9 expression on migration A.-C. and invasion D.-F. Migration/invasion was measured with the xCELLigence Real-Time Cell Analyzer (n = 3 in quadruplicate). E., number of metastasizing BE(2)-C cells with and without enforced CD9 expression in the bone marrow chicken embryos. Cells were transplanted onto the chorioallantoic membranes of fertilized
pathogen-free leghorn eggs (n ≥ 11 per study group). On day 17, the embryos were sacrificed, and the bone marrow was isolated. Human
up to 15% on both transcript and protein levels (Figure 5D, Supplementary Figure S3A-S3B), demonstrating that the effect of pan-HDAC inhibition could be partially outcompeted by HDAC5 overexpression. To
differentiate between de novo transcript synthesis and
increased transcript stability, we cotreated BE(2)-C cells
with actinomycin D and panobinostat or solvent control for up to 12h. Blocking de novo RNA synthesis with actinomycin D resulted in equivalent CD9 expression in
cells treated with HDAC inhibitor and untreated control cells, confirming that control is enacted via transcriptional
activation (Figure 5E). To examine epigenetic changes
prior to CD9 transcriptional activation, we performed
chromatin immunoprecipitation (ChIP) in BE(2)-C cells treated for 5h with panobinostat or solvent control using an antibody against pan-acetylated histone H4, and
looked for changes in the CD9 promoter. We detected an increase in pan-acetylated histone H4 associated with
the transcriptional start site of the CD9 gene after HDAC
inhibitor treatment, indicating that epigenetic changes
preceded transcriptional activation (compare Figure 5F with Figure 1C). Taken together, CD9 is epigenetically and transcriptionally repressed by the chromatin-modifying
enzyme, HDAC5, in association with MYCN, and CD9
expression can be triggered in neuroblastoma cells by
inhibition of HDAC5.
Next, we assessed whether co-treatment with a
nucleoside inhibitor of DNA methylation, 5-Aza-2’-deoxycytidine (DAC), could enhance transcriptional activation. Combined treatment of BE(2)-C and SH-EP neuroblastoma cells with panobinostat and DAC synergistically induced CD9 up to 8-fold on the transcript and 6.5-fold on the protein levels (Figure 5G-5H). We also achieved similar results using the IMR-32, Kelly and SH-SY5Y neuroblastoma cell lines (Figure 5I). We next analyzed the effectiveness of CD9 induction in BE(2)-C cells by combined panobinostat/DAC treatment under
conditions mimicking those in tumors such as hypoxia, starvation and stress induced by cytotoxic drugs such as doxorubicin. Starvation caused by culture for 72h in
serum-free medium strongly reduced endogenous CD9
levels, while both hypoxia and genotoxic stress had
no major effect on CD9 expression (Figure 5J). Drug treatment triggered CD9 expression by 4- to 5-fold compared to controls in all culture conditions (Figure 5J),
suggesting transcription can still be robustly activated. Our
data argue a role for HDAC5 in transcriptionally repressing
CD9 in neuroblastoma cells beyond the repression
achieved by MYCN and DNA methyltransferases, and
[image:10.612.60.552.372.689.2]offers an avenue for pharmacological intervention.
CD9 attenuates neuroblastoma cell migration, invasion and metastasis formation
Data obtained from primary tumors suggested that high-level CD9 expression is associated with favorable
tumor biology. To investigate whether high-level CD9
expression exerts its antitumorigenic effect via influencing
proliferation and viability, SH-EP cells stably transfected with an inducible CD9 construct or a negative control
expression system (Supplementary Figure S4A-S4B) were analyzed in proliferation assays. CD9 induction did not significantly alter cell proliferation or viability in the SH-EP cell model (Supplementary Figure S5A-S5B). Similarly, transient enforced CD9 expression did not alter BE(2)-C cell proliferation or viability compared
to control cells transfected with empty or LacZ vectors
(Supplementary Figure S4C-S4D and Supp- lementary Figure S5C-S5D). Xenograft tumor take or growth rate was also not influenced by prior transient transfection
with either CD9 or LacZ control vector in BE(2)-C cells subcutaneously implanted into CB17-SCID mice (Supplementary Figure S5E). These experiments strongly indicate that CD9 exerts its antitumoral effects via
other avenues than influencing tumor cell proliferation.
To investigate whether migratory or invasive capacity was affected, we functionally analyzed the phenotypic
consequences of inducing CD9 expression in the SH-EP
cell model during Boyden chamber migration and invasion
assays. Inducing CD9 expression reduced cell migration by 40%, while inducing the negative control expression
system produced no difference in cell migration (Figure
6A-6C). Similarly, CD9 induction inhibited invasion capacity by 40%, while inducing the negative control
expression system again had no effect (Figure 6D-6F).
We next evaluated whether our in vitro findings were also
applicable in the in vivo chicken embryo chorioallantoic
membrane metastasis assay. The number of BE(2)-C cells
that metastasized from the chorioallantoic membrane to the chicken embryonic bone marrow was strongly
reduced by enforced CD9 expression compared with
empty vector-transfected control cells (Figure 6G). SH-EP cells, which do not metastasize in the chicken embryo chorioallantoic membrane metastasis assay, were not investigated. Transient enforced expression was applied in
BE(2)-C cells as inducible gene expression by tetracycline
addition is technically not feasible in the chicken embryo chorioallantoic membrane metastasis assay. Taken
together, our data supports a mode of action by CD9, in
which high-level expression in neuroblastoma cells exerts an antitumoral effect by inhibiting several different steps in the invasion-metastasis cascade (schematic model shown in Figure 7).
DISCUSSION
This study identified CD9 as a critical and indirectly
druggable node in the neuroblastoma invasion-metastasis cascade. This is of particular interest since widespread and extensive metastatic burden causes most neuroblastoma-related deaths, mirroring the perception that activating invasion and metastasis belongs to the cancer hallmarks acquired during the multistep development of human tumors [26]. Suppressing neuroblastoma metastasis would, taken in this light, be a top priority to improve survival of high-risk disease with targeted therapeutic approaches. Neuroblastoma originates from aberrant neural crest progenitor cells, which physiologically give rise
both to sympathetic neurons and chromaffin cells of
the adrenal glands [1, 2] . A review of the literature
indicates that CD9 is expressed in early neural
crest-derived embryonic rat sympathetic neurons and adrenal
chromaffin cells. CD9 expression is also sustained
throughout adulthood, localized to the surface of nerve cell bodies, axons and growth cones [27]. Yet, so far,
no role for CD9 has been described in neuroblastoma pathogenesis. We detected low-level CD9 expression in primary neuroblastomas that correlated with metastasized high-risk disease, low probability of patient survival and established clinical and molecular markers for unfavorable disease including MYCN amplification in the tumor.
High-level CD9 expression in primary neuroblastomas served as an independent favorable prognostic marker.
Patients stratified into subgroups based on different CD9
expression levels in the tumors also segregated known
prognostic markers such as age at diagnosis ( ≤ or > 18 months), and INSS tumor stages 3 or 4 versus stages 1, 2
or 4S. The major strength of CD9 tumor expression as a novel prognostic marker may be its potential for predicting disease progression in neuroblastoma patient subgroups.
Using functional assays, we demonstrated that
CD9 suppresses neuroblastoma cell migration and
invasion. This is in line with evidence from studies with ovarian [28] and bladder carcinoma cell lines
[29] that low-level CD9 expression triggers tumor cell motility and invasiveness. On a molecular level, CD9
is known to inhibit integrin-mediated motility and associate with the platelet aggregation-inducting factor podoplanin, thereby preventing platelet aggregation and, consequently, a tumor-cell protective microenvironment
(reviewed in [30]). We moved beyond in vitro assays for invasion and metastasis, to an in vivo model where human neuroblastoma cells explanted to the chicken chorioallantoic membrane invade the chicken embryo bone
marrow, thus, reflecting human neuroblastoma metastatic behavior. Enforced CD9 expression strongly inhibited the
number of neuroblastoma cells metastasized to the chicken
bone marrow demonstrating that CD9 acts to inhibit the
to raise CD9 expression in the tumor could potentially
prevent an increasing burden of metastatic colonization in high-risk neuroblastoma patients.
Here we identified GRHL1 as a transcriptional
activator of the CD9 gene and showed that MYCN and HDAC5 transcriptionally repress CD9 in neuroblastoma. Our experiments with histone deacetylase inhibitors demonstrated the potential indirect druggability of
CD9. Statistical models identified the synergistic effect of combining an HDAC inhibitor and the DNA methyltransferase inhibitor, 5′-azadeoxycytidine,
supporting the observation that epigenetic events can be remodeled by pharmacological intervention. Previous
investigations by us and others [31-35] have delineated and deciphered specific functions of single HDACs in neuroblastomas with defined molecular profiles. We showed that HDAC2 cooperates with MYCN to
suppress apoptosis mediated by miR-183 [36], and
that HDAC3 interacts with MYCN to transcriptionally
repress the GRHL1 transcription factor, which exerts tumor suppressive effects in neuroblastoma[19]. We demonstrated that HDAC8 inhibits neuroblastoma cell differentiation [37] and HDAC10 promotes
autophagy-mediated neuroblastoma cell survival[38]. We detected elevated levels of HDAC11 expression in neuroblastomas
and several carcinomas compared to corresponding
healthy tissues, and showed that HDAC11 depletion was sufficient to cause apoptosis and inhibit metabolic
activity in different cancer cell lines, representing major oncological indications for industrial drug development programs [39]. Beyond the previously described specific and non-redundant oncogenic functions of HDAC2, HDAC3, HDAC8, HDAC10 and HDAC11 in neuroblastoma pathophysiology, this study defines a role for HDAC5 in triggering the invasion-metastasis cascade
in neuroblastoma.
As we are only at the beginning of understanding
the potential therapeutic use of HDAC inhibition
strategies and their combination within complex rationales utilizing several epigenetic-cancer therapies, further
studies are required to define how to best construct drug strategies targeting epigenetic players such as HDACs
and bromodomain and extra-terminal domain (BET) protein family members. Taken together, the present
study (i) identifies low-level CD9 expression as a novel prognostic marker in high-risk neuroblastoma patient subgroups, (ii) exposes CD9 transcriptional activation
by GRHL1 and its repression by MYCN and HDAC5, (iii) defines the potential of high-level CD9 expression
to interrupt the neuroblastoma invasion-metastatic cascade and (iv) demonstrates the indirect druggability
of CD9 by combined inhibition of HDAC5 and DNA
methyltransferase inhibitors.
MATERIALS AND METHODS
Tumor samples and cell culture
Formalin-fixed, paraffin-embedded samples
from 20 primary neuroblastomas (13 localized or
stage 4S and 7 stage 4, 3 of which harboring MYCN
amplifications) available from patients in the NB2004 trial (informed consent available) were selected for CD9
immunohistochemistry. Authenticated neuroblastoma cell lines and models were maintained under standard cell culture conditions. Details are supplied in Supplementary Materials and Methods.
Quantitative reverse-transcriptase real-time PCR (qRT-PCR)
Total RNA was isolated from cell lines using
the RNeasy Mini Kit (Qiagen). The Thermo Scientific First Strand cDNA Synthesis Kit was used to transcribe cDNAs for qRT-PCR analysis. Relative gene expression was measured in qRT-PCR using SYBR Green Dye
(Eurogentec) and primers (Supplementary Table S1) on
an ABI Prism 7500 thermal cycler (Perkin-Elmer Applied
Biosystems), and normalized to the averaged expression of
ACTB and 18S rRNA or the averaged expression of SDHA
and HPRT1, a gene pair that is consistently expressed in
stage 4 and 4S neuroblastomas [40]. Data were analyzed using Applied Biosystems 7500 software v2.0.5, and changes in expression were calculated using the ΔΔCt method [41].
In vitro cell migration and invasion
Migration and invasion of cells was measured
using the CIM-Plate 16 Boyden chamber system (ACEA Biosciences) and the xCELLigence Real-Time Cell Analyzer (ACEA Biosciences) [42, 43]. Boyden chambers were prepared for invasion assays by adding 160µl
FCS-containing medium to the lower chamber and successively
adding 50µl serum-free medium, 20µl Matrigel diluted 1:40 in serum-free medium followed by 4h at 37°C, 5% CO2 and 30µl serum-free medium above the Matrigel to the upper chamber. After 24h in serum-free medium, 6x10⁴
cells were seeded into the upper chamber, and migrating/ invading cells were monitored by serial impedance
TaqMan®-based chicken embryo metastasis assay
Fertilized patho gen-free leghorn eggs (Charles River) were incubated at 37ºC in 60% humidity with rotation in a Marsh Incubator (Lyon Electric). The
allontoic vein was localized at day 10, over which a window was cut in the shell using a miniaturized rotating electric saw (Dremel) after removing air from the natural air space under mild vacuum pressure. Single-cell
suspensions of empty vector- or CD9 plasmid-transfected BE(2)-C cells were prepared in serum-free medium, 2x10⁶ cells inoculated onto each chorioallantoic membrane and the windows sealed with cellotape. Embryos were
sacrificed on day 17 (n = 18 per study group), and bone marrow was isolated and snap frozen for preparation of genomic DNA. The TaqMan-based ALU assay takes advantage of the abundantly present ALU family of short interspersed repeated DNA elements in the human genome
to identify human DNA [44]. PCR reactions were carried out as described [45] using 2x qRT-PCR MasterMix
(Eurogentec) and primers for S68,
YB8-ALU-AS244 and YB8-ALU-167 (Supplementary Table 1). A
standard curve was generated from DNA samples from
10,000, 1000, 100, 10 and 0 BE(2)-C cells mixed with 1µg of chicken liver genomic DNA each to quantify the BE(2)-C cells metastasized to the chicken bone marrow.
TH-MYCN neuroblastoma progression model
TH-MYCN+/+ mice [46] were sacrificed at day 7 (n = 4) and day 14 (n = 4) of life to harvest sympathetic
ganglia containing hyperplastic neuroblast foci, and at week 6 of life to harvest advanced neuroblastic tumors (n = 4). Sympathetic ganglia were also dissected from TH-MYCN-/- mice at day 7 (n = 4), day 14 (n = 4) and week 6 (n = 4) of life to assess gene expression changes
during normal development. Total RNA was isolated using
the miRNeasy Mini Kit, and samples profiled on Agilent
SurePrint G3 Gene Expression Microarrays according to
the manufacturers’ protocols. Data were summarized and normalized with the vsn method [47] in the R statistical programming language [48] using the limma package
[49]. Linear regression analysis was performed to evaluate
differential temporal expression in ganglia from wildtype mice and ganglia and tumors from transgenic mice. Subcutaneous BE(2)-C xenograft tumor model in CB17-SCID mice
BE(2)-C cells were transfected for 24h with LacZ- or CD9-vectors in culture, then 2x 10⁶ viable
cells suspended in 200µl Matrigel (BD Biosciences) were subcutaneously implanted in the flanks of 6-week old female CB17-SCID mice (n = 12 per study group).
Animals were sacrificed 13 days after grafting. Tumor
size was measured daily with a caliper, and volume
calculated by π/6(w1×w2×w2), where w1 equals largest
tumor diameter, and w2 equals smallest tumor diameter. Experiments conformed to regulatory standards and were approved by the local ethics committee.
Data analysis
CD9 mRNA expression values were calculated
using existing whole-genome expression profiles from 476 primary neuroblastomas [21], and validated using whole-genome expression profiles from 122 further neuroblastomas [22]. Kaplan-Meier curves were generated for the 476 neuroblastoma cohort using the R
Survival package and compared using log-rank testing. The CD9 probesets with the highest average signal were selected for analysis. Relapse, progression and death from disease were considered events for calculation of event-free survival. Both overall and event-event-free survival were calculated from the time of diagnosis to death, event or last examination. Optimal cut-offs for overall and event-free survival analyses were calculated using the R Maxstat
package according to the method defined by Lausen and Schumacher [50] determining the expression value best
separating outcome into two groups using a maximally selected two-sample log-rank statistic. Optimal cut-offs
were 4774.47 (overall survival) and 5330.71 (event-free
survival). Results were corrected for multiple testing.
CD9 expression between two patient subgroups were
compared using the Mann-Whitney U test. Univariate
and multivariate analyses were performed for overall
and event-free survival using Cox proportional hazards regression models using SPSS (IBM, 20.0.0 release)
or R (version 3.0.1). The R2 platform (http://r2.amc.
nl) was used to generate Kaplan-Meier survival curves
and box plots of CD9 expression comparisons for the 122-neuroblastoma cohort [22]. CD9 gene methylation
status was derived from existing methyl-CpG-binding
domain sequencing data from 60 internationally collected
primary neuroblastoma samples [24, 25]. Single values
from cell culture experiments were compared using the one-sample t-test in GraphPad Prism version 5.0 (GraphPad Software Inc., La Jolla, CA). CD9 expression in cell groups transfected with either of two negative
controls or either of two HDAC-specific siRNAs were compared using a mixed linear model with fixed-factor
treatment and random intercept for each siRNA using SAS
PROC MIXED, Version 9.2 (SAS Institute Inc., Cary, NC, USA). Delta-Ct values were evaluated by a two-factorial
mixed linear model with interaction and random effect for each experimental run to assess potential synergistic
ACKNOWLEDGMENTS
We thank the German Neuroblastoma Tumor Bank (Cologne) for providing tumor samples, and the Imaging and Cytometry Core Facility of the DKFZ for their
valuable services.
CONFLICTS OF INTEREST
The authors disclosed no potential conflicts of
interest.
FINANCIAL SUPPORT
This work was supported by the BMBF through e:MED SYSMED-NB (M. Fischer, A. Eggert, J.H. Schulte, H.E. Deubzer) and e:MED SMOOSE (M.
Fischer, J.H. Schulte), by the Berlin Institute of Health (BIH) through TERMINATE-NB (A. Eggert, J.H.
Schulte, H.E. Deubzer) and a translational PhD project
grant (H.E. Deubzer), by the Deutsche Krebshilfe (M.
Lodrini, H. Allgayer, M. Fischer, H.E. Deubzer), by the
Wilhelm Sander-Stiftung (H. Allgayer, M. Zoeller), by the Kind-Philipp-Stiftung through doctoral scholarships (D.
Opitz, T.M. Thole) and by the DAAD through a graduate scholarship (J. Hu).
REFERENCES
1. Maris JM. Recent advances in neuroblastoma. New Engl J Med. 2010; 362:2202-2211.
2. Brodeur GM and Bagatell R. Mechanisms of neuroblastoma regression. Nat Rev Clin Oncol. 2014; 11:704-713. 3. Pinto NR, Applebaum MA, Volchenboum SL, Matthay
KK, London WB, Ambros PF, Nakagawara A, Berthold F, Schleiermacher G, Park JR, Valteau-Couanet D, Pearson AD and Cohn SL. Advances in risk classification and treatment strategies for neuroblastoma. J Clin Oncol 2015; 33:3008-3017.
4. Schwab M, Alitalo K, Klempnauer KH, Varmus HE, Bishop JM, Gilbert F, Brodeur G, Goldstein M and Trent J. Amplified DNA with limited homology to myc cellular oncogene is shared by human neuroblastoma cell lines and a neuroblastoma tumour. Nature. 1983; 305:245-248. 5. Brodeur GM, Seeger RC, Schwab M, Varmus HE and
Bishop JM. Amplification of N-myc in untreated human neuroblastomas correlates with advanced disease stage. Science. 1984; 224:1121-1124.
6. Peifer M, Hertwig F, Roels F, Dreidax D, Gartlgruber M, Menon R, Kramer A, Roncaioli JL, Sand F, Heuckmann JM, Ikram F, Schmidt R, Ackermann S, Engesser A, Kahlert Y, Vogel W, et al. Telomerase activation by genomic rearrangements in high-risk neuroblastoma. Nature. 2015; 526:700-704.
7. Valentijn LJ, Koster J, Zwijnenburg DA, Hasselt NE, van Sluis P, Volckmann R, van Noesel MM, George RE, Tytgat GA, Molenaar JJ and Versteeg R. TERT rearrangements are frequent in neuroblastoma and identify aggressive tumors. Nat Genet 2015; 47:1411-4.
8. Cheung NK, Zhang J, Lu C, Parker M, Bahrami A, Tickoo SK, Heguy A, Pappo AS, Federico S, Dalton J, Cheung IY, Ding L, Fulton R, Wang J, Chen X, Becksfort J, et al. Association of age at diagnosis and genetic mutations in patients with neuroblastoma. JAMA 2012; 307:1062-1071. 9. Pugh TJ, Morozova O, Attiyeh EF, Asgharzadeh S, Wei
JS, Auclair D, Carter SL, Cibulskis K, Hanna M, Kiezun A, Kim J, Lawrence MS, Lichenstein L, McKenna A, Pedamallu CS, Ramos AH, et al. The genetic landscape of high-risk neuroblastoma. Nature Genet 2013; 45:279-284. 10. Ambros IM, Brunner C, Abbasi R, Frech C and Ambros PF.
Ultra-High Density SNParray in Neuroblastoma Molecular Diagnostics. Front Oncol 2014; 4:202.
11. Mosse YP, Laudenslager M, Longo L, Cole KA, Wood A, Attiyeh EF, Laquaglia MJ, Sennett R, Lynch JE, Perri P, Laureys G, Speleman F, Kim C, Hou C, Hakonarson H, Torkamani A, et al. Identification of ALK as a major familial neuroblastoma predisposition gene. Nature 2008; 455:930-935.
12. Chen Y, Takita J, Choi YL, Kato M, Ohira M, Sanada M, Wang L, Soda M, Kikuchi A, Igarashi T, Nakagawara A, Hayashi Y, Mano H and Ogawa S. Oncogenic mutations of ALK kinase in neuroblastoma. Nature 2008; 455:971-974. 13. Janoueix-Lerosey I, Lequin D, Brugieres L, Ribeiro
A, de Pontual L, Combaret V, Raynal V, Puisieux A, Schleiermacher G, Pierron G, Valteau-Couanet D, Frebourg T, Michon J, Lyonnet S, Amiel J and Delattre O. Somatic and germline activating mutations of the ALK kinase receptor in neuroblastoma. Nature 2008; 455:967-970. 14. George RE, Sanda T, Hanna M, Frohling S, Luther W, 2nd,
Zhang J, Ahn Y, Zhou W, London WB, McGrady P, Xue L, Zozulya S, Gregor VE, Webb TR, Gray NS, Gilliland DG, et al. Activating mutations in ALK provide a therapeutic target in neuroblastoma. Nature 2008; 455:975-978. 15. Reyes R, Monjas A, Yanez-Mo M, Cardenes B, Morlino
G, Gilsanz A, Machado-Pineda Y, Lafuente E, Monk P, Sanchez-Madrid F and Cabanas C. Different states of integrin LFA-1 aggregation are controlled through its association with tetraspanin CD9. Biochim Biophys Acta 2015; 1853:2464-2480.
16. Odintsova E, Butters TD, Monti E, Sprong H, van Meer G and Berditchevski F. Gangliosides play an important role in the organization of CD82-enriched microdomains. Biochem J 2006; 400:315-325.
18. Uhlén M, Fagerberg L, Hallström BM, Lindskog C, Oksvold P, Mardinoglu A, Sivertsson A, Kampf C, Sjöstedt E, Asplund A, Olsson I, Edlund K, Lundberg E, Navani, Szigyarto CA, Odeberg J, et al. Proteomics. Tissue-based map of the human proteome. Science 2015; 347:1260419. 19. Fabian J, Lodrini M, Oehme I, Schier MC, Thole TM,
Hielscher T, Kopp-Schneider A, Opitz L, Capper D, von Deimling A, Wiegand I, Milde T, Mahlknecht U, Westermann F, Popanda O, Roels F, et al. GRHL1 acts as tumor suppressor in neuroblastoma and is negatively regulated by MYCN and HDAC3. Cancer Res 2014; 74:2604-2616.
20. Le Naour F, Prenant M, Francastel C, Rubinstein E, Uzan G and Boucheix C. Transcriptional regulation of the human CD9 gene: characterization of the 5’-flanking region. Oncogene 1996; 13:481-486.
21. Oberthuer A, Juraeva D, Li L, Kahlert Y, Westermann F, Eils R, Berthold F, Shi L, Wolfinger RD, Fischer M and Brors B. Comparison of performance of one-color and two-color gene-expression analyses in predicting clinical endpoints of neuroblastoma patients. Pharmacogenomics J 2010; 10:258-266.
22. Molenaar JJ, Koster J, Zwijnenburg DA, van Sluis P, Valentijn LJ, van der Ploeg I, Hamdi M, van Nes J, Westerman BA, van Arkel J, Ebus ME, Haneveld F, Lakeman A, Schild L, Molenaar P, Stroeken P, et al. Sequencing of neuroblastoma identifies chromothripsis and defects in neuritogenesis genes. Nature 2012; 483:589-593. 23. Oberthuer A, Hero B, Berthold F, Juraeva D, Faldum A,
Kahlert Y, Asgharzadeh S, Seeger R, Scaruffi P, Tonini GP, Janoueix-Lerosey I, Delattre O, Schleiermacher G, Vandesompele J, Vermeulen J, Speleman F, et al. Prognostic impact of gene expression-based classification for neuroblastoma. J Clin Oncol 2010; 28:3506-3515. 24. Decock A, Ongenaert M, Cannoodt R, Verniers K,
De Wilde B, Laureys G, Van Roy N, Berbegall AP, Bienertova-Vasku J, Bown N, Clement N, Combaret V, Haber M, Hoyoux C, Murray J, Noguera R, et al. Methyl-CpG-binding domain sequencing reveals a prognostic methylation signature in neuroblastoma. Oncotarget 2016; 7:1960-1972. doi: 10.18632/oncotarget.6477.
25. Decock A, Ongenaert M, Van Criekinge W, Speleman F and Vandesompele J. DNA methylation profiling of primary neuroblastoma tumors using methyl-CpG-binding domain sequencing. Sci Data 2016; 3:160004.
26. Hanahan D and Weinberg RA. Hallmarks of cancer: the next generation. Cell 2011; 144:646-674.
27. Tole S and Patterson PH. Distribution of CD9 in the developing and mature rat nervous system. Dev Dyn. 1993; 197:94-106.
28. Furuya M, Kato H, Nishimura N, Ishiwata I, Ikeda H, Ito R, Yoshiki T and Ishikura H. Down-regulation of CD9 in human ovarian carcinoma cell might contribute to peritoneal dissemination: morphologic alteration and reduced expression of beta1 integrin subsets. Cancer Res
2005; 65:2617-2625.
29. Mitsuzuka K, Handa K, Satoh M, Arai Y and Hakomori S. A specific microdomain (“glycosynapse 3”) controls phenotypic conversion and reversion of bladder cancer cells through GM3-mediated interaction of alpha3beta1 integrin with CD9. J Biol Chem 2005; 280:35545-35553.
30. Zoller M. Tetraspanins: push and pull in suppressing and promoting metastasis. Nat Rev Cancer. 2009; 9:40-55. 31. Sun Y, Liu PY, Scarlett CJ, Malyukova A, Liu B, Marshall
GM, MacKenzie KL, Biankin AV and Liu T. Histone deacetylase 5 blocks neuroblastoma cell differentiation by interacting with N-Myc. Oncogene 2014; 33:2987-2994. 32. Wang C, Liu Z, Woo CW, Li Z, Wang L, Wei JS, Marquez
VE, Bates SE, Jin Q, Khan J, Ge K and Thiele CJ. EZH2 mediates epigenetic silencing of neuroblastoma suppressor genes CASZ1, CLU, RUNX3, and NGFR. Cancer Res 2012; 72:315-324.
33. Frumm SM, Fan ZP, Ross KN, Duvall JR, Gupta S, VerPlank L, Suh BC, Holson E, Wagner FF, Smith WB, Paranal RM, Bassil CF, Qi J, Roti G, Kung AL, Bradner JE, et al. Selective HDAC1/HDAC2 inhibitors induce neuroblastoma differentiation. Chem Biol 2013; 20:713-725.
34. Marshall GM, Gherardi S, Xu N, Neiron Z, Trahair T, Scarlett CJ, Chang DK, Liu PY, Jankowski K, Iraci N, Haber M, Norris MD, Keating J, Sekyere E, Jonquieres G, Stossi F, et al. Transcriptional upregulation of histone deacetylase 2 promotes Myc-induced oncogenic effects. Oncogene 2010; 29:5957-5968.
35. Iraci N, Diolaiti D, Papa A, Porro A, Valli E, Gherardi S, Herold S, Eilers M, Bernardoni R, Della Valle G and Perini G. A SP1/MIZ1/MYCN repression complex recruits HDAC1 at the TRKA and p75NTR promoters and affects neuroblastoma malignancy by inhibiting the cell response to NGF. Cancer Res 2011; 71:404-412.
36. Lodrini M, Oehme I, Schroeder C, Milde T, Schier MC, Kopp-Schneider A, Schulte JH, Fischer M, De Preter K, Pattyn F, Castoldi M, Muckenthaler MU, Kulozik AE, Westermann F, Witt O and Deubzer HE. MYCN and HDAC2 cooperate to repress miR-183 signaling in neuroblastoma. Nucleic Acids Res 2013; 41:6018-6033. 37. Oehme I, Deubzer HE, Wegener D, Pickert D, Linke JP,
Hero B, Kopp-Schneider A, Westermann F, Ulrich SM, von Deimling A, Fischer M and Witt O. Histone deacetylase 8 in neuroblastoma tumorigenesis. Clin Cancer Res 2009; 15:91-99.
38. Oehme I, Linke JP, Bock BC, Milde T, Lodrini M, Hartenstein B, Wiegand I, Eckert C, Roth W, Kool M, Kaden S, Grone HJ, Schulte JH, Lindner S, Hamacher-Brady A, Hamacher-Brady NR, et al. Histone deacetylase 10 promotes autophagy-mediated cell survival. Proc Natl Acad Sci U S A 2013; 110:E2592-2601.
carcinomas. Inter J Cancer. 2013; 132:2200-2208.
40. Fischer M, Skowron M and Berthold F. Reliable transcript quantification by real-time reverse transcriptase-polymerase chain reaction in primary neuroblastoma using normalization to averaged expression levels of the control genes HPRT1 and SDHA. J Mol Diagn 2005; 7:89-96. 41. Deubzer HE, Ehemann V, Kulozik AE, Westermann F,
Savelyeva L, Kopp-Schneider A, Riester D, Schwab M and Witt O. Anti-neuroblastoma activity of Helminthosporium carbonum (HC)-toxin is superior to that of other differentiating compounds in vitro. Cancer Lett 2008; 264:21-28.
42. Liang XJ, Choi Y, Sackett DL and Park JK. Nitrosoureas inhibit the stathmin-mediated migration and invasion of malignant glioma cells. Cancer Res 2008; 68:5267-5272. 43. Scrace S, O’Neill E, Hammond EM and Pires IM. Use
of the xCELLigence system for real-time analysis of changes in cellular motility and adhesion in physiological conditions. Methods Mol Biol 2013; 1046:295-306. 44. Batzer MA and Deininger PL. A human-specific subfamily
of Alu sequences. Genomics 1991; 9:481-487.
45. van der Horst EH, Leupold JH, Schubbert R, Ullrich A and Allgayer H. TaqMan-based quantification of invasive cells in the chick embryo metastasis assay. Biotechniques 2004; 37:940-942, 944, 946.
46. Weiss WA, Aldape K, Mohapatra G, Feuerstein BG and Bishop JM. Targeted expression of MYCN causes neuroblastoma in transgenic mice. EMBO J 1997; 16:2985-2995.
47. Wu Z, Irizarry RA, Gentleman R, F.M M and Spencer F. A model-based background adjustment for oligonucleotide expression arrays. J Am Stat Assoc 2004; 99:909-917. 48. R: A language and environment for statistical computing.
R Foundation for Statistical Computing, Vienna, Austria 2013.
49. Smyth GK. Limma: linear models for microarray data. In: ‘Bioinformatics and Computational Biology Solutions using R and Bioconductor’. Springer, New York; 2005:397-420. 50. Lausen B and Schumacher M. Maximally selected rank