© 2018, IRJET | Impact Factor value: 7.211 | ISO 9001:2008 Certified Journal | Page 2763
Phytomonitoring System for Plant Growth Using Microcontroller and
Sensor Based Network.
Jivan L.Musale
1, Shrishail P. Swami
2,
1,2Lectuerer, Department of Electronics and Telecommunication & Bhagwant Institute of Technology Barshi ,
Solapur, India
---***---Abstract -
This paper describes how the Phytomonitoringsystem for plant growth gives a better solution to monitor plant growth cycle. It is one of the modern technology in agriculture which is been adopted by developed countries. It is also proved that precision agriculture is efficient, time saving and most promising technology. Some methodological aspects of the Phytomonitoring information and decision-support system, illustrated with practical examples. Phytomonitoring techniques have been proposed as an alternative to plant-based direct feedback control. They have been developed as the information and decision-support systems for human-aided control of crop growth. During last few years, the Phytomonitoring approach has demonstrated its effectiveness due to large-scale trial and commercial applications on many horticultural crops.
Key Words: Phytomonitoring, RISC, USART and wireless sensor network
1. INTRODUCTION
Water is life because human being, plants and animals cannot live without water. Water is needed to ensure food security, maintain organic life, take up industrial production, and feed livestock and to conserve the biodiversity and environment. India is not a water poor country but due to increasing population, water becomes scare commodity. 70% of the earth is covered with water. However 97.5% of total water is sea water so we cannot use it. So remaining 2.5% is fresh water availability. 40% of the fresh water can be used by human beings. Per capita water usages are given in table1. India comes under Asia continent so Asia is using 519 m3/yr. [1]
[image:1.595.313.531.231.403.2]Major consumption of water is in agriculture, domestic purpose and industries. The proportion of water usage varies from one country to other depends on environmental conditions, water availability, etc.
Table 1: Per Capita Water Use [1].
Continets Per Capita Water Use (m3/yr)
Africa 245
Asia 519
North and C. America
1861
South America 478
Europe 1280
USSR (Former) 713
Table 2: shows the water usage of different parts of the world. Developed countries are using less water in agriculture compare to developing countries. India is using 83% of total water in agriculture, 12% in industry and 5% in domestic uses. [1]
1.1Problem definition
Table 2: Current Water Usage [1]
The continuous ever increasing demand of the food requires the rapid improvement in the agriculture technology. In a country like India, where the weather conditions are isotropic and the economy is mainly based on agriculture, still we are not able to make full use of agricultural resources. The main reason is the method which our farmers are using is not efficient. By intuitions and experience our farmers observe the field directly and without knowing which parameters are lagging ,they use to take decision so the Usage (%) World Europe Africa India
Agriculture 69 33 88 83
Industry 23 54 5 12
[image:1.595.329.566.535.639.2]© 2018, IRJET | Impact Factor value: 7.211 | ISO 9001:2008 Certified Journal | Page 2764 results are less yield, soil erosion, increasing the infestation of
pests, diseases and weeds. So there is a necessity to change the method of farming. Precision agriculture is one of the most emerging, highly promising and spreading rapidly in developed countries .Phytomonitoring is a Precision agriculture method. Phytomonitoring is a real time method of observing different parameters of the plants so that relative decision can be taken. In this method specific sensors are used to detect parameters like soil moisture, soil temperature, fruit growth, stem diameter, etc. Using these sensors and wireless technology, we can get real time data of plants at data collection centre and based on that data we can do treatment to plants.
1.2Motivation
Farmers of India are using flow irrigation techniques through which they are wasting around 70% of the water. So instead of using flow irrigation if we use Phytomonitoring then there is large amount of water saving. Saved water can be use in other applications. So Phytomonitoring will help in irrigation as well as in final yield management.
1.3Project objective
The objective of this project is to make a working prototype of the Phytomonitoring system for plant growth using microcontroller and sensor based network and to demonstrate how beneficiary it is to agriculture sector for irrigation as well as crop management.
Objective of the project are as below :-
1. To design and implement prototype of Phytomonitoring system for plant growth using Microcontroller and sensor based network.
2. RF communication module is used for communication. In prototype only one node is been used for transmitting data.
3. Three sensors (soil moisture, soil temperature and air humidity) are interfaced with MSP430 Microcontrollers ADC pins.
4. DC motor is interfaced at receiving side which is controlled based on soil temperature and Soil humidity.
1.4Scope of the Project
Scope of the study includes
1. Direct real time observation of the plants. 2. No need to go to the farms as data is coming Wirelessly to data collection centre.
3. Better irrigation management.
4. Better yield.
5. Fully automated system which feed water to plants Whenever it need.
6. Water and energy saving.
2. BLOCK DIAGRAM OF PROPOSED SYSTEM Overview of existing plant monitoring techniques and also the proposed block diagram of Phytomonitoring system and protocol of operation used in the project. The main objective of this chapter is to give detail description of how efficiently Phytomonitoring system works.
2.1 Phytomonitoring System Working Principles
Phytomonitoring technique has been proposed as an alternative to plant-based direct feedback control. It has been developed as the information and decision-support systems for human-aided control of crop growth. Using some plant specific sensors and wireless technology, data are transmitted from field to data collection centre where those data are displayed and based on the data decisions are taken. Based on data automatic irrigation can be scheduled.
2.2Existing Plant Monitoring Techniques
[image:2.595.321.544.592.713.2]As shown in the below figure 2.1 typical system of farming is using intuitions and experience. Indian farmers are using this techniques since last many decades. In this style they use to go to farm and use to do direct observation of the field so instead of knowing what actually plants need , which parameter is lagging they take decision based on knowledge and intuitions so results are less yield, soil erosion ,huge wastage of water , weed, etc. As well as these techniques are slow and expensive even time consuming too. So time they use to send sample of the soil to the laboratory for analysis. But after all these techniques are not efficient. It takes more men power, more water and result is less yield. So there is a need for adoption of modern technology in agriculture.
© 2018, IRJET | Impact Factor value: 7.211 | ISO 9001:2008 Certified Journal | Page 2765 2.3 Phytomonitoring System And Recommended
Set up
As shown in the figure 2.2 Phytomonitoring system consist of sensors, wireless technology for communication, data collection centre and display. Sensors are particular for measuring specific plant parameters like soil moisture, soil temperature, fruit growth sensor, leaf temperature sensor. For wireless communication there are so many protocols such as RF, ZigBee, Bluetooth, infrared.
[image:3.595.313.517.161.354.2]
Fig. 2.2: Phytomonitoring system.
Fig. 2.3: Recommended set up.
Above figure 2.3 explains the recommended set for Phytomonitoring system. So for measuring various parameters of the plant such as air temperature, air humidity, wind speed meter (optional), Round fruit growth, trunk
diameter and soil moisture sensors are used. And using RF transceiver data are send to data concentrator centre and data are displayed on the screen.
[image:3.595.52.269.249.439.2]2.4 Block Diagram 1. Transmitter
Fig. 2.4: Transmitter.
Transmitter part consists of soil moisture sensor, soil temperature sensor and air humidity sensor as these are the basic parameter which affects the plant growth. These sensors are connected to MSP430F1611 microcontroller. Through SPI interface microcontroller is connected to RF transceiver module. So for each 2 second transmitter will send data to receiver.
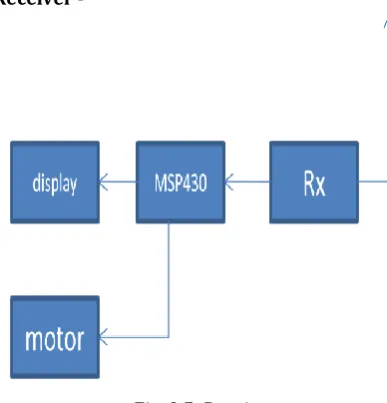
1. Receiver -
Fig. 2.5: Receiver.
[image:3.595.51.269.480.668.2] [image:3.595.330.524.504.706.2]© 2018, IRJET | Impact Factor value: 7.211 | ISO 9001:2008 Certified Journal | Page 2766 connected to microcontroller. Motor is control through soil
humidity and soil temperature.
2.4 Benefits of Phytomonitoring system
Reduced Inspection Outage Frequency.
Reduced Forced Outage Frequency.
Reduced Spillage of Water.
Reduced Maintenance Hours.
Reduced man power.
High yield.
2. SYSTEM IMPLEMENTATION
3.1 Hardware Architecture
The Phtomonitoring system can be divided into five parts; these five parts are sensor based network (SBN), MSP430 based embedded system (MES), wireless communication module (WCM), Graphical display unit (GDU), relay control unit (RCU). The hardware description of five parts are introduced as follows.
Sensor based Network (SBN)
Sensor based unit consists a network sensors these sensors are soil humidity sensor, soil moisture sensor and air humidity sensor. These all sensors are giving analog voltage and give output in range of 0 to 3.3 V. So they are compatible with MSP430 microcontroller because MSP430 works on 3.3V. Moreover these sensors are also linear sensors so accuracy is guaranteed.
MSP430-based Embedded System (MES)
MSP430 is the heart of the whole system because it controls the whole system. Sensor based unit will give data to controller. It is controller’s duty to convert those data to Digital and give it to RF transceiver module. From there data will be transmitted.
Wireless Communication Module (WCM)
For wireless transmission and reception nRF24L01 module is used. It is interfaced with micro controller using SPI interface. As we know SPI is a synchronous peripheral interface so clock system is very important in sending data. It can send data at 1 or 2 Mbps.
Graphical Display Unit (GDU)
This unit will display all the parameters which are coming from transmitter. Basically LCD is NOKIA 6100 .It has 132x132 pixels and it is connected to microcontroller
through SPI interface. Here LCD will be as slave as it is not sending data to controller.
Relay Control Unit (RCU)
This unit will control the DC motor. Relay works on 5V DC supply. It is connected with BC547 transistor which works as a switch so when output of the controller is high, transistor will be on so ultimately relay will be on and motor will be on.
3.2 Project Phases
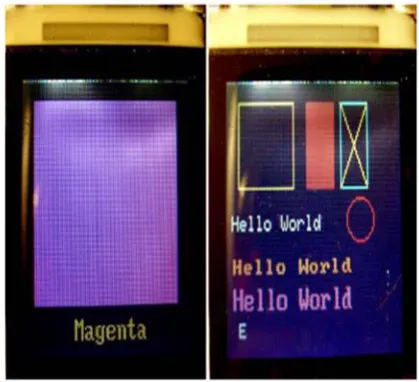
[image:4.595.314.523.246.411.2]1. Interfacing LCD with MSP430
Fig. 3.1: Interfacing LCD with MSP430.
Fig. 3.2: Display results.
[image:4.595.327.537.453.644.2]© 2018, IRJET | Impact Factor value: 7.211 | ISO 9001:2008 Certified Journal | Page 2767 connected with LCD those are reset , MOSI, clock, chip
enable. Results are shown in the below figure 3.2.
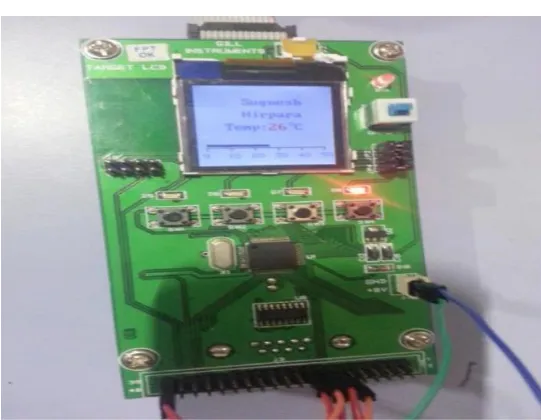
3.3. Internal temperature monitoring
As shown in the ADC12 block diagram MSP430 has total 8 external ADC channel, 4 channels for internal reference and one internal temperature sensor. We can configure this sensor and can be used as a reference. Internal temperature sensor is connected at channel no 10. It is using 2.5 V for reference. Data is stored in the ADC memory from there it is copied to variable and then using LCD display function it is displayed on the LCD. Result is shown in the below figure.3.4
[image:5.595.308.579.90.300.2]
Fig. 3.3: ADC12 block diagram.
Fig. 3.4: LCD result.
3.4. Basic Receiver –Transmitter operation
[image:5.595.64.563.343.701.2]© 2018, IRJET | Impact Factor value: 7.211 | ISO 9001:2008 Certified Journal | Page 2768
(b)
Fig. 3.5 (a and b): Basic Rx -Tx operation.
As shown in the above figure 3.5. Basic Rx-Tx operation is a simple way to check communication between transmitter and receiver. Basically from transmitter side using switch as an interrupt known data is send and at the receiver and those known data is decoded and based on that action is taken. So here from transmitter s two known values 0xab and 0xcd are send. At the receiver end based on the data blinking the LEDs is performed means if data is 0xab then only one LED should blink and if data is 0xcd all LED should blink. Result are shown in the figure. In first figure only one LED is blinking while in the second figure all LEDs are blinking.
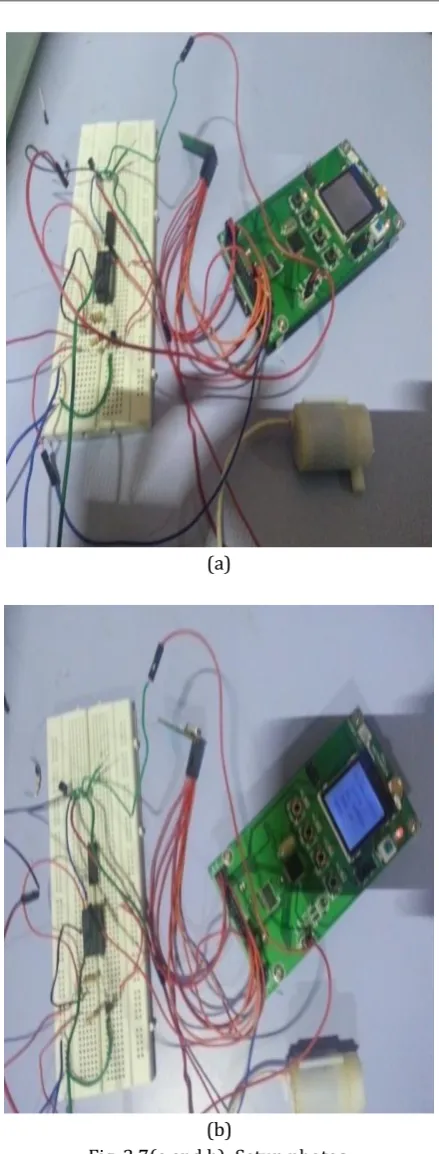
[image:6.595.324.544.82.660.2]3.5 Motor control through temperature sensor
Fig. 3.6: Motor control through temperature sensor.
(a)
(b)
Fig. 3.7(a and b): Setup photos.
[image:6.595.42.283.97.309.2] [image:6.595.41.266.525.694.2]© 2018, IRJET | Impact Factor value: 7.211 | ISO 9001:2008 Certified Journal | Page 2769 Pin 1.0 is output pin where BC548 transistor is connected
which is working as a switch. With transistor relay is connected and then relay and DC motor. Temperature is the parameter which is controlling the motor. So when temperature goes above 40 degree, motor should turn ON. And on the display it should show that motor is ON and respective LED should glow. Temperature sensor is giving analog voltage so first it has to be converted to digital so using ADC it is converted to digital. Here calibration is necessary so as given in the datasheet it is done. Here MSP430 microcontroller is used as a master and LCD is used as a slave. Set up is shown in the figure.
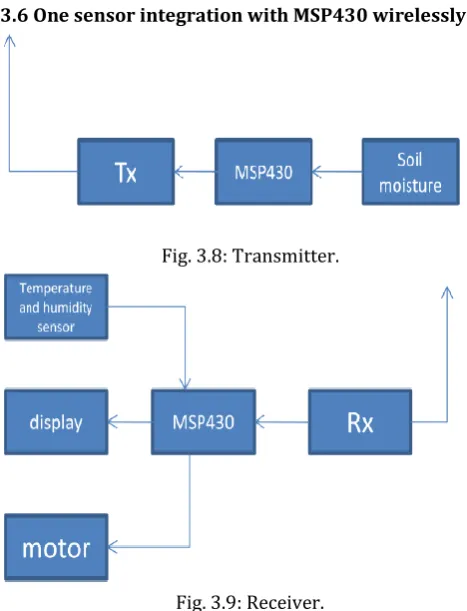
3.6 One sensor integration with MSP430 wirelessly
[image:7.595.36.270.272.578.2]Fig. 3.8: Transmitter.
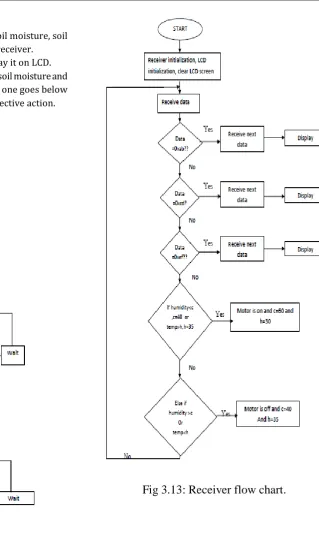
Fig. 3.9: Receiver.
As shown fig.3.8 in the transmitter part one sensor is integrated with the system. Only one parameter is measured that is soil moisture. nRF24L01 is used to transmit data. Transceiver module is connected to MSP430 through SPI interface. Soil moisture sensor is connected to ADC pin of μc. Receiver part consist of receiving module, μc, two sensors, sensors and DC motor. Two sensors are air temperature sensor and air humidity sensor which are connected to ADC pins of μc. LCD is connected through SPI interface .Rx module is also connected through SPI interface. As an output motor is connected
Operation -
Transmitter is continuously transmitting soil moisture data to receiver.
At receiver using multiple ADC conversion data is displayed on the LCD.
Same time data which is coming from transmitter is also displaying on the LCD.
Microcontroller is continuously monitoring moisture content.
If it goes below 40% it will give high (3.3 V) to the transistor (BC548).
So transistor will be on and it will give 5V to relay so relay will be on and ultimately motor will be ON.
When moisture goes above 60% motor will be OFF.
Continuously this process is repeated.
3.7 Final Setup –all sensors embedding to gather
As shown fig.3.10 in the transmitter part of the final set up, all three sensors are connected wirelessly. Those sensors are soil moisture, soil temperature and air humidity sensor. Soil temperature is used as an offset to soil moisture. As explained before there is a chance of false reading from moisture sensor as temperature varies so for more accuracy soil temperature sensor is connected. Program is written in such way that transmitter will transmit data after every two second. At the receiver end only monitoring of data and Decision making is happen. Data which are coming from transmitter is displayed on the LCD and based on data decision is taken. Motor is driven based soil moisture and soil
[image:7.595.314.532.521.628.2]temperature.
Fig. 3.10: Final system block diagram –transmitter.
© 2018, IRJET | Impact Factor value: 7.211 | ISO 9001:2008 Certified Journal | Page 2770 Operation -
Transmitter is continuously sending soil moisture, soil temperature and air humidity data to receiver.
Receiver will receive all data and display it on LCD.
Receiver continuously monitor data of soil moisture and soil temperature simultaneously if any one goes below /above set values then it will take respective action.
3.8 Flow Chart
[image:8.595.219.539.82.642.2]Fig.3.12: Transmitter flow chart.
© 2018, IRJET | Impact Factor value: 7.211 | ISO 9001:2008 Certified Journal | Page 2771 4. RESULTS AND DISCUSSION
4.1 Experiments Planned and Carried Out
Using the microcontroller based hardware and sensors, different experiments are planned to access the soil conditions for the growth of the plant. Carried out experiments are
1. At first black soil was considered and soil moisture and temperature sensors were dipped Inside the black soil and parameters such as soil temperature, soil humidity were measured for a duration of 10 hours and observed the variations in the parameters values.
2. Second time red soil was considered and measured soil parameters such as soil temperature, soil humidity for 10 hours and observed the difference in the parameters values.
3. Third time yellow soil was considers and measured soil parameters like soil temperature, soil Humidity for 10 hours and observed the difference in the parameters values.
4.2 Test Setup for Phtomonitoring System
[image:9.595.324.545.94.259.2]Figure 4.1 shows the final test set up for the real time experiment. In figure Soil temperature sensor, soil temperature sensor,WSN node, air humidity sensor,LCD display,LCD target board, transceiver module, relay, Dc motor are shown. Motor was kept inside container for convenience. Time delay between each data is 2 second. For action of motor two parameters are considered those are soil temperature and soil humidity.
[image:9.595.327.556.327.465.2]
Fig. 4.1: Test setup
.
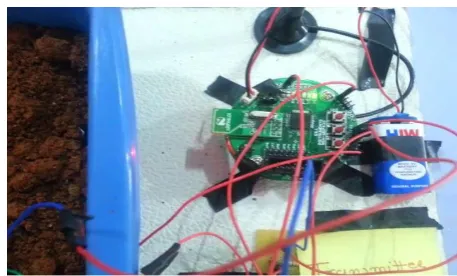
Fig.4.2: Soil with moisture and temperature sensor.
Above figure shows 4.2 soil moisture and soil temperature sensor inserted inside the soil.
[image:9.595.336.532.548.744.2]
Fig. 4.3: Transmitter.
Above figure 4.3 shows transmitter part. Transmitter is sending data after each 2 second and also LED is blinking. all sensors are connected with transmitter.
[image:9.595.54.271.556.722.2]© 2018, IRJET | Impact Factor value: 7.211 | ISO 9001:2008 Certified Journal | Page 2772 As shown in the above figure 4.4. LCD target board shows
[image:10.595.50.272.177.369.2]parameters like soil, temp and humidity, also it is showing the status of the motor .so in current figure soil moisture is 86%, soil temperature is 24 degree and air humidity is 39%. Data are above the threshold condition so motor is OFF.
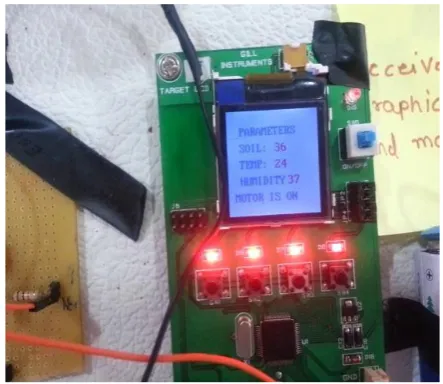
Fig. 4.5: Display showing motor status.
Fig. 4.6: Motor pumping water.
Above figure 4.5 shows that soil moisture is 36% which below the set condition so motor is ON and all LEDs are also ON.
Above figure 4.6 shows that motor is on and it is pumping water. Here for convenience motor is kept inside a container.
4.3 Analysis
[image:10.595.324.544.261.338.2]From the results we can see that when the temperature of the soil goes above 35 degree and humidity of the soil goes below 40%, motor start pumping water and as a feedback microcontroller continuously check those parameters. So when temperature goes below 300 C and moisture goes above 60%, motor will be turn OFF. Below table shows some results which are taken during the experiment.
[image:10.595.317.552.389.465.2]Table 4.1 Experiment result1.
Table 4.2 Experiment result2.
Table 4.2 shows that when soil humidity sensor starts giving false reading through temperature sensor irrigation can be control.
5.CONCLUSION AND FUTUTE WORK.
Conclusion -
[image:10.595.55.271.401.629.2]© 2018, IRJET | Impact Factor value: 7.211 | ISO 9001:2008 Certified Journal | Page 2773 So development of Phytomonitoring system gives
precision water-saving irrigation system which helps in better growth of crop and better yield too.
Future work –
Our future work experimental program includes the plans about connecting more plant specific sensor at transmitter end such as fruit growth sensor, trunk diameter sensor, leaf temperature sensor.
Also to cover whole field more than one WSN is necessary. Based on soil property and The size of the field it can be decided. So to connect more than one WSN and to cover whole field will be the future direction of development.
Figure 5.1 shows how remotely data can be access and remotely action can be taken. Here multiple WSN is connected with In Field deployed Cluster Head (CH) which is nothing but a Gateway. This gateway is link between acquisition area and the farm operation center.
Fig. 5.1 accessing public and private data through in-field cluster-head, as a sink node for wireless sensor network
data and as a public service provider. [18]
The main functions of the Gateway/CH are: sensor network coordination. It describes how the sensor network is intended to work (e.g. define when to capture data such as temperature, image acquisition) as well how the network must behave (reactive or pro-active) when a set of factors are presented (e.g. send an order to an irrigation management system if a humidity parameter is low). As second objective, the Gateway must be able to report relevant information to the office management level, enabling the farmer to manage the daily work as well as to plan future activities. The last function is to support a query
system, for the farmer on PV practices, but also as a public data access gateway. As an example, even when the farmer is working on the field, he can check Gateway stored data and he can also send data to the Gateway using a mobile device. To achieve this, the Gateway needs to support multi wireless communication protocols such as Bluetooth (for short range) and WI-FI for larger range. This can also be used as an access point for tourist’s access to information and services supported by the farm, or simply for accessing public services platforms [18].
For long distance transmission GSM based communication has shown excellent performance at any condition. Even by connecting GSM module with system gives more information about what is happening in the field at any place. So Interfacing of GSM module adds more value in remote login and control.
REFERENCES
1) Water Scarcity And Security In INDIA by Dr. Narayan G. Hegde ,February 2012.
2) Phytomonitoring information and decision-support system for crop growing , Yuri Ton and Michael Kopyt, Proc. 2-nd ISIITA,Beijing, 2003
3) MSP430 1xx family user guide- Texas Instruments
4) Precision agriculture/a worldwide overview by Naiqian Zhang , Maohua Wang , Ning Wang Published by Elsevier Science B.V.
5) Wireless Sensor Networks for precision horticulture in Southern Spain by J.A. López Riquelmea, F. Sotoa, J. Suardíaza, P. Sáncheza, A. Iborraa, J.A. Verab, 21 April 2009, Published by Elsevier Science B.V.
6) Wireless sensor networks in precision agriculture by Aline Baggio Delft University ofTechnology –The Netherlands.
7) Wireless sensors in agriculture and food industry— Recent development and future Perspective by Ning Wang , Naiqian Zhang , Maohua Wang , 21 September 2005.
[image:11.595.45.278.382.565.2]© 2018, IRJET | Impact Factor value: 7.211 | ISO 9001:2008 Certified Journal | Page 2774 9) Practical deployment of an in-field soil property wireless
sensor network by Zhen Li , Ning Wang, Aaron Franzen , Peyman Taher , Chad Godsey , Hailin Zhang , Xiaolin Li , 2011 Elsevier B.V.
10) Autonomous precision agriculture through integration of wireless underground sensorNetworks with center pivot irrigation systems by Xin Dong , Mehmet C. Vuran a, Suat Irmak , 25 June 2012
11) Application of wireless sensor networks for greenhouse parameter control in precisionAgriculture D.D.Chaudhary, S.P.Nayse, L.M.Waghmare, International Journal of Wireless & Mobile Networks (IJWMN) Vol. 3, No. 1, February 2011.
12) An Efficient Wireless Sensor Network for Precision Agriculture by Manijeh Keshtgary, Amene Deljoo, Canadian Journal on Multimedia and Wireless Networks, Vol. 3, No. 1, January 2012.
13) Channel model and analysis for wireless underground sensor networks in soil medium by Mehmet C. Vurana, Ian F. Akyildiz , © 2010 Elsevier B.V.
14) Silage Yield Monitoring System, Won Suk Lee, Thomas F. Burks, John K. Schueller, July 28-July 31, 2002.
15) Simulation of Greenhouse Climate Monitoring and Control with Wireless Sensor Network And Event-Based Control Andrzej Pawlowski, Jose Luis Guzman, Francisco Rodríguez 1, Manuel Berenguel, José Sánchez and Sebastián Dormido , 8 January 2009.
16) Vineyard Computing: Sensor Networks in Agricultural Production by Jenna Burrell,TimBrooke,andRichard Beckwith Intel Research, Published by the IEEE CS and IEEE ComSoc, © 2004 IEEE.
17) A new 1.4-GHz soil moisture sensor by Masoud Rezaei , Emad Ebrahimi , Sasan Naseh , Mehdi Mohajerpour , 21 April 2012.
18) Enhancing Tourism through Viticulture Enterprises in Douro Region: The Inov@Douro Model by Carlos Filipe Campos Rompante da Cunha, Emanuel Soares Peres Correia, Raul Manuel Pereira Morais dos Santos, and Manuel José Cabral dos Santos Reis.
19) MSP430 Microcontroller Basics - John H. Davies.
List of references websites:
http://e2e.ti.com
http://www.ti.com
http://www.engineersgarage.com
http://gardenbot.org
http://www.instructables.com/id/msp430-Launchpad-Projects/
http://www.edaboard.com/
http://www.ti.com/product/msp430f1611
![Table 1: Per Capita Water Use [1].](https://thumb-us.123doks.com/thumbv2/123dok_us/8128835.796339/1.595.329.566.535.639/table-per-capita-water-use.webp)