Adaptive Sigmoid Function to Enhance Low
Contrast Images
Saruchi
M.Tech(CE),University College of Engineering, Punjabi University, Patiala(Pb.)
ABSTRACT
Image enhancement is one of the most important issues in low-level image processing. Mainly, enhancement methods can be classified into two classes: global and local methods. Various enhancement schemes are used for enhancing an image which includes gray scale manipulation, filtering and Histogram Equalization (HE).Histogram Equalization (HE) has proved to be a simple and effective image contrast enhancement technique. In this paper, the global histogram equalization is improved by using sigmoid function combined with local enhancement statistics. Experimental results demonstrate that the proposed method can enhance the images effectively. The performances of the existing techniques and the proposed method are evaluated in terms of SNR, PSNR, CoC.
Keywords-
contrast enhancement, sigmoid function, Histogram Equalization, image processing1. INTRODUCTION
Image enhancement processes consist of a collection of techniques that seek to improve the visual appearance of an image that is better suited for analysis by a human or machine[6]. The term image enhancement also mean as the improvement of an image appearance by increasing dominance of some features or by decreasing ambiguity between different regions of the image [7]. Most of the contrast enhancement methods can be classified into two main categories: intensity-based techniques and feature-intensity-based techniques. Intensity-intensity-based methods can be expressed by the form
I0(x, y) = f (I (x, y)) (1)
where I (x, y) is the original image, I0(x, y) is the output image after enhancement, and f is a transformation function. In these methods, a transformation of the image gray levels is applied to the whole image such that the pixels with the same gray level at different places of the original image are still kept the same in the processed image. Contrast stretching is the most representative and the simplest method in this category [2]. Another very popular method is histogram equalization [4]. This method assumes the information carried by an image is related to the probability of the occurrence of each gray level. To maximize the information, the transformation function should redistribute the probabilities of gray level occurrences to be uniform. In this way, the contrast at each gray level is proportional to the height of the image histogram. The basic idea of feature-based methods is to enhance the small-scale components, which represent some specified features, of an image and these methods can be expressed as
Io(x, y) = L1 (x, y) +G(x, y)H1 (x, y) (2)
where L1 represents the low frequency components which keep the basic appearance of the original image, H1 represents the high frequency components which contain the concerned
features, and G is the enhancement gain. Feature-based contrast enhancement can be done in spatial domain or frequency domain [2]. Intensity-based methods are global enhancement methods. They can enhance the overall visibility of an image, but may not increase, or even decrease, the local contrast at some local positions in the image. Then a lot of detailed information of the image may be ignored. For example, if an image has a dark region and a bright region both with some objects inside, it is hard to simultaneously enhance the contrast in both regions by one transformation. The human visual system can adaptively set the gain to this situation. To simulate this characteristic, local intensity-based contrast enhancement methods are used to deal with such problems[1]. Histogram equalization was also extended to adaptive (or local) histogram equalization (AHE or LHE) [8-10]. For each pixel, as the center, a window was set to calculate its local histogram. Then histogram equalization was applied to the local histogram to obtain the gray level transformation for the centric pixel. While adaptive histogram equalization and its variations are very useful to enhance the details contrasting in local areas of an image, they share a common shortcoming with the feature based methods—the pixels with the same gray level in the original image may be different and the gray level order may even reverse at different places after enhancement. These effects destroy theappearance of the original image and make the image appear very noisy[1]. In this paper, we will propose a new method,which preserves the appearance of the image with simultaneous enhancement of contrast of the image locally. The proposed technique holds two steps.The first step of algorithm implementation is to apply Histogram Equalization contrast enhancement technique to improve the low contrast image.Then the second step is to improve the contrast of the histogram equalized image by applying adaptive sigmoidal mapping function and thereby overcoming the annoying artifacts such as unnatural enhancement in image,that are produced by global HE technique.
2. HISTOGRAM EQUALIZATION
normally changes the brightness of the image significantly, and thus makes the output image becomes saturated with very bright or dark intensity values. Hence, brightness preserving is an important characteristic needed to be considered in order to enhance the image for consumer electronic products [11].
3. SIGMOID FUNCTION
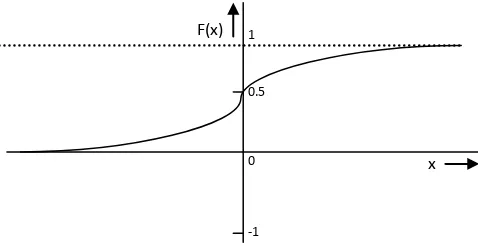
Sigmoid function is a continuous nonlinear activation function. The name, sigmoid, obtained from the fact that the function is "S" shaped. Statisticians call this function the logistic function, Using f (x) for input, and with a as a gain term, the sigmoid function is:
( )
(
)
[image:2.595.49.288.312.435.2]The sigmoid function has the characteristics that it is a smooth continuous function, the function outputs within the range 0 to 1, mathematically the function is easy to deal with; it goes up smoothly and kindly. For better details about this function, refer to [14].
Figure 1: Sigmoid Function
4. PROPOSED ALGORITHM
IMPLEMENTATION
The steps of our enhancement technique is as following:
4.1
Histogram Equalization step:
For a given image X, the probability density function (Xk) isdefined as
(
)
(1)For k = 0, 1, …, L – 1, where nk represents the number of times that the level Xk appears in the input image X and n is the total number of samples in the input image. Note that P(Xk) is associated with the histogram of the input image which represents the number of pixels that have a specific intensity Xk. In fact, a plot of nk vs. Xk is known histogram of X. Based on the probability density function, the cumulative density function is defined as
(
) ∑
(
)
(2) where Xk = x, for k = 0, 1, …, L – 1.Note that C(XL-1) = 1 by definition. HE is a scheme that maps
the input image into the entire dynamic range, (X0, XL-1), by
using the cumulative density function as a transform function. Let’s define a transform function f(x) based on the cumulative density function as
( )
(
) (
)
(3)Then the output image of the HE, Y = {Y(i, j)}, can be expressed as
( )
(4)( ( )| ( )
} (5)The high performance of the HE in enhancing the contrast of an image as a consequence of the dynamic range expansion. As addressed previously, HE can introduce a significant change in brightness of an image, which hesitates the direct application of HE scheme in consumer electronics[13].
4.2
Adaptive sigmoidal function step:
It is a point process approach that is performed directly on each pixel of an image,independent of all other pixels in the image to change the dynamic range.In this the mask that is applied to the target images is a non-linear activation function, which is called sigmoid function multiplied by input itself and by a factor. We used that factor to determine the most wanted degree of the contrast depending on the degree of darkness or brightness of the original image[15]. For a grey scale images, a sliding 3x3 map window moves from the left side to the right side of original image horizontally in steps starting from the image’s upper right corner[3]. A pixel value in the enhanced window dependents only on its value that means if the variance of window pixels is less than variance of the image and greater than k1 times the global variance then the value of pixel under consideration is remapped and if the interest pixel does not satisfy the condition its value remains unchanged.The constant k1 sets the lower limit of contrast. The process can be described with the mapping function O =M (i), where O and i are the new and old pixel values,respectively[3]. The form of the mapping function M that determines the effect of the operation is:(
)
(6)According to above mapping function the new value of corresponding pixel will be:
( ) {
( )
(7)
Where c is a contrast factor determines the degree of the needed contrast. The value of c depends on the objective of the enhancement process,the user can select the value of c according to desired contrast that he needs.The pixel values are within a limited range (0-255) for an 8-bit image.The results usually needs to be clipped to the maximum and minimum allowable pixel values so that all highest components turn out to be 255 and lowest values to 0.After map window reaches the right side, it returns to the left side and moves down a step. The process is repeated until the sliding window reaches the right-bottom corner of the image[15].
5. PERFORMANCE EVALUATION
Performance evaluation of this algorithm is conducted on several low contrast images. Four low contrast images have
F(x)
x
-1 0 1
been taken as input for evaluating this proposed algorithm[17]. Visual results have been displayed and quantitative comparison has been done on the basis of (a) signal-to-noise ratio (b) peak signal-to-noise ratio (c) Coefficient of Correlation (d) structure similarity index. Results for the proposed algorithm are hereby compared against the HE(histogram Equalization) & Sigmoid fused with HE algorithms on the basis of mentioned quality metrics.
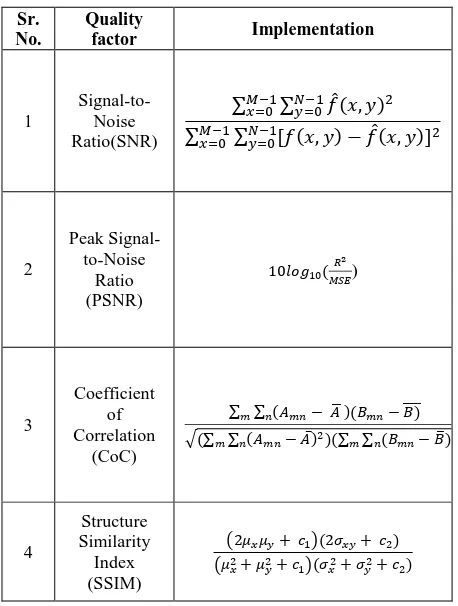
Table 1: Mathematical Formulas For Quality Factors
Sr. No.
Quality
factor Implementation
1
Signal-to-Noise Ratio(SNR)
∑ ∑ ̂( )
∑ ∑ ( ) ̂( )
2
Peak Signal-to-Noise
Ratio (PSNR)
( )
3
Coefficient of Correlation
(CoC)
∑ ∑ ( ̅ )( )̅̅̅̅ √(∑ ∑ ( ̅) )(∑ ∑ ( ̅))
4
Structure Similarity Index (SSIM)
( )( ) ( )( )
In SNR here,
̂
is the enhanced image and f is the original image [16] and higher value is always desired for SNR.The PSNR computes the peak signal-to-noise ratio, in decibels, between two images. This ratio is often used as a quality measurement between the original and an enhanced image. The higher the PSNR, the better the quality of the enhanced image.CoC computes the correlation coefficient between A and B, where A and B are matrices or vectors of the same size. SSIM is a method for measuring the similarity between two images.Its value between -1 and 1.6. RESULTS AND DISCUSSION
The test images have been enhanced using proposed algorithm, HE & Sigmoid fused with HE. These mentioned enhancement techniques produced following results for the below considered images:
In visual analysis it is observed that contrast has been enhanced to various levels by all the algorithms but the proposed algorithm is enhancing the image more precisely in comparison to HE and Sigmoid fused with HE. The human visualization is not considered as benchmark for image quality, so to evaluate the performance of above mentioned algorithms quality metrics have been calculated for the output images. Values for SNR, PSNR, CoC, SSIM have been calculated for the resultant images in comparison to the original image.
Table 2 Is Displaying Metric Values For The Visual Results Obtained In Figure 2 .
Algorithm Quality Parameters
HE Sigmoid Proposed
Algorithm
SNR 14.7529 13.6600 18.8490
PSNR 19.4859 19.3077 24.4972
CoC 0.9932 0.9170 1.0000
[image:3.595.306.545.232.572.2]SSIM 0.9108 0.6899 0.9367
Table 3 Is Displaying Metric Values For The Visual Results Obtained In Figure 3 .
Algorithm Quality Parameters
HE Sigmoid Proposed
Algorithm
SNR 10.5994 3.7744 11.6770
PSNR 15.2929 9.4055 17.3053
CoC 0.9377 0.2912 0.9910
SSIM 0.8599 0.1420 0.8868
Figure 2(Clockwise): 2a. Original Image 2b. Image Enhanced Through Proposed Method 2c. Enhanced Through Sigmoid Fused With He 2d. Enhanced Through
Figure3(Clockwise): 3a.Original Image 3b.Image Enhanced Through Proposed Method 3c. Enhanced Through Sigmoid
Fused With He 3d. Enhanced Through He
Figure 4(Clockwise): 4a. Original Image 4b. Image Enhanced Through Proposed Method 4c. Enhanced Through Sigmoid Fused With He 4d. Enhanced Through
[image:4.595.59.276.78.365.2]He
Table 4 Is Displaying Metric Values For The Visual Results Obtained In Figure 4 .
Algorithm Quality Parameters
HE Sigmoid Proposed
Algorithm
SNR 9.5603 9.6346 10.1799
PSNR 14.2634 15.2645 15.8202
CoC 0.9625 0.8880 0.9898
[image:4.595.309.545.208.573.2]SSIM 0.6643 0.6102 0.6979
Table 5 Is Displaying Metric Values For The Visual Results Obtained In Figure 5 .
Algorithm Quality Parameters
HE Sigmoid Proposed
Algorithm
SNR 8.8225 9.4508 9.6289
PSNR 13.4736 15.0385 15.2159
CoC 0.9783 0.9443 0.9900
SSIM 0.5608 0.5105 0.6066
Figure 5(Clockwise): 5a. Original Image 5b. Image Enhanced Through Proposed Method 5c. Enhanced Through Sigmoid Fused With He 5d. Enhanced Through
He.
7. CONCLUSION
images after applying the new proposed contrast enhancer on both dark, grey scale images were satisfactory.
8. FUTURE SCOPE
The proposed method can be extended to coloured images in future and new parameters can be included to test performances of algorithm.As contrast enhancement techniques also enhance noise, some denoising technique may also be included in the algorithm to improve the high noise images.
9. REFERENCES
[1] Hui Zhu, Francis H. Y. Chan, and F. K. Lam,” Image Contrast Enhancement by Constrained Local Histogram Equalization”, Computer Vision and Image Understanding ,Vol. 73, No. 2, February, pp. 281–290, 1999.
[2] R. C. Gonzalez and R. E. Woods,” Digital Image Processing”, 3rd edition, Prentice Hall, 2009.
[3] Naglaa Yehya Hassan and Norio Aakamatsu ,”Contrast Enhancement Technique of Dark Blurred Image”, IJCSNS International Journal of Computer Science and Network Security, VOL.6 No.2A, February,pp. 223-226,2006. [4] E. H. Hall, Almost uniform distribution for computer
image enhancement, IEEE Trans. Comput. 23(2), 1974, 207–208.
[5] S.Annadurai and R.Shanmugalakshmi, ”Fundamentals of Digital Image Processing”,Pearson,2007.
[6] William K.Pratt(2007), Digital Image Processing , Los Altos, California.
[7] Bhabatosh Chanda and Dwijest Dutta Majumder, 2002, Digital Image Processing and Analysis.
[8] D. J.Ketchum, Real-time image enhancement techniques, Proc. SPIE/OSA, 1976, 120–125.
[9] R. A. Hummel, Image enhancement by histogram transformation, Computer Graphics Image Process. 6, 1977, 184–195.
[10] S. M. Pizer, E. P. Amburn, J. D. Austin, R. Cromartie, A. Geselowitz, T. Greer, B. H. Romeny, J. B. Zimmerman, and K. Zuiderveld, Adaptive histogram equalization and its variations, Comput. Vision Graphics Image Process. 39, 1987, 355–368.
[11] J. Zimmerman, S. Pizer, E. Staab, E. Perry, W. McCartney, B. Brenton, “Evaluation of the effectiveness of adaptive histogram equalization for contrast enhancement,” IEEE Tr. on Medical Imaging, pp. 304-312, Dec. 1988.
[12] S. Lau, “Global image enhancement using local information,” Electronics Letters, vol. 30, pp. 122–123, Jan. 1994.
[13] Sunita Dhariwal “Comparative Analysis of Various Image Enhancement Techniques”, IJECT Vol. 2, Issue 3, Sept. 2011.
[14] J. Hertz, R. Plamer,. Introduction to the neural computation, Addison Wesley, California, 1991.
[15] Naglaa Hassan,Norio Akamatsu,”A new approach for contrast enhancement using sigmoid function”,The International Arab Journal of Information
Technology,pp.221-225,Vol. 1,No. 2,July2004. [16] Dileep MD and A.Sreenivasa Murthy,”A Comparison
between different Colour Image Contrast Enhancement Algorithms”,IEEE, PROCEEDINGS OF ICETECT 2011,pp 708-712. [17] Sonia Goyal,Seema,” Region Based Contrast Limited
Adaptive HE with Additive Gradient for Contrast Enhancement of Medical Images (MRI)”, International Journal of Soft Computing and Engineering (IJSCE), Volume-1, Issue-4, pp. 154-157,September 2011. [18] Jayaraman, S. Esakkirajan and T. Veerakumar,” Digital