SMSCQA: System for Measuring Source Code
Quality Assurance
Ayman Hussein Odeh
College of Engineering and IT Al Ain University of Science and Technology, Al Ain,UAE
ABSTRACT
Today software systems play a critical role in various aspects of human life, and become part of everyday life. Many of these systems are essential for the completion of day-to-day activities. The increased reliance on computer applications, and organization that produced software puts more and more strain on software developers and software systems itself. For these reasons many international standards, requirements, and constrains were established to assure quality of software. In this work the most important fundamentals of software quality assurance used during life cycle development process (LCDP) will be covered. Specially that used in coding phase. This phase is a very important period for all software, because the cure of software system will be established here. Therefore it was sliced in detailes, and all of its aspects were recovered like: Software metrics, Software quality factors, and software quality models like McCall's model, Boehm's model, ISO 9126 model, and SATC NASA model. By comparing and studying these models the System for Measuring Source Code Quality Assurance was retrieved. Using this system over 30 source code metrics, 9 quality factors can be measured and overall quality might be calculated.
General Terms
Software Quality Assurance: SQA, Lines Of Code : LOC, Capability Maturity Model: CMM,
Keywords
Software Quality Assurance; Quality Models; ISO 9126; McCall’s Quality Model; Boehm’s Quality Model; CMM Model
1.
INTRODUCTION
Producing high quality software is a very important condition of staying in the market for the software companies, and developers. This thing is enforcing them to think about improving quality assurance of there products. This is probably the cause why so many process improvement experiments and measurement systems are initiated, but few of them are really successful. The basic quality assurance
difficulties for software-producing organizations and
developers are understanding the relationships among basic elements of software production, software products, the processes which produce the product, the resources involved in software production, the selection of relevant quality attributes in each case, the metrics to be applied for measuring the selected quality attributes, usage of the measurements' results in order to improve software quality[1]. In the literature, there are a huge variety of descriptions about standards, models, best practices, all of them connected to software quality assurance, but there is no unified view or model to tell software developers, how to start an efficient quality measurement system, and how to evaluate quality of a source code [2].
The scope of this work was to understand the existing approaches and models about software quality assurance and the relationships among the different approaches, and based on these approaches, the new solution (approach) will be proposed to help a software developer to deal with quality assurance for source codes in a unified, balanced way.
2.
REVIEW OF SQA MODELS
2.1
Product Quality Assurance Models
The elements defining software product quality assurance and the relationships between these elements have been summarized first time in two software quality models developed in the USA. One of these models was developed in 1977 by a team of researchers, lead by Barry W. Boehm [3,4]. The development of the other model is connected to the work done in 1978 by James A. McCall [3,5]. The two quality models focus on the final product, and identify key attributes of the product, called quality factors. The quality factors are high-level quality attributes, like reliability, usability, maintainability. Both models assume that the quality attributes are still on a high level to be meaningful or to be measurable, therefore further decomposition is needed. This-lower-level of the quality attributes are called quality criteria. In a third level of decomposition the quality criteria are associated with a set of directly measurable attributes called quality metrics.
The ISO 9126 model
is a derivation of McCall's model. It defines software quality as "The totality of features and characteristic of a software product that bear on its ability to satisfy stated or implied needs" [6]. The standard claims that the quality is composed of 6 factors: functionality, reliability, efficiency, usability, maintainability, portability, and that one or more of them are enough to describe any component of software quality [7,8]. The deficiency of this model is that it does not provide proper definition of the lower-level details and metrics needed to attain a quantitative assessment of product quality. This lack of specifics in these models offers little guidance to software developers who need to build quality products. ISO 9126 is the software product evaluation standard. It identifies six Software Quality Characteristics [9] as following: Functionality which covers the functions that a software product provides to satisfy user needs. Reliability which relates to capability of software to maintain its level of performance. Usability which relates to the effort needed to use software. Efficiency which relates to the physical resources used when the software is executed.Maintainability which relates to the effort needed to the make changes to the software. Portability which relates to the ability of software to be transferred to a different environment.
for information only. They are useful as they clarify what is meant by the main characteristics [9, 5].
2.2
Process Quality Assurance Models
In this part Capability Maturity Model (CMM) will be presented as elements of another possible way of approaching software quality assurance: the process quality assurance approach.
A well-known framework for process assessment is the Capability Maturity Model of SEI [10] .
The Software CMM developed at the Software Engineering Institute (SEI) of Carnegie - Mellon University [11]. It describes software process management maturity relative to five levels [10], see Fig1
The CMM leveles: Initial - the starting point for use of a new or undocumented repeat process. Repeatable: the process is at least documented sufficiently such that repeating the same steps may be attempted. Defined: the process is defined as a standard business process, and decomposed to levels 0, 1 and 2. Managed: the process is quantitatively managed in accordance with agreed-upon metrics. Optimizing: process management includes deliberate process optimization or improvement.
A maturity model can be viewed as a set of structured levels that describe how well the behaviors, practices and processes of an organization can reliably and sustainably produce required outcomes [11, 10].
3.
The PROPOSED SYSTEM
The goal of a System for Measuring Source Code Quality
Assurance (SMSCQA) is measuring quality for source code, and represents it by single value, lists 9 quality factors, and more than 30 source code metrics. See Fig3. Typically, software quality is measured with a weighted sum of criteria measurements [12, 13] as it is used in this research.
3.1
The General Structure
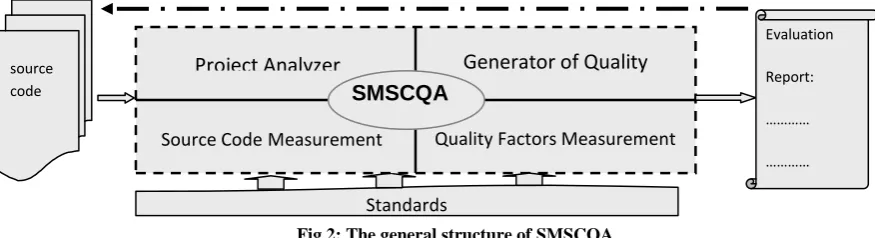
the general structure of proposed system shown in Fig2, and it consists of following blocks:
1. Source Code Reader: this block used to read and load file which contains tested source code script.
2. Source Code Analyzer: used analyze and classify source code lines into separated sub-blocks corresponding to the code structure.
3. Source Code Metrics Measurement: this block used
to measure all directly measurable source code metrics such as: LOC, operators, operands, total LOC, comments, and many of other metrics, see Table 1.
4. Quality Factors Measurement: It used to calculate and retrieve non-directly measurable metrics, then grouping them regarding to used model shown in Fig3 to achieve 9 quality factors using algorithm used in this system, finally this block calculates a final overall quality for measured source code.
5. Quality Reports Generator: This block used to generate four quality reports, these reports can be used as evaluation report to improve quality assurance of measured source code.
6. Common Quality Standards Database: It contains the most common quality standards.
3.2
The SMSCQA Algorithm
The following algorithm used in this proposed system to calculate quality factors, and overall quality:
1. Define weight (w) for each metric (0<=w<=1). 2. Scale value for metric scores (0<=scale<=1).
Fig1: CMM Levels Level 1: Initial
Level 2: Repeatable Level 3: Defined
Level 4: Managed Level 5: Optimizing
Tim e Maturity level
source code
Standards
Project Analyzer
Generator of Quality
Reports
Quality Factors Measurement
SMSCQA
Evaluation
Report:
…………
…………
…………
…………
…………
…………
[image:2.595.82.520.410.529.2]…………
3. Define minimum and maximum target value for each metric defined by the user and development team.
4. Define minimum and maximum target value for
each factor score defined by the user and development team.
5. Give each metric a score.
6. Compute a weighted sum and divide it by the sum of weights and;
7. Compare this value with the preset min-max factor scoring range.
8. If this value is outside the min – max scoring range, compare each individual metric score with the preset min-max metric score range.
The value for each factor in the SMSCQA system has the following form:
ni i n
n i
i i
W
W
C
QF
1
*
(1)
mj j m
n j
j j
W
W
QF
Quality
1
*
(2)
Where (QF) is quality factor, (Wi) are the weight for each metric included in computing this factor, (Ci) are the value of the metrics, and (n) is the number of metrics. Then the overall quality of the product is measured using the formula (2).
Where
QF
j are the values of quality factors.W
j are the weights for quality factors, and (m) is the number of quality factors.Note that: The maintainability factor is excluded from this model, it computed as maintainability index with special formula, using the following formula [14,15]:
CC
aveE
MI
_
1
171
3
.
42
*
ln(
)
0
.
23
*
)
*
4
.
2
sin(
*
50
)
ln(
*
2
.
16
2
_
aveLOC
perCM
MI
2
_
1
_
MI
MI
MI
(3)Where (MI) is a maintainability index, (aveE) is the average of Halstead effort[16] per module, (CC) is the average of cyclomatic complexity per module, (aveLOC) is the average lines of code per module, and perCM is the average percentage of lines of comments per module.
3.3
Weighted Selection
The values of weights in this system are very important. Therefore they must be used correctly dependence on the nature of the problem, solved by the source code submitted to measurement by this system model. For example, if the measured source code solves tasks related to military software, then this model must be use a suitable matrix of weights for this kind of problems. Different weight matrix reflects that this system is adaptive to measure many types of source codes, like which used in: System Software, Real-time Software, Business Software, Scientific Software, Embedded Software, Artificial Intelligence Software, Military Software, and Other.
Fig3: SMSCQA Model
Maintaiability
Overall Quality
Portability
Reliability
Reusability
Auditability
Readability Index
Understandability
Simplicity
Testability
LOC Comments S/S Independence
Option Explicit
Structural Fan In Structural Fan Out
Int. Documentation
Standard comp. Var. N. Convention Cn. N. Convention
InLine Comments Identifier Length Goto Usage Neted Condition Dead Variables Conciseness Degree of Coupling Error Handling H/W Independence
Cycl Complexity
Halstead Effort
Dead procedures Lev. of abstraction
The weights can be changed to achieve a good quality if this system used to provide and advice or quality reports to a development team.
4.
EXPERIMENTAL RESULTS
In this section two examples will be discussed to illustrate its metrics and specifications, and will be measured to
demonstrate the results provided by SMSCQA. These examples are written by different programmers; they solve
one task, and have identical interface compliance to our requirements see Fig4. They do the following: Generate 10 integer numbers and store them in an array. Sort these numbers and store them in another array. Extract a minimum and maximum numbers. Calculate average of these numbers.
The Table 1 shows all source code metrics for each procedure used in both examples; where :
p11 is a Command1_click procedure
p12 is a Form_load procedure
p13 is a b_sort procedure. .
p14 is a Min Function.
P15 is a Max Function.
p16 is a Ave Function.
p21 is a cmdGo_click procedure
p22 is a Form_load procedure
p23 is a BubbleSort procedure
p24 is a Min Function.
P25 is a Max Function.
p26 is a Ave Function
the quality factors chart , and overall quality for each examples are shown in Fig5, and Fig6. Where:
overall quality1=0.550, and overall quality2=0.773.
5.
CONCLUSION
Introducing software quality assurance in a life cycle development process can not be done at once: it takes time, it has to be done step by step[17]. If a company or developer aims to really understand software quality assurance for source code and implement it in an efficient way, this work is
done for this purpose. The attributes of interest software measurement often belong to either processes in the development life cycle, products that are created by those processes or resources used by the processes.
Measurement may be fundamental or derived, that is, measured directly or derived by combining two or more other measurements. Halstead Software Science measurements have been discredited on both empirical and theoretical grounds. However, it should be noted that the use of delivered source instructions and number of unique operands uses can by themselves be useful measurements.
Cyclomatic complexity can be a useful measurement in the planning and assessment of testing. Outside this application area, its usefulness may be limited because of its close
[image:4.595.72.503.329.600.2]Fig4: Interface of proposed example
Table 1. Metrics of all procedures of two examples
No Metric
Value for example1 Value for example2
p11 p12 p13 p14 p15 p16 p21 p22 p23 p24 p25 p26
1 Dead No No No No No No No No No No No No
2 Cyclomatic complexity 3 1 4 3 3 2 3 1 4 3 3 2
3 Structural fan in 0 0 1 1 1 1 0 0 1 1 1 1
4 Structural fan out 4 0 0 0 0 0 4 0 4 0 0 0
5 Informational fan in 5 0 3 2 2 2 6 0 3 2 2 2
6 Informational fan out 0 0 1 1 1 1 1 0 3 2 2 2
7 Informational complexity 0 0 36 20 20 18 108 0 117 44 40 36
8 Nested conditions 1 0 3 2 2 1 1 0 3 2 2 1
9 Nested loops 1 0 2 1 1 1 1 0 2 1 1 1
10 Total lines 16 9 14 10 10 9 37 22 14 20 20 19
11 LOC 15 0 12 10 10 9 18 12 12 11 10 9
12 Comments line 1 0 2 0 0 0 19 9 9 9 9 9
13 Space lines 0 0 0 0 0 0 0 1 1 1 1 1
14 Local variables 0 0 1 1 1 1 0 0 1 1 1 1
15 Operators 9 7 6 5 5 7 9 7 6 5 5 6
16 Unique operators 1 4 2 2 2 3 1 4 2 2 2 3
17 Operands 19 15 14 12 12 14 19 15 14 12 12 12
18 Unique operands 14 11 7 7 7 9 14 11 7 7 7 8
19 Procedure Vocabulary 15 15 9 9 9 12 15 15 9 9 9 8
20 Procedure Length 28 22 20 17 17 21 28 22 20 17 17 18
21 Procedure Volume 109.39 85.95 63.39 53.88 53.88 75.28 109.39 85.95 63.39 53.88 53.88 62.26 22 Level of abstraction 0.85 0.366 0.5 0.583 0.583 0.428 0.92 0.366 0.5 0.583 0.583 0.444
23 Effort 74 234 126 92 92 175 74 234 126 92 92 140
24 Time (sec) 4 13 7 5 5 9 4 13 7 5 5 7
25 Goto Usage 0 0 0 0 0 0 0 0 0 0 0 0
26 Error Handling usage No No No No No No Yes Yes Yes Yes No Yes
27 InLine Comments 4 0 1 0 0 0 3 0 1 1 0 2
relationship with LOC. Quality by itself is a vague concept and practical quality requirements have to be carefully defined. Most of the qualities that are apparent to the users of software can only be tested for when the system is completed.
Increasing inline comments cause to increase readability. Comments line and average value of cyclomatic complexity affect on maintainability factor. A very important reliability indicator was calculated before delivering the software measured by SMSCQA. By comparing SMSCQA with Project Analyzer [18], more reports and more quality factors were used, and it is better by computing overall quality and quality factors for source code.
Future work : The software source code quality assurance system that was constructed by this work allows developer to evaluate source code in general form, but its implementation related to VB language. It can be completed to use its facilities with programs written in other programming language by the following methods:
1. Reconstruct its implementation to measure and evaluate Pseudo code. and add a module to convert source codes from high level languages, like C++, Java, Pascal, and VB to Pseudo code format, Using this property it can be used to evaluate any source code regardless at used language.
2. Build an expert system to interpretate output results from SMSCQA and propose set of recommendations to improve quality of measured software. Also, it can be used to select software quality models depending on the feature of the source code (metrics).
6.
REFERENCES
[1] Murali Chemuturi 2010, Mastering Software Quality
Assurance, J. Ross Publishing.
[2] Susan Elliott Sim, Steve Easterbrook, Richard C. Holt, 2003, Using Benchmarking to Advance Research: A Challenge to Software Engineering; icse, page. 74, 25th International Conference on Software Engineering (ICSE'03).
[3] R. E. Al-Qutaish, 2010, Quality Models In Software Engineering Literature: An Analytical And Comparative Study, Journal of American Science, Marsland Press, Michigan, USA, vol. 6, no. 3, pages. 166-175.
[4] B. Behkamal, M. Kahani and M. K. Akbari 2009,
Customizing ISO 9126 Quality Model For Evaluation Of B2B Applications, Journal Information and Software Technology, vol. 51, Issue 3.
[5] I. ISO, ISO 8402:1994- Quality management and quality
assurance-Vocabulary.
[6] Fenton N. 1991, Software Metrics - A Rigorous Approach; Chapman & Hall, London.
[7] Syahrul Fahmy, Nurul Haslinda, Wan Roslina and Ziti Fariha 2012, Evaluating the Quality of Software in e-Book Using the ISO 9126 Model, International Journal of Control and Automation, Vol. 5, No. 2,June, 2012.
[8] Grant Rule P. 2001, The Importance of the size of software requirements; NASSCOM Conference, page.18.
[9] Harry M. Sneed 1999, Applying size complexity and quality metrics to an object-oriented application, Shaker Publishing , ISBN 90-423-0075-2.
[10]Sasa Baskarada 2010, IQM-CMM: Information Quality
Management Capability Maturity Model,
Vieweg+Teubner Verlag, edition (Nov 17 2009)
[11]Fenton N. And M. 1999, Software Metrics and Risk, European Software Measurement Conference.
[12]Jan Bosch 2000, Design and Use of Software
Architectures: Adopting and Evolving a Product-Line Approach, Addison-Wesley Professional, 1 edition (May 29, 2000)
[13]Ulas Bardak 2006,Information Elicitation in Scheduling Problems, Carnegie Mellon University Pittsburgh.
[14]Mr. Sandeep Sharawat 2012, Software Maintainability Prediction Using Neural Networks, International Journal of Engineering Research and Applications (IJERA), Vol. 2, Issue 2,Mar-Apr 2012, pp.750-755
[15]Riaz, M., Mendes, E. Tempero 2009,A systematic review
of software maintainability prediction and metrics, Empirical Software Engineering and Measurement, 2009. ESEM 2009. 3rd International Symposium on , vol., no., pp.367-377.
[16]Bob Hughes 2000, Practical software measurement;
McGraw-Hill Companies.
[17]Linda H. Rosenberg 2002, What is Software Quality Assurance?, STC conference 2002
[18]Aivosto — Programming Tools for Software Developers,
http://www.aivosto.com/
[19]Rosenberg, Linda; Hammer, Theodore 1999,A
Methodology for Writing High Quality Requirement Specifications and for Evaluating Existing Ones, NASA Goddard Space Flight Center.
Fig5: Quality factors for example No1