http://dx.doi.org/10.4236/ajps.2014.520310
How to cite this paper: Joseph, O., Phelomene, M., Helene, N., Valens, H., Patrick, O.M., Thavarajah, D. and Thavarajah, P. (2014) Phenolic Compound Profiles of Two Common Beans Consumed by Rwandans. American Journal of Plant Sciences, 5, 2943-2947. http://dx.doi.org/10.4236/ajps.2014.520310
Phenolic Compound Profiles of Two
Common Beans Consumed by Rwandans
Owino Joseph1*, Mukashyaka Phelomene1, Ndayisaba Helene1, Habimana Valens1,
Ongol Martin Patrick2, Dil Thavarajah3, Pushparajah Thavarajah3
1Department of Applied Chemistry, College of Science and Technology, University of Rwanda, Kigali, Rwanda 2School of Food Science and Technology, College of Agriculture, Animal Sciences and Veterinary Medicine,
University of Rwanda, Kigali, Rwanda
3School of Food Systems, College of Agriculture, Food Systems and Natural Resources, North Dakota State
University, Fargo, ND, USA Email: *owinoj@gmail.com
Received 2 July 2014; revised 12 August 2014; accepted 29 August 2014
Copyright © 2014 by authors and Scientific Research Publishing Inc.
This work is licensed under the Creative Commons Attribution International License (CC BY).
http://creativecommons.org/licenses/by/4.0/
Abstract
Legumes are high-protein, medium-energy and micronutrient-rich food consumed in many parts of the world including Africa. This study evaluated the levels of specific phenolic compounds in three legumes. Two varieties of the common bean, (Phaseolus vulgaris L.) soybeans (Glycinemax
L.), and peas (Pisum sativum L.) from Rwanda were analyzed using high performance liquid chro-matography with diode array detection. The phenolic compounds were identified by comparison to the chromatographic retention times and UV spectra of known reference compounds. This study results clearly shows the presence of 11 different phenolic compounds in common beans: gallic acid, (+)-catechin, (–)-epicatechin, caffeic acid, o-coumaric acid, chlorogenic acid, quercetin, 4-hydrobenzoic acid, syringic acid, ferulic acid and vanillic acid. The concentration ranged from 0.59 to 2.27 mg/kg for epicatechin. High levels of catechin (13.5 to 57.9 mg/kg) ferulic acid (26.1 to 47.6 mg/kg) were also observed. Therefore, the results of this study show that Rwandan com-mon beans are a good source of phenolic acids in particular catechins and ferulic acid.
Keywords
Common Bean, Phenolic Compounds, Rwanda, Identification and Quantification
1. Introduction
Legumes are a source of proteins, minerals, and vitamins for millions of world populations. The common bean
(Phaseolus vulgaris L.), one of the food legumes, is a part of daily diets of African, Asian and South American populations. Common beans being a member of Leguminacea family fixing atmospheric nitrogen provide signifi-cant crop rotational advantages, and a contributor towards agricultural sustainability in many parts of the world [1]. Common beans are also a rich source of phytochemicals. Consumption of common beans rich in phytochem-icals promotes human health. Among phytochemphytochem-icals the phenolic class of compounds such as epicatechin, epi-gallocatechin gallate and catechin flavonoids protect against neurotoxic oxidative stresses. Epicatechins are also able to cross the blood-brain barrier [2] to reduce lipid peroxidation and inhibit platelet aggregation. In diabetic red blood cells, epicatechins increase acetylcholinesterase activity [3]. In addition, other phenolic compounds such as flavonoids have been shown to protect against lung diseases and a range of cancers [4].
Besides positive nutritional benefits of phenolic compounds, polymeric forms of phenolic compound or po-lyphenols exert negative health effects on protein digestibility and α-amylase activities. For example, heat-stable tannins inhibit pectinases, cellulase, amylases, β-galactosidases, lipases and several proteolytic enzyme activities. Iron (Fe) and zinc (Zn) mineral micronutrient bi-availabilities have been reduced in common beans with high concentration of certain phenolic compounds [5]. Polyphenols are also a contributor towards off colors and un-desirable flavors in beans and other foods.
Common bean is a part of daily diet of majority of Rwandans. It is estimated that Rwandan consumes 60 kg common beans per person per year [6]. With significant common bean consumption by Rwandans this study was carried out to determine type and concentrations of phenolic compounds in most widely consumed bean va-rieties. In addition, common bean phenolic compounds types and concentrations were compared with those of soybean and peas grown in Rwanda.
2. Materials and Methods
2.1. Study Samples
The legumes verities of pink and blue common beans of one kg were purchased in April 2013 from the local market within two km radius of the University of Rwanda Campus in Kigali, Rwanda. They were washed, sorted, and powdered using a domestic grinder (Philips, Model No. 2161, Netherlands). The powered samples kept in refrigerator 4˚C until sample analysis.
2.2. Chemicals and Reagents
All chemicals and reagents used were purchased from Sigma-Aldrich (St. Louis, MO, USA) and used without further purification. Ultra-pure water was purchased from Milli-Q plus system from Millipore (Billerica, MA, USA).
2.3. Extraction
Six ml of 95% ethanol was added to 0.6 g of finely ground dry samples, followed by rigorously mixing (2500 rpm) using a vortex for about 2 minutes. Then the samples were centrifuged at 1400 rpm for 10 minutes at room temperature and the supernatant was taken for further analysis.
2.4. Chromatographic Conditions
2.5. Calibration Curves
Solutions of the phenolic standards were prepared in the mobile phase. Separate calibration curves were used for phenolic compounds at four different concentrations. Quantifications were validated using inter laboratory anal-ysis of selected phenolic compounds at both at University of Rwanda (UOR), Kigali, Rwanda and North Dakota State University (NDSU), ND, USA. All samples were analyzed in triplicate.
2.6. Statistical Analysis
The results were analyzed by analysis of variance and calculation of correlations and regression with SPSS 16.0 statistical software (IBM Corporation, USA). Differences between means were evaluated using the Duncan’s multiple range test. The difference was considered significant p < 0.05.
3. Results and Discussion
3.1. Phenolic Compounds Separation and Identification
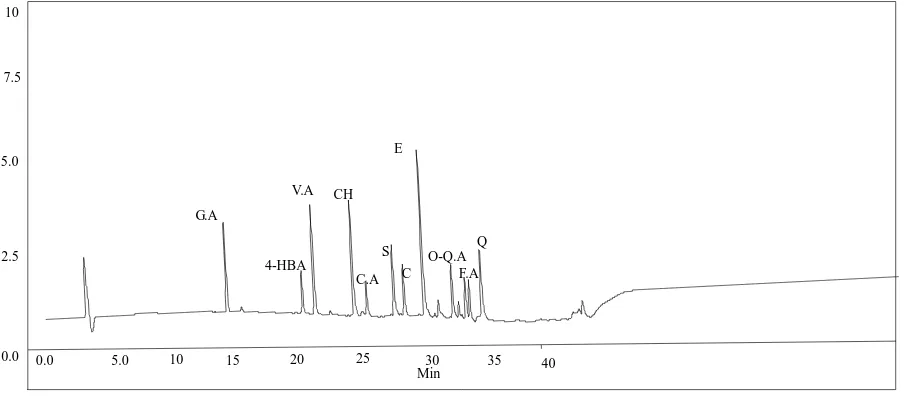
The chromatographic conditions of the phenolic compounds were optimized prior to sample analysis. The peaks of all analytes were well resolved, and a representative chromatogram is shown in Figure 1. The standard curves of all phenolic compounds correlations were 0.99 or higher. Therefore, we are certain that peak identification and sample quantification are accurate. Inter laboratory validation between the UOR and NDSU also confirmed selected peak identification and quantification. Chromatographic identification and confirmation of phenolic compounds were based on comparing retention times with authentic standards. The relative concentrations at different wavelengths were calculated from the calibration curves [7].
3.2. Bean Phenolic Compound Quantification
Beans are good source of phenolic compounds. In this study sample phenolic compound detailed results are shown in Table 1. The levels of phenolic compound varied from 16.78 - 25.01 mg/kg for gallic acid, 18.18 - 29.64 mg/kg for 4 hydroxy benzoic acid, 10.69 - 13.33 mg/kg for vanillic acid, 23.17 - 24.06 mg/kg for chloro-genic acid, 11.8 - 41.9 mg/kg for caffeic acid, 14.1 - 31.3 mg/kg for syringic acid, 13.5 - 57.9 mg/kg for catechin, 0.59 - 2.27 mg/kg for epicatechin, 12.57 - 27.1 mg/kg for o-coumaric acid, 26.1 - 47.6 for ferulic acid and 16.73 - 19.23 mg/kg for quercetin. From the results there was no significant difference (p > 0.05) in epicatechin, quer-cetin, catechin and ferulic acid in the four samples analyzed implying that consumption of the samples will re-sult in the same amount of the named phenolic compounds. In blue dry beans, catechin had the highest concen-
0.0 5.0 10 15 20 25 30 35 40
Min 0.0
2.5 5.0 7.5 10
G.A
4-HBA V.A CH
S C E
O-Q.A
C.A F.A
[image:3.595.87.539.486.684.2]Q
Figure 1. Representative HPLC chromatogram of 11 different phenolic compounds. GA: Gallic Acid, 4-HBA: 4-Hydroxy
Table 1. Composition of the phenolic compounds.
SAMPLES Gallic acid 4-Hydroxy benzoic acid Vanillic acid Chlorogenic acid Caffeic acid Syringic
acid Catechin Epicatechin
Coumaric acid
Ferulic
acid Quercetin
BLUE BEAN 16.78 a
± 0.24
26.84a ± 1.15
10.69a ± 0.07
23.36a ± 0.53
41.9c ± 1.04
14.4a ±1.11
57.0c ± 0.80
1.10b ± 0.00
12.57a ± 0.37
26.1a ± 0.01
16.77a ± 0.24
PINK BEAN 25.01 c
± 2.77
27.17a ± 0.54
11.54a ± 0.08
23.59a ± 0.08
25.5b ± 3.20
14.1a ±0.34
13.5a ± 0.50
2.27c ± 0.04
16.66a ± 0.65
36.0b ± 1.44
17.21a ± 0.15
SOYA 20.28 b
± 0.09
18.18a ± 0.53
10.91a ± 0.16
23.17a ± 0.08
40.3c ± 9.47
18.7b ± 0.25
57.9c ± 1.64
1.06b ± 0.08
27.1a ± 1.19
27.1a ± 1.19
16.73a ± 2.49
PEA 20.48 b ± 0.67
29.64a ± 3.10
13.33b ± 1.85
24.06a ± 1.10
11.8a ± 0.45
31.3c ± 2.13
18.1b ± 3.83
0.59a ± 0.42
15.34a ± 0.02
47.6c ± 3.39
19.23a ± 1.83
tration of 57 mg/kg while epicatechin had the lowest concentration 1.1 mg/kg. Similar trend was observed in a study of quantitation of phenolics from the seeds of green beans in which levels of catechin was 407.5 mg/kg while epicatechin was 207.6 mg/kg [8]. In pink dry beans ferulic acid had the highest concentration of 36 mg/kg while epicatechin had the lowest concentration of 2.7 mg/kg. In soybean, catechin had the highest concentration of 57.9 mg/kg while the lowest concentration was observed in epicatechin at 1.06 mg/kg. For pea, highest con-centration was seen in ferulic acid at 47.6 mg/kg and the lowest was epicatechin at 0.59 mg/kg. The low levels of epicatechin could be attributed to an epimerization reaction which converts epicatechin to its epimer catechin during the extraction process [9].
Only p-coumaric and ferulic acid were reported in a study [10], from the flour and hull of the navy beans. In a study on phenolic acids content of fifteen dry edible bean varieties, caffeic acid was quantified at 1.1 mg/100mg in black beans, p-coumaric acid was 12.4 mg/100g, ferulic acid was 26.6 mg/100g and sinapic acid 9.4 mg/ 100mg [11]. The observed values are much higher for caffeic and ferulic acid compared to the study samples. This difference can be attributed to various factors such as variety, assay procedure, growing and storage condi-tions, agronomic practices (irrigation, fertilization, pest management), maturity at harvest, post harvest storage and climatic conditions [12]-[14].
Most studies in literature reports on the total phenolic content, which makes it not possible for, direct parison with our study. However, this may be the first study from Rwanda reporting detailed phenolic com-pound results. Since polyphenols exert both beneficial and negative effects, further studies using common bean phenolic compounds on cell culture, animal models and human subjects will provide real human nutrition bene-fits.
4. Conclusion
Eleven phenolic compounds in common bean samples were analyzed and quantified using high-performance liquid chromatography-diode array detection. This study shows that Rwandan beans are a good source of phe-nolic compounds in particular catechins and ferulic acid.
References
[1] Broughton, W.J., Hernandez, G., Blair, M., Beebe, S., Gepts, P. and Vanderleyde, J. (2003) Beans (Phaseolus spp.)— Model Food Legumes. Plant and Soil, 252, 55-128. http://dx.doi.org/10.1023/A:1024146710611
[2] Vivanco, J.M., Bais, H.P., Vepachedu, R., Gilroy, S. and Callaway, R.M. (2003) Allelopathy and Exotic Plant Invasion: From Molecules and Genes to Species Interactions. Science, 13, 77-80.
[3] Maria, A., Janeiro, P. and Oliveira, B. (2004) Catechin Electrochemical Oxidation Mechanisms. Analytica Chimica Acta, 518, 109-115. http://dx.doi.org/10.1016/j.aca.2004.05.038
[4] Woods, R.K., Raven, J.M., Wolfe, R., Ireland, P.D., Thien, F.C.K. and Abramson, M.J. (2003) Food and Nutrient In-takes and Asthma Risk in Young Adults. American Journal of Clinical Nutrition, 78, 414-421.
[5] Oatway, L., Vasanthan, T. and Helm, J. (2001) Phytic Acid. Food Reviews International, 17, 419-431. http://dx.doi.org/10.1081/FRI-100108531
[6] MINAGRI (2012) CIA World Factbook. MINAGRI, Rwanda.
[7] Robbins, J.R. and Bean, S.R. (2004) Development of a Quantitative High Performance Liquid Chromatography-Pho- todiode Array Detection Measurement System for Phenolic Acids. Journal of Chromatography A, 1038, 97-105. http://dx.doi.org/10.1016/j.chroma.2004.03.009
formance Liquid Chromatography. Chromatographia, 52, 33-38. http://dx.doi.org/10.1007/BF02490789
[9] Kofink, M., Papagiannopoulos, M. and Galensa, R. (2007) (−)-Catechin in Cocoa and Chocolate: Occurrence and Analysis of an Atypical Flavan-3-ol Enantiomer. Molecule, 12, 1274-1288.
[10] Sosulski, F.W. and Dabroski, K.J. (1984) Composition of Free and Hydrolysable Phenolic Acids in the Flours and Hulls of Ten Legume Species. Journal of Agriculture and Food Chemistry, 32, 131-133.
http://dx.doi.org/10.1021/jf00121a033
[11] Luthria, D.L. and Pastor-Corrales, M.A. (2006) Phenolic Acids Content of Fifteen Dry Edible Bean (Phaseolus vulga-ris L.) Varieties. Journal of Food Composition and Analysis, 19, 205-211. http://dx.doi.org/10.1016/j.jfca.2005.09.003
[12] Dixon, R.A. and Paiva, N.L. (1995) Stress-Induced Phenylpropanoid Metabolism. Plant Cell, 7, 1085-1097. http://dx.doi.org/10.1105/tpc.7.7.1085
[13] Ninfali, P. and Bacchiocca, M. (2003) Polyphenols and Antioxidant Capacity of Vegetables under Fresh and Frozen Conditions. Journal of Agricultural and Food Chemistry, 51, 2222-2226. http://dx.doi.org/10.1021/jf020936m
[14] Hakkinen, S. and Torronen, R. (2000) Content of Flavonols and Selected Phenolic Acids in Strawberries Vaccinium Species: Influence of Cultivar, Cultivation Site and Technique. Food Reviews International, 33, 517-524.