Energy-Efficient and Reliable Routing Protocol for
Wireless Sensor Networks
Arvind Kumar
Dept. of Computer Science &Engg. NIT Hamirpur Hamirpur, H.P., India
Ravi Kant Sahu
Dept. of Computer Science &Engg. NIT Hamirpur Hamirpur, H.P., India
Siddhartha Chauhan
Dept. of Computer Science &Engg. NIT Hamirpur Hamirpur, H.P., India
ABSTRACT
In WSNs routing of data consumes a lot of energy due to excessive flooding of packets. In the proposed EERP scheme routing is done on the basis of intensity of received signals. Unlike REEP, information packet is forwarded by only one source sensor node. The information packets are forwarded by the sensor node which has the maximum intensity of received signal from the object. Alternate routing paths are also maintained through local flooding. Theoretical analysis and simulation results show that the proposed routing protocol is more energy efficient as compared to other existing protocols such as Directed Diffusion and REEP.
Keywords
Intensity, Waiting time, Sink, Time to live.
1.
INTRODUCTION
Sensor nodes are capable of simple computations and some sort of sensing capability in small physical area. Sensor nodes are resource constrained for example limited energy, limited processing capability, limited memory storage etc which present more challenges in the application of wireless sensors in WSNs. Lots of researches have been carried out to solve the various problems related to wireless sensor nodes. One of them is energy consumption problem in WSNs. Such constraints proposed many problems in designing of sensor networks. In WSNs most of the data are loss due to death of nodes which causes retransmission of data which takes more energy. All sensors are operated on the battery power and it is almost impossible to replace the battery of sensor at the processing time so it is important that all sensors use its power optimally to increase the network lifetime. In sensor networks most of the energy is use in the transmission of data packets so to save the energy it is important to use shortest path in the transmission.
Many protocols have been proposed for the above problems and most of them can be classified in the three categories as data centric routing protocols, hierarchical routing protocol and location aware routing protocols. In data centric routing protocols data of desired types are flowing in the networks. Sink collects the data of desired types from all sensors and sink node have sufficient amount of energy, power, and storage capability. In hierarchical routing protocol nodes are grouped in clusters. In all clusters there is a node called cluster head and it controlled all the communication among nodes in the cluster. In location aware routing protocols routing is performed on the basis of location information.
2.
RELATED WORK
Wireless sensor networks nodes are small in size and are powered by irreplaceable batteries so efficient use of energy is required. In REEP [1] there are five events: sense events, information events, request event, energy threshold value and request priority queue. Sink node generate sense event for collection of basic information. This protocol has very effective method for use of energy of node. Every node uses energy threshold value, on the basis of which each node decided to participate in the activities. On receiving sequence of information event from different neighbours nodes, each node queue them in request process queue. This is data centric protocol. For the energy efficient information flow it uses aggregated data from network. It uses local topology for path setup.
C. Intanagonwiwat, R. Govindan, D. Estrin, J. Heidemann and Fabio Silva [2] proposed DD. DD is data centric which is uses distribution to achieve energy saving. DD consist of interests, data messages, gradients, and reinforcement elements. It is the directed-diffusion paradigm for distributed sensing algorithm. DD performs data dissemination scheme such as omniscient multicast and its main focus on the MAC layer.
H.K.D. Sharma, Rajib Mall and Avijit Kar [3] proposed a hierarchical and cluster based routing protocol. It has two phase setup phase and data forwarding phase. In the setup field sensor nodes are self organized and network topology is done. While during the data forwarding phase routing of actual data is performed. All transmission of data to sink is performed by gateway node. Cluster nodes and gateway nodes perform the data fusion to reduce the data size for transmission by removing unnecessary information. Gateway nodes collect data from different cluster node and send them to base station. Base station selects two cluster head node from each cluster to solve the bottleneck problem and they are uniformly distributed, so they cover the optimal area.
W. Fang, F. Liu, F. Yang, L. Shu, and S. Nishio [5] proposed a reliable and efficient scheme for data transmission. This is a novel communication scheme for data transmission. It is not the routing protocol but its main objective is to minimize the packet losses. A proposed scheme contains multiple paths for data transmission as a result when one node or route fails it chooses another one, so it is called cooperative communication protocol. Alternate neighbour is selected from the cooperative nodes when one node or route fails so it reduces the total data transmission time.
Christian Domínguez-Medina and Nareli Cruz-Cortés proposed a protocol [6] maximized network lifetime and minimised latency in data transmissions. The proposed protocol composed of two phases. In the first phase a set of ants is placed in the source node, and travel to the base station. Then, in the second, the ants go back to the source node, updating the pheromone values of the sensor nodes of their paths. This protocol increases the lifetime of the network.
Zhuo Liu, Bingwen Wang, Wei Wang and Wei Xiong proposed [7] a protocol for constructing backbone in wireless sensor network. In this protocol there are white, black and gray nodes. This protocol uses colour schemes to form backbone. It is simple and efficient algorithm for constructing virtual backbone in wireless sensor networks.
Al-Khateeb Anwar and Luciano Lavagno proposed Energy Optimization Framework for WSN Design [8]. It deals with functional design, optimization and implementation of energy aware WSNs. complete energy-aware customizable protocol stack, which uses model-based design to quickly generate code for both power-aware network simulators. The proposed protocol provides energy optimization features for application that require high transmission bandwidth. This protocol gives code generation models of the PHY, MAC and Network layers.
Tang Qi and Qiao Bing proposed MCEE [9]. MCEE is distributed policy in which nodes are chooses as the cluster head based on the probability. MCEE increases network lifetime and supports scalable data aggregation. Li Han proposed LEACH-HPR[10] which uses minimum spanning tree to perform inter cluster routing. It is very effective method for reduce energy consumption and increase network lifetime.
Wang Bo, Huang Chuanhe, Yang Wenzhong and Wang Tong proposed opportunistic routing approach TOR [11] which takes advantage of broadcasting. TOR increases security assurance and increases lifetime. Said Ben Alla, Abdellah Ezzati, Abderrahim Beni Hssane And Moulay Lahcen Hasnaoui proposed HABRP [12] based on efficient energy management of sensor nodes. HABRP decreases the probability of failure of nodes.
3.
PROPOSED PROTOCOL
3.1
Assumptions
All sensors are uniformly distributed within the network.
Every sensor node has small memory and capable of doing some computation.
3.2
Routing Scheme
ERRP is a data centric routing protocol in which sink sends request for particular type of data. All other nodes listen to the sink and sense the network. If any sensor node in the network has data of required type, they will response to the sink. This protocol can be divided into four steps sensing, sensing response, path setup and transmission of data as described below:
3.2.1 Sensing
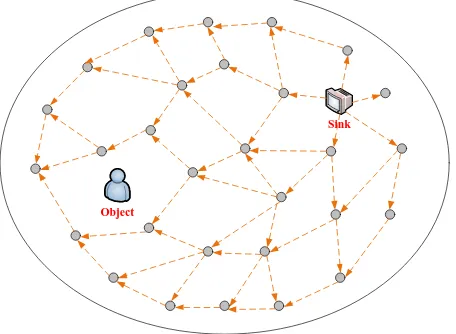
It is the first step for transmission of data. A node from which user wants information in the network is called sink node. To get the data sink node send the request for data of required types to all the nodes in the network. Sink node flooded following information in the network for initiation of data transmission. Fig. 1 shows the flooding of request for required data. Coordinate of sink node, timestamp means time at which request is generates, and time duration during which all sensors in the network activated and performs sensing for required data. For example
Sink = [321,543] Timestamp = 01:32:43 Sensor duration = 12 ms
In the above example coordinate [321,543] is indicating the sink location, 01:32:43 indicating the time at which request is generated and 12 ms is time during which all sensor in the network perform sensing task. Sink node periodically send this information with increase time stamp.
Sink
[image:2.595.316.544.276.443.2]Object
Fig 1: Sink node flooded the request for data in the network
3.2.2 Sensing response
After receiving the request for sensing information, all sensors in the network are activated and they sense in its range in the network for given interval of time. If any sensor found any object such as vehicle or animal in its range, it will wait for waiting period (WT) and after that they send their data to all other neighboring.
Waiting Time (WT): When a sensor node senses any event in
its vicinity, it measures the intensity of the received signal and the sets it waiting time𝑊𝑇. Waiting time is inversely proportional to the intensity as shown in the formula given below:
𝑊𝑇=
𝛼 𝐼
Where α is constant and I is the intensity of sensed object. Intensity of object is directly proportional to the distance of object from sensor. If object is more nearer to the sensor, the intensity is high and if it is farther away, its intensity value will be less. After that they send information about this sensed object to other nodes.
The sensor with highest intensity will send this information of object to the sink with maximum value of time to live (TTL) and all other sensor sends this information with TTL value:
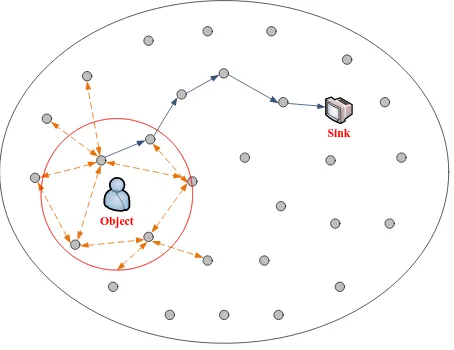
Where r is the radius of the circular region sensed by sensor, TS is the transmission speed of packets and γ is the number of hops. For example if γ is 1 than packet will be valid only to the one hop neighbour of itself. Since only one sensor sends information packet with maximum TTL value and all other sends with less TTL value hence only one packet is forwarded to the sink and all other sensed information packets are stored in decreasing order of their intensity. Fig. 2 shows transmission of information in the sensor network.
Sink
[image:3.595.55.282.176.351.2]Object
Fig 2: All the sensors within the region send data of object after waiting of time WT
The sensor with highest intensity is called source sensor. The source sensor saves the information about neighbour sensors (node ID) in the form of table in its memory. Since all nodes in the region send data after waiting of time WT which is inversely proportional to the intensity of the object sensed. Hence source sensor saves neighbours node ID in decreasing order of intensity of object sensed by them which is used to find alternate paths in case of depletion of energy of source sensor node. Since all other sensor except source sensor sends the information with less TTL value, so there information packets are transmitted only to the neighboring nodes. When the energy of the source sensor is going below the threshold value, it will pick up the first sensor from its table with second highest intensity value and inform to that sensor and sends all necessary information to that sensor. The second sensor will delete its entry from the table and store all other neighbours‟ information in its memory in the form of table.
The source sensor will send information about object type, location of the source sensor and timestamp at which this information is generated. For example:
Object type = mobile Sensor = [321,423] Timestamp = 01:04:21
In the above example mobile shows detected object type, the value of sensor [321,423] shows location of sensor who detects this object and timestamp value shows the time at which this information is generated by the sensor.
3.2.3 Path setup
At the end of sensing response event sink node has a list of information about objects and associated source nodes. After that user (sink node) can choose the one or more source nodes for data transmission according to the need. When sink node receives the information about object, it sends message to the source sensor for transmission of data. Sink node send this
message for transmission of data through its neighbours. And all other intermediate nodes in the path also send this message through some particular neighbours of itself. After receiving sensing response sink node creates request for data transmission and send this request to the source node through the neighbour from which sink node receives this response. All other intermediate nodes also have information about its neighbours. And they also choose the neighbour from which it receives sensing response first for this request. Since through short distance data will come fast hence all nodes in the network save node ID of its neighbour node in its memory in order in which they receives data from them.
3.2.4 Transmission of data
After receiving the request for data from the sink node, source node completes the path setup. Source sensor node performs data aggregation on the data received from the detected object. Due to aggregation data size is reduced and after that source sensor node forward this aggregated data towards the sink node. Figure 3 shows the request from sink and data transmission to the sink node.
Sink
Object
Data
[image:3.595.317.540.298.461.2]Request
Fig 3: Source sensor node send aggregated data to the sink node
3.3
Algorithm
A. Sink floods query in the network. B. For (Each node which received query
{
If (node „i‟ sense any object) {
Measure the intensity (I) of received signal from object.
Set waiting time , 𝑊𝑇=𝛼𝐼
If (node i does not receive any sensing response)
{
If (node‟s energy < threshold energy) {
Discard sensed information. Forward request to alternate source node.
} Else {
Set , 𝑇𝑇𝐿 = 𝑀𝑎𝑥
Forward packet following the reverse path of received query.
nodes in decreasing order of their intensity. } } Else {
Set , 𝑇𝑇𝐿 =𝛾𝑟𝑇
𝑆
Forward sensed information to the neighbours.
} } }
C. On receiving the sensed information, Sink sends request for actual data transmission to the source node through the reverse path followed by the information packet. D. If (Source node‟s energy < Threshold Energy)
{
Send request for data transmission to alternate source node.
} Else
{
Forward the data through the reverse path followed by the request.
}
4.
PERFORMANCE EVALUATION
We have used the following two matrices for evaluating the performance of the proposed ERRP protocol. We have compared the performance of ERRP with REEP and DD protocols. These matrices are as follows:
4.1
Average Energy Consumption
It can be defined as the average amount of energy consumed by each node for a particular task. Average energy consumption Eavg is calculated by using the equation below:
𝐸𝑎𝑣𝑔 =𝛴𝑖=1
𝑛 [𝐸
𝑖𝑛𝑖 𝑖 − 𝐸𝑟𝑒𝑠 𝑖 ]
𝑛 ∗ 𝑇
[image:4.595.52.275.72.338.2]Where 𝐸𝑖𝑛𝑖 𝑖 and 𝐸𝑟𝑒𝑠 𝑖 are initial energy and residual energy of node i respectively. „n‟ is the number of nodes and T is number of task.
Fig 4: Average Energy Consumption Vs Number of nodes
4.2
Average Delay
It can be defined as the time required for receiving the first data after the query generation at the sink node for a particular
task. . Average delay Tavg is calculated by using the equation below:
𝑇𝑎𝑣𝑔=
𝛴𝑖=1𝑇 [𝑡𝐷 𝑖 − 𝑡𝑄 𝑖 ]
𝑇
Where 𝑡𝐷 𝑖 is the time of receiving first data packet for
[image:4.595.316.545.156.295.2]particular task i, 𝑡𝑄 𝑖 is time of sending query by sink for particular task i and T is the total number of task.
Fig 5: Average Delay Vs Number of nodes
4.3
Average packet transmission
It can be defined as average number of packet transmissions per node for a particular task. . Average packet transmission Pavg is calculated by using the equation below:
𝑃𝑎𝑣𝑔 =
𝛴𝑖=1𝑛 𝑃𝑟𝑒𝑐 𝑖 − 𝑃𝑡𝑟𝑎𝑛𝑠 𝑖 /2
𝑛 ∗ 𝑇
[image:4.595.315.545.448.592.2]Where 𝑃𝑟𝑒𝑐 𝑖 and 𝑃𝑡𝑟𝑎𝑛𝑠 𝑖 are the number of packets received and transmitted by node i respectively. „n‟ is the number of nodes and T is number of task.
Fig 6: Average Packet transmission Vs Number of nodes
The proposed routing protocol reduces the energy consumption due to flooding of packets as compared with other existing routing protocols such as REEP. In this scheme flooding is restricted as the sensor node closest to the event floods the information packet with maximum time to live while other sensor nodes uses short time to live for maintaining alternate routing paths.
5.
CONCLUSION
In this paper we have proposed data centric routing protocol. This protocol reduces the energy consumption due to excessive flooding of packets in the entire network. We have used time to live for packets and only one sensor node floods
0 5 10 15 20 25 30
100 200 300 400 500 600 700 800 900 1000
DD REEP ERRP A v er ag e En er g y C o n su mp ti o n
Number of Nodes
0 1 2 3 4 5 6 7 8 9
100 200 300 400 500 600 700 800 900 1000
DD REEP ERRP A v er ag e D al ay ( S ec o n d s)
Number of Nodes
0 2 4 6 8 10 12 14 16 18
100 200 300 400 500 600 700 800 900 1000
DD REEP ERRP A v er ag e P ac k et T ra n smissi o n
[image:4.595.54.285.546.684.2]the information packet in the network. The routing information is forwarded on the basis of intensity of received signals. The sensor node with maximum received signal intensity forwards the information packet with maximum TTL value. We have used waiting time for selecting the sensor node with highest intensity as it will be having minimum waiting time. In the proposed ERRP scheme instead of all sensors in the neighborhood of event only one sensor with maximum intensity of received signal floods the information packet. Thus the proposed scheme is energy efficient and robust. Theoretical analysis and simulation results show that ERRP is more efficient than REEP and DD.
6.
REFERENCES
[1] F. Zabin, S. Misra, I. Woungang, H.F. Rashvand, N.W. Ma1, M. Ahsan Ali, “REEP: data-centric, energy-efficient and reliable routing protocol for wireless sensor networks,” IET Commun., 2008, vol. 2, no. 8, pp. 995– 1008.
[2] C. Intanagonwiwat, R. Govindan, D. Estrin, J. Heidemann and Fabio Silva, “Directed Diffusion for Wireless Sensor Networking,” IEEE/ACM transactions on networking, vol. 11, no. 1, february 2003.
[3] H.K.Deva Sarma, Avijit Kar, Rajib Mall, ” Energy Efficient Routing Protocol for Wireless Sensor Networks with Node and Sink Mobility,” Sensors Applications Symposium (SAS), 2011, pp-239-243.
[4] M. Elhawary and Z. J. Haas, “Energy-Efficient Protocol for Cooperative Networks,” IEEE transactions on networking, vol. 19, no. 2, april 2011.
[5] W. Fang, Feng Liu, Fangnan Yang, Lei Shu, and Shojiro Nishio, “Energy-Efficient Cooperative Communication for Data Transmission in Wireless Sensor Networks,” IEEE Transactions on Consumer Electronics, vol. 56, no. 4, november 2010.
[6] Christian Domínguez-Medina and Nareli Cruz-Cortés, “Energy-Efficient and Location-Aware Ant Colony Based Routing Algorithms for Wireless Sensor Networks,” IEEE transactions on networking, July 12– 16, 2011.
[7] Zhuo Liu, Bingwen Wang, Wei Wang, Wei Xiong, “Energy-Aware Routing Protocol based Virtual Backbone for Wireless Sensor Network,” IEEE conference, 2011.
[8] Al-Khateeb Anwar and Luciano Lavagno, “Energy Optimization Framework for WSN Design,” Journal of Network and Computer Applications, April 12–16, 2010.
[9] Tang Qi and Qiao Bing, “An Energy-Efficient Protocol Architecture with Multiple Clustering for Wireless Sensor Networks” International Conference on Intelligent Computing and Integrated Systems (ICISS), pp. 898-901, 2010.
[10]Li Han, “LEACH-HPR: An Energy Efficient Routing Algorithm for Heterogeneous WSN” International Conference on Intelligent Computing and Intelligent System (ICIS), vol. 2, pp.507-511, 2010.
[11]Wang Bo, Huang Chuanhe, Yang Wenzhong and Wang Tong, “Trust Opportunistic Routing Protocol in Multi-hop Wireless Networks” IEEE International Conference on Wireless Communications, Networking and Information Security (WCNIS), pp. 563 – 567, 2010.