Journal of Chemical and Pharmaceutical Research
__________________________________________________
ISSN No: 0975-7384 CODEN(USA): JCPRC5
J. Chem. Pharm. Res., 2010, 2(6):416-423
DFT-Based QSAR Prediction of 1-Octanol/Water Partition Coefficient of
Adamantine derivatives drugs
Z. Bayat* and M. Zanoozi
Department of Chemistry, Islamic Azad University-Quchan Branch, Iran
______________________________________________________________________________
ABSTRACT
A quantitative structure property relationship (QSPR) study was performed to develop a model that relates the structures of 39 ofAdamantine derivatives drugs to simple descriptors. The usefulness of the quantum chemical descriptors, were calculated at the level of the DFT theory using 6-31+G** basis set , and used to represent molecular structures. A subset of the calculated descriptors selected using stepwise regression that used in the QSPR model development. In this study Multiple Linear Regressions (MLR) were employed to model the relationships between molecular descriptors and biological activities of molecules using stepwise method and genetic algorithm as variable selection tools.. Biological activities contain the octanol/water partition coefficient (log P). The final regression equation included four parameters that consisted of Clog P, Mulliken charge, Isotropic parameters and Mass, all of which could be related to log P. Application of the developed model to a testing set of 39 of Adamantine derivatives drugs demonstrates that the new model is reliable with good predictive accuracy and simple formulation. The use of descriptors calculated only from molecular structure eliminates the need for experimental determination of properties for use in the correlation and allows for the estimation of log P for molecules not yet synthesized. The prediction results are in good agreement with the experimental values. Statistical qualities (RMAX= 0.927 , R
2
MAX= 0.858 Q 2
=0.713at B3LYP/6-31+G**) was obtained by this approach.
Keywords: partition coefficient octanol- water (LogPo/w), Adamantine derivatives, QSAR, DFT,
MLR
______________________________________________________________________________
INTRODUCTION
measure hydrophobicity [1], because it has been shown that this partition system is a good model for many biological processes [2]. Hence, it was deemed advantageous to develop a model to predict partition coefficient using only theoretically derived descriptors. However, using in vivo methods to measure the logarithmic values of partition coefficient drug concentration ratios (log Po/w) in humans is not possible, and to do so in animal models is expensive and time consuming. The partition coefficient of a solute between 1-octanol and water was first introduced in 1964 by Hansch and Fujita [3], and since then, many different approaches have been developed in an attempt to estimate this property. Quantitative structure–activity relationship (QSAR) analysis is an effective method in research into rational drug design and the mechanism of drug actions. In addition, it is useful in areas like the design of virtual compound libraries and the computational-chemical optimisation of compounds. QSAR studies can express the biological activities of compounds as a function of their various structural parameters and also describes how the variation in biological activity depends on changes in the chemical structure [4]. Recently, a QSAR study of biological activity has been published by our group [5-7]. If such a relationship can be derived from the structure-activity data, the model equation allows medicinal chemists to say with some confidence which properties are important in the mechanism of drug action. The success of a QSAR study depends on choosing robust statistical methods for producing the predictive model and also the relevant structural parameters for expressing the essential features within those chemical structures. In a QSAR study the model must be validated for its predictive value before it can be used to predict the response of additional chemicals. Validating QSAR with external data (i.e. data not used in the model development), although demanding, is the best method for validation [8-9]. However the availability of an independent external validation set of several compounds is rare in QSAR. Thus, the input data set must be adequately split by experimental design or other splitting procedures into representative training and validation/test sets [10-12]. In the present work, the data splitting was performed randomly and was confirmed by the factor spaces of the descriptors, as in our previous work [13–17]. Finally, the accuracy of the proposed model was illustrated using the following: leave one out, bootstrapping and external test set, cross-validations and chance correlation techniques. Several research groups have modeled the partition coefficient (LogP).As expected; the models typically show good fitting and prediction statistics with less than ten simple descriptors.
EXPERIMENTAL SECTION
Methodology Data set
The properties data used in this study are the LogPo/w of the set of 39 Adamantine derivatives
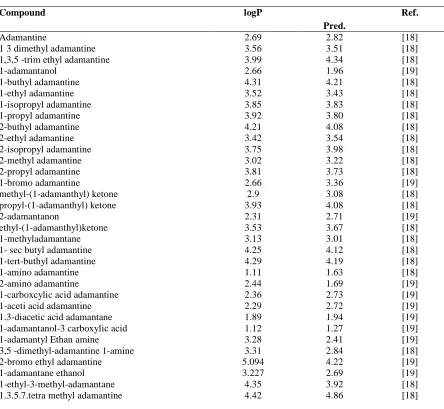
Table 1. Experimental values of LogPo/w for Adamantine derivatives training set
Compound logP
Pred.
Ref.
Adamantine 2.69 2.82 [18]
1 3 dimethyl adamantine 3.56 3.51 [18]
1,3,5 -trim ethyl adamantine 3.99 4.34 [18]
1-adamantanol 2.66 1.96 [19]
1-buthyl adamantine 4.31 4.21 [18]
1-ethyl adamantine 3.52 3.43 [18]
1-isopropyl adamantine 3.85 3.83 [18]
1-propyl adamantine 3.92 3.80 [18]
2-buthyl adamantine 4.21 4.08 [18]
2-ethyl adamantine 3.42 3.54 [18]
2-isopropyl adamantine 3.75 3.98 [18]
2-methyl adamantine 3.02 3.22 [18]
2-propyl adamantine 3.81 3.73 [18]
1-bromo adamantine 2.66 3.36 [19]
methyl-(1-adamanthyl) ketone 2.9 3.08 [18]
propyl-(1-adamanthyl) ketone 3.93 4.08 [18]
2-adamantanon 2.31 2.71 [19]
ethyl-(1-adamanthyl)ketone 3.53 3.67 [18]
1-methyladamantane 3.13 3.01 [18]
1- sec butyl adamantine 4.25 4.12 [18]
1-tert-buthyl adamantine 4.29 4.19 [18]
1-amino adamantine 1.11 1.63 [18]
2-amino adamantine 2.44 1.69 [19]
1-carboxcylic acid adamantine 2.36 2.73 [19]
1-aceti acid adamantine 2.29 2.72 [19]
1.3-diacetic acid adamantane 1.89 1.94 [19]
1-adamantanol-3 carboxylic acid 1.12 1.27 [19]
1-adamantyl Ethan amine 3.28 2.41 [19]
3,5 -dimethyl-adamantine 1-amine 3.31 2.84 [18]
2-bromo ethyl adamantine 5.094 4.22 [19]
1-adamantane ethanol 3.227 2.69 [19]
1-ethyl-3-methyl-adamantane 4.35 3.92 [18]
1.3.5.7.tetra methyl adamantine 4.42 4.86 [18]
Table 2. Experimental values of LogPo/w for adamantine derivatives test set
Compound logP Pred. Ref.
1.3 diethyl adamantine 4.35 4.34 [18]
1n-methyl-amino adamantine 1.51 2.06 [18]
1-n-n dimethyl adamantine 1.88 2.49 [18]
2-chloro adamantine 3.865 3.41 [19]
1-chloroadamantane 2.6 2.76 [19]
2-isobuthyl adamantine 4.15 4.20 [18]
Molecular descriptor generation
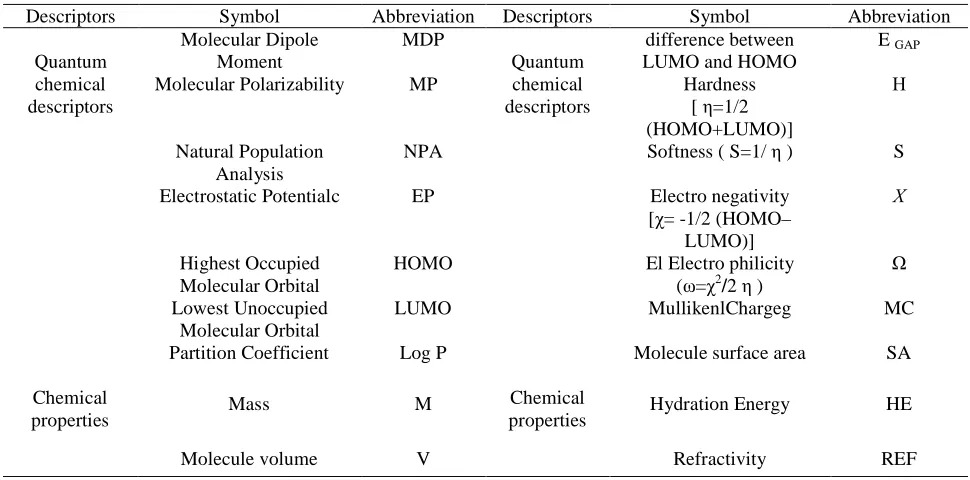
[image:3.595.61.520.566.648.2]obtained directly from the chemical structure, e. g. constitutional, geometrical, and topological descriptors. Other chemical and physicochemical properties were determined by the chemical structure (lipophilicity, hydrophilicity descriptors, electronic descriptors, energies of interaction). In this work, we used Gaussian 03 for ab initio calculations. HF method at 6-31+G** were applied for optimization of adamantine derivatives and calculation of many of the descriptors. At first adamantine derivatives were built by Hyperchem software and some of the descriptors such as surface area, hydration energy, and refractivity were calculated through it. The rest of the descriptors were obtained of Gaussian calculations. A large number of descriptors were calculated by Gaussian package and Hyperchem software. One way to avoid data redundancy is to exclude descriptors that are highly intercorrelated with each other before performing statistical analysis. Reduced multi collinearity and redundancy in the data will facilitate selection of relevant variables and models for the investigated endpoint. Variable-selection for the QSAR modeling was carried out by stepwise linear regression method. A stepwise technique was employed that only one parameter at a time was added to a model and always in the order of most significant to least significant in terms of F-test values. Statistical parameters were calculated subsequently for each step in the process, so the significance of the added parameter could be verified.
Table 2. The calculated descriptors used in this study
Descriptors Symbol Abbreviation Descriptors Symbol Abbreviation
Quantum chemical descriptors Molecular Dipole Moment MDP Quantum chemical descriptors difference between LUMO and HOMO
E GAP
Molecular Polarizability MP Hardness
[ η=1/2 (HOMO+LUMO)]
Η
Natural Population Analysis
NPA Softness ( S=1/ η ) S
Electrostatic Potentialc EP Electro negativity [χ= -1/2 (HOMO–
LUMO)]
Χ
Highest Occupied Molecular Orbital
HOMO El Electro philicity
(ω=χ2/2 η )
Ω
Lowest Unoccupied Molecular Orbital
LUMO MullikenlChargeg MC
Chemical properties
Partition Coefficient Log P
Chemical properties
Molecule surface area SA
Mass M Hydration Energy HE
Molecule volume V Refractivity REF
RESULTS AND DISCUSSION
LogP=0.101(±0.040)σ5+0.011(±0.004)M+3.836(±0.959)MC4+0.700(±0.070) LogP+0.707(±1.3990)
Q2=0.713R=0 .927 R2=0.858
In this equation, N is the number of compounds, R2 is the squared correlation coefficient, Q2 isthe squared cross-validation coefficient, and F is the Fisher F statistic. The figures in parentheses are the standard deviations. The built model was used to predict the test set data andthe prediction results are given in Table 1.As can be seen from Table 1, the calculated values for the LogPo/w are in good agreement with those of the experimental values. The predicted
values for LogPo/w for the compounds in the training and test sets using equation LogPo/w were
plotted against the experimental LogPo/w values in Figure 1.and the comparison between LogPo/w
using prediction and the experimental .A plot of the residual for the predicted values of RI for both the training and test sets against the experimental LogPo/w values are shown in Figure 2. As
can be seen the model did not show any proportional and systematic error, because the propagation of the residuals on both sides of zero are random. The real usefulness of QSAR models is not just their ability to reproduce known data, verified by their fitting power (R2), but is mainly their potential for predictive application. For this reason the model calculations were performed by maximising the explained variance in prediction, verified by the cross-validated correlation coefficient,Q2.This indicates that the obtainedregression model has a good internal and external predictive power.
Figure1. The predicted versus the experimental LogPo/w by MLR.
Also, in order to assess the robustness of the model, the chance correlation test was applied in this study. The dependent variable vector (LogPo/w) was randomly shuffled and The new QSAR
Table 3. The R2train and R values after several chance correlation tests
R2 R
N
0.384 0.619
1
0.218 0.467
2
0.229 0.478
3
0.258 0.508
4
0.275 0.525
5
0.266 0.516
6
0.113 0.365
7
0.439 0.663
8
0.139 0.373
9
0.191 0.437
10
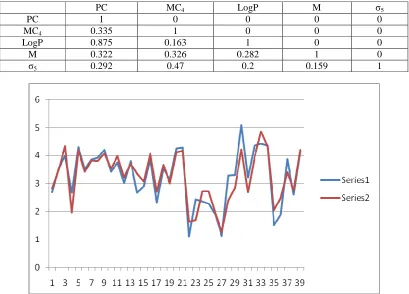
[image:6.595.94.503.343.637.2]The MLR analysis was employed to derive the QSAR models for different anti-cancer drugs. MLR and correlation analyses were carried out by the statistics software SPSS (Table 4).
Table 4. The correlation coefficient existing between the variables used in different MLR and equations with B3LYP/6-31+G** method.
PC MC4 LogP M σ5
PC 1 0 0 0 0
MC4 0.335 1 0 0 0
LogP 0.875 0.163 1 0 0
M 0.322 0.326 0.282 1 0
σ5 0.292 0.47 0.2 0.159 1
Series 1: the values of log P were obtained by using prediction.
Series 2: the values of log P were obtained by using Experimental methods
Interpretation of descriptors
The QSAR developed indicated that Nuclear magnetic Resonance (σ5), mass (M), Mullikan
charge (MC4) and Partition coefficient (LogP) compound LogPo/w. negative values in the
regression coefficients indicate that the indicated descriptor contributes positively to the value of LogPo/w, whereas positive values indicate that the greater the value of the descriptor the lower the
value of LogPo/w. In other words, increasingthe σ5, MandMC4 will decrease LogPo/wand
increasing the LogPincreases extent of LogPo/w of the adamantine derivatives. The standardized
regression coefficient reveals the significance of an individual descriptor presented in the regression model.
CONCLUSION
In this article, a QSAR study of 38adamantine derivatives. was performed based on the theoretical molecular descriptors calculated by the GAUSSIAN software and selected. The built model was assessed comprehensively (internal and external validation) and all the validations indicated that the QSPR model built was robust and satisfactory, and that the selected descriptors could account for the structural features responsible for the adamantine derivatives properties of the compounds. The QSPR model developed in this study can provide a useful tool to predict the LogPo/w of new compounds and also to design new compounds with high LogPo/w.
REFERENCES
[1] Huuskonen J., Salo M., Taskinen J., J. Pharm. Sci., 86, 450—454 (1997).
[2] Huuskonen J., Salo M., Taskinen J., J. Chem. Inf. Comput. Sci., 38, 450—456 (1998). [3] Hansch, C.; Fujita, T. J. Am. Chem. Soc. 1964, 86 (8), 1616–1626.
[4] Sammes PG, Taylor JB. Comprehensive Medicinal Chemistry. Oxford: Pergamon Press,
1990:766.
[5] Riahi S, Pourbasheer E, Dinarvand R, Ganjali MR, Norouzi P. ChemBiol Drug Des
2008;74:165–172.
[6] Riahi S, Pourbasheer E, Ganjali MR, Norouzi P. J Hazard Mater 2009;166:853–859. [7] Riahi S, Pourbasheer E, Ganjali MR, Norouzi P. ChemBiol Drug Des 2009;73:558–571 [8] Tropsha A, Gramatica P, Gombar VK. QSAR Comb Sci 2003;22:69–77.
[9] Riahi S, Ganjali MR, Norouzi P, Jafari F. Sens. Actuators B 2008; 132: 13–19. [10] Eriksson L, Johansson E, Muller M, Wold S. J Chemometr 2000; 14: 599–616.
[11] Golbraikh A, Shen M, Xiao Z, Xiao Y-D, Lee K-H, Tropsha A. J Comput Aided Mol Des
2003;17:241–253.
[12] Gramatica P, Pilutti P, Papa E. Validated QSAR prediction of OH tropospheric degradability: splitting into training-test set and consensus modeling. 2004; 44: 1794–1802 [13] Riahi S, Pourbasheer E, Dinarvand R, Ganjali MR, Norouzi P. ChemBiol Drug Des
2008;74:165–172.
[14] Riahi S, Ganjali MR, E Pourbasheer, Divsar F, Norouzi P, Chaloosi M. Curr Pharm Anal
2008;4:231–237.
[15] Riahi S, Pourbasheer E, Ganjali MR, Norouzi P, ZeraatkarMoghaddam A. J Chin ChemSoc
2008;55:1086–1093.
[16] Riahi S, Pourbasheer E, Dinarvand R, Ganjali MR, Norouzi P. ChemBiol Drug Des
[17] Riahi S, Pourbasheer E, Dinarvand R, Ganjali MR, Norouzi P. ChemBiol Drug Des
2008;72:575–584