The Usage Analysis of Web and Email Traffic on the
University Internet Backbone Links
Shwan Dyllan
*, Dilip Saravanan Ganeshacumar, Perry Xiao
ICT Department, London South Bank University, UK
Copyright © 2015 Horizon Research Publishing All rights reserved.
Abstract
We present our latest study on monitoring and analyzing the behavior of the LSBU (London South Bank University) data network traffic as well as identifying and understanding the usage of http traffic, mail traffic and overall traffic. This analysis of the network activity allows us to calculate accurately the importance of the network traffic characteristics, on a continuous basis, which can identify the data traffic patterns on the overall gateway and highlight the end-to-end performance of the network path. In this paper, the PRTG network monitoring tool (Paessler AG, Germany) has been chosen as this provides the capabilities of SNMP, port utilisation as well as sFlow. The objectives of the study are to point out the impact of the LSBU network performance and its congestions current state; to predict the future data network traffic and congestions; to focus on the usage of mail against the mostly used protocol such as http and https; to identify the venerability of the network, due to high usage in particular time of the day; and to check the capacity usage of the current resources to maximizeperformance and network utilization.
Keywords
Mail & Web Traffic, sFlow, SNMP, Data Network, Network Monitoring1. Introduction
L SBU network is based on three tiers network architecture, i.e. CORE layer, Distribution layer and edge layer (or access layer). The core layer is responsible for the routing protocols, the distribution layer responsible for all the VLAN management, spanning tree, loop prevention as well as some level of security. Finally the edge layer is responsible for the end user connectivity. In this paper we need to predict the excess mail traffic that will be generated once migrated to office365 over internally hosted mail service...
[image:1.595.96.516.483.737.2]JANET Data Centre 1 Data Centre 2
investigated with best quality network traces [1]. The recent researches classified the network traffic into two models such as passion processes and characteristics of network dependency. Many studies are based on developed models of the network traffic. Karagiannis et al. [2] examined the possibility of modeling the Internet backbone traffic. Poisson Paxson et al [3], which identified the failure of modelling, network arrival, also focused on network traffic.
SMTP, POP3, and IMAP [4] are the Internet standards and most popular mail protocols. The characteristics of these protocol are based on a client and server transferring email traffic between the source and destination i.e. sender and receiver. However, most recent studies of network traffic analysis have focused on Internet traffic (World Wide Web), only a few researches [5-9] analyzing the characteristics and behavior of mail traffic, which are based on scales and its protocol requests in the network traffic
2. Methodology
Based on the technics used in the past [10], researchers
3. Network Monitoring Data
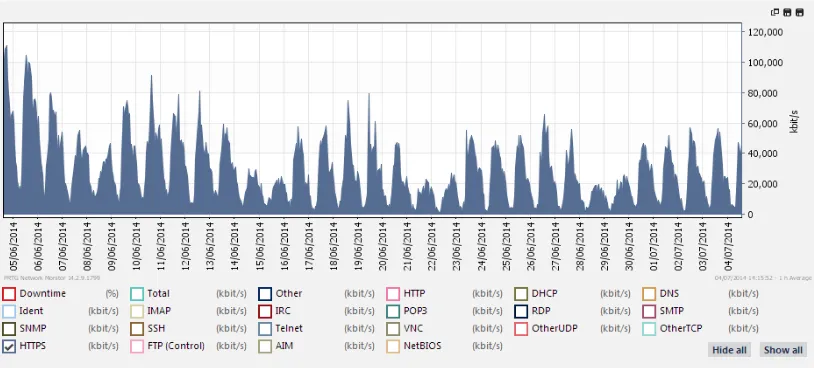
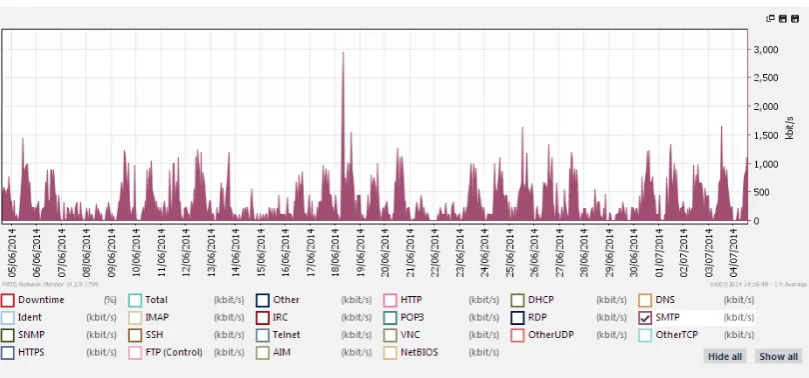
PRTG has been chosen to capture the data traffic from the exchange infrastructure. Figure 3, 4, 5 and 6 show typical example of 48 hours network traffic at DC1 and DC2, highlighting the SMTP, POP3 and IMAP traffic take up some of the overall traffic in contrast to the web traffic (HTTP & HTTPS) which take up most of the overall traffic. It is highly beneficial to identify the services i.e. VOIP, Video Conferencing, Media streaming and file sharing, which makes up most of the traffic. Once the benchmarks are set we can then analyze i.e. the bursting data traffic on the network and identify the activity or applications causing the burst. We can monitor the 3 tier network using SNMP for network performance, port utilization.
Security monitoring can be beneficial since this network traffic is apparent to the overloaded networks. Month on month captured data highlight the pattern for mail traffic, which were made of some of the overall traffic. See Figure 7, 8 and 9 respectively represent internal and external mail traffic patterns.
PRTG
LSBU Network
[image:2.595.100.501.513.596.2]JANET
Figure 3. Example sFlow data of SMTP traffic over 48 hours period
Figure 4. Example sFlow data of SMTP POP3 and IMAP traffic over 48 hours period.
[image:3.595.101.508.502.686.2]Figure 6. Example sFlow data of HTTP traffic over one month period.
Figure 7. Example sFlow data of all traffic and highlighting POP3traffic of one month periods
[image:4.595.102.507.505.694.2]Figure 9. Example sFlow data of IMAP, POP3 and SMTP traffic over one month period.
4. Analysis Results
Data gathered from on monthly basics can be added up to represent overall mail traffic. Formula below equates external mail traffic, http and https traffic and internal exchange data traffic.
31 31 31
Total traffic = ∑ http + ∑ https + ∑ Mail
0 0 0
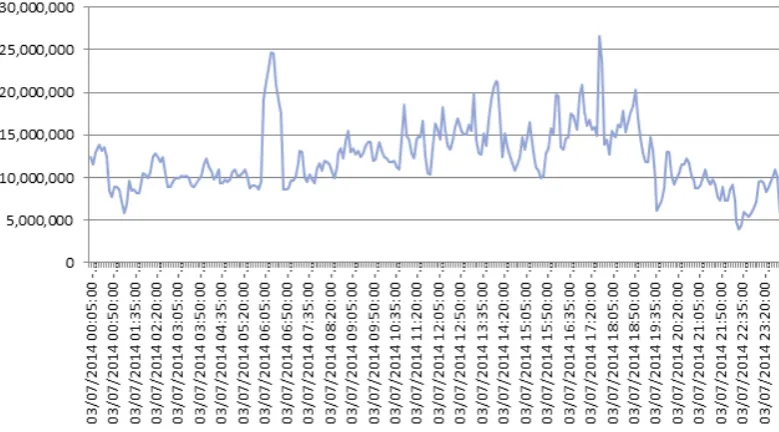
The raw data captured for one day and one month is exported to Microsoft Excel for further analysis. In order to compare and contrast the internal and external traffic for the same duration, we captured the raw data for POP, IMAP and SMTP on our uplinks. This resulted in determining the internal and external mail traffic ratio.
[image:5.595.109.499.462.678.2]Figure 11. Total Uplink Mail Data for a day (KByte)
Figure 12. Uplink and Internal Mail for a day
The graph below shows internal raw data and on top the uplink data. This highlights the ratio for internal and external mail traffic to be significantly high. To look at some figures we have the internal and external data in Kbyte and the ratio worked out using the formula
Ratio = internal data / Uplink data.
Internal Data Uplink Data Ratio 3,540,096,075 10,822,080 327.12
[image:6.595.118.487.91.482.2]Figure 13. Internal Mail for one month
Figure 14. Uplink Mail for one month.
Over one month period it is apparent that the uplink has similar behavior and it is negligible.
Total data traffic over a moth period is shown in the table below.
Internal Data External Data Ratio
96,810,047,181 372737872 259.73
This helps us to confirm the behavior of the ratio for the period. For a day it was 327 and for monthly average it is 260 times.
5. Conclusions
In our analysis, we focused on the usage of SMTP, POP3, IMAP and web (http and https) traffic before the migration of mail services into the cloud. We discovered that the https is highly used in LSBU network and email are used mostly internally. The email usage is approximately two percents, because the email services are in house currently.
Migrating to cloud based services, i.e. E-Mails, SharePoint, CRMs, Social Media, will have a significant effect on the raise load on our current uplinks. We can also
predict that the Secure Communications, specially the HTTPs communication, will increase significantly once migrates to cloud services. We have seen from the http, https and other mail communication ratio on figure 10, 11, 12, 13 and 14 charts, representing the ratio of the internal uplink and external uplink traffic through the backbone network. This will mount to significant increase on the overall web traffic.
The cloud based mail services will increase the load on our network and 10GB uplink on each of our gateways will cope with the traffic with load balancing put in place, but if there wouldn’t be resilient if there were a failure occurs on one of the gateways.
Acknowledgements
We thank London South Bank University for the financial support of this study.