Morphological Traits as Selection Indices in Rice: A
Statistical View
Pallabi Dutta
1, Partha Nath Dutta
2,*, P.K. Borua
31Department of Botany, Silapathar Science College, Assam 787059, India 2Department of Physics, Silapathar Science College, Assam 787059, India 3Department of Lifesciences, Dibrugarh University, Assam, India
*Corresponding Author: [email protected]
Copyright © 2013 Horizon Research Publishing All rights reserved.
Abstract
The objectives of this study were to estimate variability and genetic parameters of sixty-eight rice genotypes for twelve agronomically important characters. Significant variations were observed for all characters. Considering genetic parameters, high genotypic and phenotypic coefficients of variations, high heritability (broad sense) and high genetic advance as percentage of mean were shown by eight characters viz. tillers per plant, days to 50% flowering, harvest index, spikelets per panicle, spikelets per plant, spikelet density, panicles per plant and grain yield. Thus these characters were under the influence of additive gene action and a satisfactory selection programme for agronomic improvement on the basis of these characters is possible.Keywords
Genotypic Coefficients of Variation, Phenotypic Coefficients of Variation, Heritability, Genetic Advance1. Introduction
Genetic improvement mainly depends on the amount of genetic variability present in the population which is a ubiquitous property of all species in nature. The importance of genetic diversity in the selection of suitable genotypes for hybridization has been stressed by several scientists in different crops [1-3]. It results due to differences either in the genetic constitutions of the individuals of the population or due to the differences in the environment in which they grown. The genetic variability present in the germplasm of a crop and its estimation is pre-requisite for making any effective breeding programme. These genetic variations might be either heritable or non-heritable. The magnitude of variation due to heritable component is very important because, it would be a guide for selection of parents for crop improvement programmes of the population. Thus genetic variability for agronomic traits is the key component of breeding programs for broadening the gene pool of rice and
other crops. For any trait of interest, observed phenotypic differences among individuals may be due to differences in the genetic codes for that trait or may be the result of variation in environmental condition. A large number of agronomically significant characters are known to be affected by environmental factors. Selection based on the phenotype might not be fruitful in such traits. In breeding programmes, it is often difficult to manipulate such traits, since several inter-componential characters indirectly control these traits [4]. So the measurement of genetic variation and understanding of mode of inheritance of quantitative traits, therefore, are essential steps in any crop improvement programme. Heritability estimates provide authentic information about a particular genetic attribute which will be transmitted to the successive generations. A broad-sense heritability estimate provides information on the relative magnitude of genetic and environmental variation in the population [5-7] and help breeders to determine the possible extent for improvement through selection. Again the heritable portion of the total variation might not be always due to additive gene action. Thus estimates of heritability alone give no clear indication of the associating genetic progress that would result from selecting the best plants. It is also essential to find out the relative magnitude of additive and non additive genetic variances with regard to the characters of concern. The heritability along with phenotypic variance and the selection intensity, however, promise the estimation of genetic advance or response to selection which is more useful in the selection of promising lines [8-10].
Therefore considering all these facts and recognizing the importance of genetic diversity in plant breeding experiments, the present research work has been taken up
.
2. Materials and Methods
The details of the materials used and techniques adopted during the course of investigation are described below.
The present investigation was conducted during the seasons 2009-2010, 2010-2011 and 2011-2012 at a paddy growing field of Dhemaji district, Assam (North Latitude 27o15' to 28o 00' and East Longitude 94o05' to 95o30'). The soil of the experimental field was alluvial sandy loamy with pH 5.5. The average humidity during 2009 has been recorded as 81.2%, average temperature as 24.4
ºC
with maximum 30ºC
and minimum 17.7ºC
and total rainy days was 128. The average humidity during 2010 has been recorded as 86.2%, average temperature as 23.6ºC
with maximum 29.1ºC
and minimum 17.5ºC
and total rainy days was 143. The average humidity during 2011 has been recorded as 81.7%, average temperature as 23.9ºC
with maximum 29.7ºC
and minimum 17.7ºC
and total rainy days was 94. The average humidity during 2012 has been recorded as 81.1%, average temperature as 23.4ºC
with maximum 28.8ºC
and minimum 17.3ºC
and total rainy days was 128. (Source: Meteorological station 423090 (VELR) and E and D Office, Dhemaji).2.2. Experimental Materials and Layout Plan
The experimental material of the study comprised of 68 rice genotypes collected from different pockets of the state. The experiment was laid in Randomized Block Design replicated thrice. 45 days old seedlings were transplanted into the experimental site with 20 X 15 cm spacing. Row to row and hill (plant) to hill distance was 20 cm and 15 cm respectively.
2.3. Observations Recorded
The data were recorded for five randomly selected plants from each replication leaving the first two border rows from all the four sides, in order to avoid the sampling error. The observations were recorded as per the following procedure. Mean of readings from five plants were taken replication wise and the mean data was used for statistical analysis for the characters.
Plant height was measured in centimeter from the ground level to the top of the panicle (excluding awn) at the time of maturity. Number of tillers/plant was counted as per plant basis. Days to 50% flowering was determined by counting number of days from date of sowing to the 50 per cent flowering of the plants in the plot initiated [11].
For determining Harvest index, dry weight of both straw and grains of the sampled plants were weighed separately after harvest. By straw, the above ground portions of the plant devoid of grains was meant. According to formula given by Yoshida [11], harvest index was computed as the fraction of grain yield to the total biomass including straw and grain yields, as
HI = [(grain yield) / (grain yield + straw yield)] x 100 For length of panicle the average panicle length of five plants on the main Culm from the base of the panicle to the top of the last spikelet excluding awns was recorded in
centimeter. A sample of 100 well developed fresh whole seeds was collected and weighed in grams and computed to 1000 grains weight. Total number of spikelet on main panicle was counted and recorded at the time of maturity. Percentage of viable seeds was estimated by counting the number of well filled grains of five randomly selected panicles for each genotype and expressed in percentage. Spikelet density was calculated according to Chang et al.,[12] by dividing total number of spikelet by length of panicle for five randomly selected replicates for each genotypes and expressed in number/cm. Spikelet per plant was determined by counting the number of both well filled and aborted spikelet of five randomly selected replicates. The total numbers of panicles per plant was recorded in five replications for each genotypes. Grain yield/plant was computed according to Datta, [13] with slight modification as
GY/P = [(Number of panicles/ plant) x (number of spikelet /plant) x (% of Viable seeds) x (1000 seeds wt.) x 10 -5]
2.4. Statistical Analysis
The mean data recorded on the above observations were subjected to following biometrical analyses:
2.4.1. Standard Error
The standard error of the mean difference (SEM±) was calculated according to the expression suggested by Snedecor and Cochran [14].
2.4.2. Critical Difference
The significance or otherwise the differences between individual means were ascertained by the comparison with appropriate critical difference as described by Panse and Sukhatme [15].
C.D. = SEM x t 0.05 Where,
t = tabulated value at error degree of freedom at 5 percent level of significance
SEM = standard error of the mean difference
Significant ‘F-value’ indicates that there is significant difference among the treatments. But to compare any two particular treatments, it is tested against C.D. value.
2.4.3 Analysis of Variance
The analysis of variance was worked out to test the differences among genotypes by F-test. It was carried out according to the procedure of Randomized Block Design for each character as per methodology advocated by Panse and Sukhatme [15]. ANOVA helps in partitioning the total variance into three components viz. replication, treatment and error.
2.4.4. Test of Significance
significance, the variance between treatments was considered to be significant. If the F-calculated value is less than F-tabulated value, the difference between treatments was considered to be non-significant [16].
2.4.5. Components of Variance
Components of variances were calculated according to the formula given by Lush [17] and Chaudhary and Prasad [18]. 2.4.6. Coefficient of Variation (C.V)
It is the measure of variability evolved. Coefficient of variation is the ratio of standard deviation of a sample to its mean and expressed in percentage.
CV (%) = Standard DeviationMean In the present investigation three types of coefficient of variations were estimated viz., phenotypic coefficient of variation (PCV), genotypic coefficient of variation (GCV) and error/environmental coefficient of variation (ECV). The formulae used to calculate PCV, GCV and ECV were given by Burton and Devane [19].
Phenotypic coefficient of variation (PCV):
PCV% = σ2p𝑋𝑋� x 100 Where,
σ2p = Phenotypic standard deviation 𝑋𝑋 = Mean
Genotypic coefficient of variation (GCV):
GCV% = σ𝑋𝑋�2g x 100 Where,
σ2g = Genotypic standard deviation 𝑋𝑋 = Mean
Environmental of error coefficient of variation (ECV): ECV% = σ𝑋𝑋�2e x 100 Where,
σ2e = Error standard deviation 𝑋𝑋 = Mean
GCV and PCV values were categorized as low, moderate and high values as indicated by Sivasubramanian and Menon [20].
2.4.7. Heritability in Broad Sense (h2)
Heritability in broad sense is the ratio of genotypic variance to the total variance. It is that portion of total variability or phenotypic variability which is heritable due to the genotype. Broad sense heritability was estimated as the ratio of genotypic variance to the phenotypic variance and was expressed in percentage [21].
h2 = σσ2g2p x 100 Where,
σ2g = genotypic variance σ2e = phenotypic variance
The heritability percentage was categorized as low, moderate and high as suggested by Robinson et al., [22].
2.4.8. Expected Genetic Advance
Genetic advance is the improvement in mean genotypic value of selected plants over the parental population. The extent of genetic advance as expected from selecting five per cent of the superior progeny was calculated by using the following formula given by Johnson et al.[8].
GA = K. σp. h2 Where,
K = Constant selection differential at 5% level intensity (= 2.06)
σp = Phenotypic standard deviation h2 = Heritability in broad sense
2.4.9. Genetic Advance as Percent of Mean (GAM)
The formula of Genetic advance as percent of mean was as follow:
GAM = GA𝑋𝑋 x 100 Where,
GA = genetic advance 𝑋𝑋 = Grand mean Genetic advance as per cent of mean was categorized as low, moderate and high by following Johnson et al. [8].
3. Results and Discussion
3.1. Height
Plant height is an important trait contributing yield. Prasad
environment. Similar result was also found by Okelola et al.,[27] and Prajapati et al., [28] for this trait. The character showed high phenotypic and genotypic coefficient of variation, high heritability, high genetic advance and high genetic advance as percentage of mean. This indicates that this character is governed by additive genes and phenotypic selection is adequate to bring about desirable improvement of this character. Paland Sabesan [29]; Lal and Chauhan [30] and Prajapati et al.[28], also found high GCV and PCV, high
heritability and high genetic advance as percentage of mean. These results were also in agreement with the observations of Ahmadikhah [31]. On the other hand Okelola et al.[27], Ahmed et al., [32] and Ullah et al., [33] reported moderate GCV and PCV, high heritability and high genetic advance as percentage of mean for this trait and Chakraborty and Chakraborty [34] revealed moderate GCV and PCV, high heritability and moderate genetic advance as percentage of mean for this trait
Table 1. Analysis of variance of 12 yield and yield attributing traits
SOURCE DF
MEAN SQUARES
Height Tiller/plant flowering Days to Harvest index panicle Length seeds 1000 weight
Spikelet
/panicle %grain filling Spikelet density Spikelet/plant Panicle/ plant Grain yield REPLICATI
ON 4 11.37 0.64 18.25 42.30 4.78 0.63 219.96 26.00 1.17* 169548.9 2.46 29740.51
GENOTYPE 67 3592.90** 88.23** 7819.46** 615.80** 67.44** 122.93** 32313.93** 182.20** 37.91** 7402099.62** 84.88** 1415233.22**
ERROR 268 31.751185 2.08 10.01 18.97 1.96 0.98 136.18 14.10 0.34 71597.42 1.34 17571.42
[image:5.808.52.766.251.542.2]** indicates significance at 1% level of significant
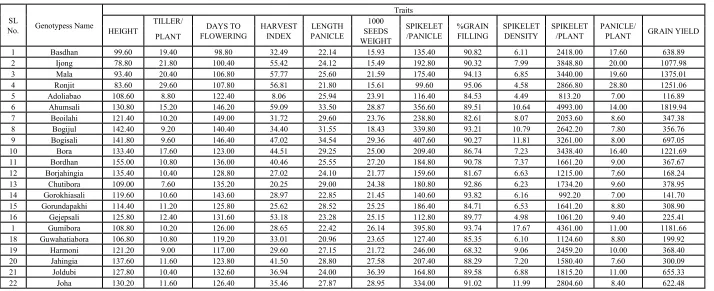
Table 2. Mean performance of 68 genotypes for 12 yield and yield attributing traits
SL
No. Genotypess Name
Traits
HEIGHT TILLER/ FLOWERING DAYS TO HARVEST INDEX PANICLE LENGTH SEEDS 1000 WEIGHT
SPIKELET
/PANICLE %GRAIN FILLING SPIKELET DENSITY SPIKELET/PLANT PANICLE/PLANT GRAIN YIELD PLANT
1 Basdhan 99.60 19.40 98.80 32.49 22.14 15.93 135.40 90.82 6.11 2418.00 17.60 638.89
2 Ijong 78.80 21.80 100.40 55.42 24.12 15.49 192.80 90.32 7.99 3848.80 20.00 1077.98
3 Mala 93.40 20.40 106.80 57.77 25.60 21.59 175.40 94.13 6.85 3440.00 19.60 1375.01
4 Ronjit 83.60 29.60 107.80 56.81 21.80 15.61 99.60 95.06 4.58 2866.80 28.80 1251.06
5 Adoliabao 108.60 8.80 122.40 8.06 25.94 23.91 116.40 84.53 4.49 813.20 7.00 116.89
6 Ahumsali 130.80 15.20 146.20 59.09 33.50 28.87 356.60 89.51 10.64 4993.00 14.00 1819.94
7 Beoilahi 121.40 10.20 149.00 31.72 29.60 23.76 238.80 82.61 8.07 2053.60 8.60 347.38
8 Bogijul 142.40 9.20 140.40 34.40 31.55 18.43 339.80 93.21 10.79 2642.20 7.80 356.76
9 Bogisali 141.80 9.60 146.40 47.02 34.54 29.36 407.60 90.27 11.81 3261.00 8.00 697.05
10 Bora 133.40 17.60 123.00 44.51 29.25 25.00 209.40 86.74 7.23 3438.40 16.40 1221.69
11 Bordhan 155.00 10.80 136.00 40.46 25.55 27.20 184.80 90.78 7.37 1661.20 9.00 367.67
12 Borjahingia 135.40 10.40 128.80 27.02 24.10 21.77 159.60 81.67 6.63 1215.00 7.60 168.24
13 Chutibora 109.00 7.60 135.20 20.25 29.00 24.38 180.80 92.86 6.23 1734.20 9.60 378.95
14 Gorokhiasali 119.60 10.60 143.60 28.97 22.85 21.45 140.60 93.82 6.16 992.20 7.00 141.70
15 Gorundapakhi 114.40 11.20 125.80 25.62 28.52 25.25 186.40 84.71 6.53 1641.20 8.80 308.90
16 Gejepsali 125.80 12.40 131.60 53.18 23.28 25.15 112.80 89.77 4.98 1061.20 9.40 225.41
1 Gumibora 108.80 10.20 126.00 28.65 22.42 26.14 395.80 93.74 17.67 4361.00 11.00 1181.66
18 Guwahatiabora 106.80 10.80 119.20 33.01 20.96 23.65 127.40 85.35 6.10 1124.60 8.80 199.92
19 Harmoni 121.20 9.00 117.00 29.60 27.15 21.72 246.00 68.32 9.06 2459.20 10.00 368.40
20 Jahingia 137.60 11.60 123.80 41.50 28.80 27.58 207.40 88.29 7.20 1580.40 7.60 300.09
21 Joldubi 127.80 10.40 132.60 36.94 24.00 36.39 164.80 89.58 6.88 1815.20 11.00 655.33
23 Johabora 112.00 9.80 120.40 41.62 29.00 23.55 212.60 87.38 7.35 2081.80 9.80 421.81
24 Kolajoha 102.40 14.60 134.20 27.11 20.54 25.22 212.80 91.75 10.36 1871.00 8.80 381.18
25 Kolapakhi 138.20 16.40 139.40 32.63 23.57 15.43 202.80 88.06 8.60 2713.80 13.40 494.89
26 Konjoha 149.40 11.00 115.80 50.34 27.05 26.03 196.40 87.58 7.35 2904.00 14.80 982.10
27 Katibora 123.00 11.60 126.00 31.37 29.80 10.45 447.80 91.49 15.03 4477.00 10.00 429.33
28 Khoiron 133.40 11.40 135.00 52.20 18.62 22.24 213.40 88.97 11.54 2089.80 9.80 408.95
29 Laudubi 138.20 9.40 139.80 39.02 20.36 22.44 366.40 92.56 18.01 3591.60 9.80 736.30
30 Malbhug 117.20 15.60 121.00 55.63 28.16 29.31 222.00 90.25 7.88 1739.40 7.80 366.49
31 Manuharsali 135.20 11.40 114.40 53.57 27.60 27.12 356.00 85.25 12.93 4769.20 13.40 1479.38
32 Memlahi 136.00 11.60 124.40 58.30 33.60 24.54 335.00 92.26 9.97 3681.00 11.00 919.84
33 Monlohi 149.20 9.80 130.20 24.20 26.05 25.88 210.40 79.25 8.08 1557.20 7.40 238.87
34 Moubora 121.80 10.00 115.00 18.26 32.24 35.86 333.40 97.36 10.34 3267.20 9.80 1119.94
35 Nolsitiki 140.20 12.80 138.20 24.52 21.77 28.44 130.00 92.40 5.98 981.60 7.60 198.38
36 Nania 107.20 13.00 137.80 39.66 32.85 22.15 194.40 72.99 5.92 2299.00 11.80 449.42
37 Nekera 117.80 12.00 128.60 41.76 32.10 21.17 285.80 94.93 8.91 3257.00 11.40 748.60
38 Niokadam 128.20 11.40 145.40 36.01 32.67 22.11 408.00 96.43 12.49 3426.00 8.40 615.54
39 Pakhoribora 134.00 11.00 136.20 28.02 28.52 40.86 186.80 90.41 6.55 1826.80 9.80 661.82
40 Rongabora 104.40 14.40 125.40 33.69 28.26 25.15 192.60 81.41 6.94 2038.40 10.60 442.40
41 Rongajoha 133.40 11.40 134.60 31.91 28.12 24.02 190.60 70.05 6.81 2260.20 11.80 480.12
42 Sokuwa 118.00 11.80 118.20 42.00 23.62 21.22 227.40 90.48 9.69 2227.40 9.80 419.54
43 Solpuna 134.00 10.20 120.80 33.42 29.00 28.80 232.80 93.36 8.09 2046.00 8.80 484.66
44 Sorujahingia 149.60 11.60 134.40 34.89 28.42 21.55 206.60 89.68 7.24 1627.00 7.80 250.83
45 Sowagmoni 148.40 14.20 143.20 51.18 24.90 20.01 219.40 83.43 8.83 2197.60 10.00 367.99
46 Sunmoni 110.40 12.00 115.80 34.50 25.80 26.64 214.80 91.31 8.38 2703.80 12.60 826.39
47 Tilbora 136.20 11.60 136.20 42.18 27.40 26.22 235.40 83.93 8.59 2592.20 11.00 629.71
48 Titaphuliabora 153.00 11.60 144.60 41.24 26.92 26.20 246.80 83.90 9.17 2416.20 9.80 523.77
49 Torawali 117.00 12.20 134.00 29.66 24.90 30.35 282.00 93.02 11.34 2706.00 9.60 732.54
50 Vasmoti 129.60 14.60 112.60 25.25 25.80 22.76 142.40 86.60 5.52 1481.80 10.40 307.42
51 Amanabao 200.00 20.80 212.40 42.04 26.67 14.81 145.00 85.23 5.44 1859.80 12.80 302.08
52 Bhuibao 198.40 14.80 198.40 16.64 27.65 23.52 367.80 94.06 13.31 6766.80 18.40 2757.82
53 Dolbao 217.80 13.60 220.40 28.45 28.30 21.02 265.60 85.46 9.39 2865.20 10.80 557.05
54 Happybao 196.00 14.60 207.00 31.84 33.67 24.12 232.80 91.67 6.92 2562.80 11.00 625.39
55 Kokuwabao 171.80 28.80 226.20 38.20 26.75 24.38 252.40 87.79 9.45 3989.20 15.80 1350.31
56 Maguribao 187.40 14.60 210.40 38.21 32.30 22.78 222.60 76.75 6.90 5530.40 25.00 2414.10
57 Miabao 166.60 15.20 219.00 33.73 33.06 24.54 304.60 88.63 9.22 3590.80 11.80 934.43
58 Negheribao 168.20 17.80 209.00 29.96 33.74 25.27 326.40 81.64 9.68 4116.60 12.60 1070.98
59 Panidhan 153.00 16.20 215.00 22.99 29.80 21.69 306.00 88.00 10.27 4536.60 14.80 1308.41
60 Panikakuwa 159.20 18.40 222.40 34.61 28.80 22.51 249.00 89.32 8.65 3436.20 13.80 956.62
61 Bejilahi 133.40 11.00 68.20 34.50 28.42 24.03 313.20 94.59 11.01 5251.20 16.80 2004.10
62 Betguti 120.00 8.60 74.60 18.44 29.12 25.68 242.00 89.29 8.33 2086.60 8.60 415.42
63 Borguni 120.40 9.80 65.60 23.76 25.30 19.04 157.40 80.89 6.22 1168.00 7.40 133.56
65 Kopouguni 128.60 12.40 76.00 24.09 25.35 18.44 140.40 78.40 5.54 1377.60 9.80 200.48
66 Maiguni 103.20 11.00 80.00 30.40 25.37 18.30 280.60 87.16 11.05 2525.20 9.00 362.33
67 Ronga-ahu 117.00 9.20 73.20 27.63 27.67 23.96 206.00 74.81 7.44 1728.20 8.40 261.02
68 Rongadoria 130.80 11.00 66.60 41.24 27.85 17.40 293.40 90.06 10.54 2872.80 9.80 442.21
Mean 132.70 13.00 134.16 35.73 27.28 23.77 237.22 87.71 8.69 2661.60 11.30 680.81
C.V. 4.25 11.09 2.36 12.19 5.13 4.17 4.92 4.28 6.76 10.05 10.20 19.47
Minimum 78.8 7.6 65.6 8.06 18.62 10.45 99.6 68.32 4.49 813.2 7 116.89
Maximum 217.8 29.6 226.2 59.09 34.54 40.86 447.8 97.36 18.01 6766.8 28.8 2757.82
S.E. 2.52 0.64 1.42 1.95 0.63 0.44 5.22 1.68 0.26 119.66 0.52 59.28
C.D. 5% 7.02 1.80 3.94 5.42 1.74 1.23 14.53 4.68 0.73 333.19 1.44 165.06
[image:7.808.54.751.72.464.2]C.D. 1% 9.25 2.37 5.19 7.15 2.30 1.63 19.15 6.16 0.96 439.03 1.89 217.50
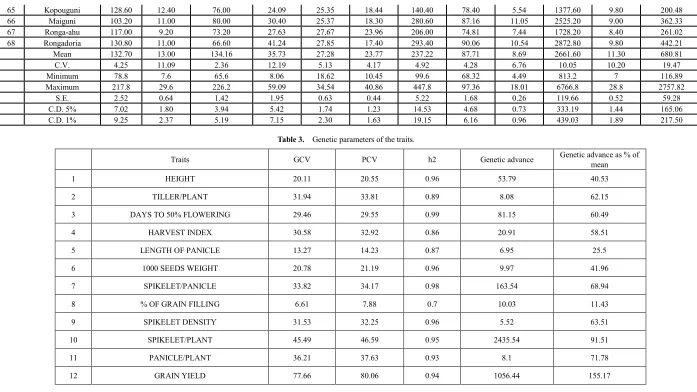
Table 3. Genetic parameters of the traits.
Traits GCV PCV h2 Genetic advance Genetic advance as % of mean
1 HEIGHT 20.11 20.55 0.96 53.79 40.53
2 TILLER/PLANT 31.94 33.81 0.89 8.08 62.15
3 DAYS TO 50% FLOWERING 29.46 29.55 0.99 81.15 60.49
4 HARVEST INDEX 30.58 32.92 0.86 20.91 58.51
5 LENGTH OF PANICLE 13.27 14.23 0.87 6.95 25.5
6 1000 SEEDS WEIGHT 20.78 21.19 0.96 9.97 41.96
7 SPIKELET/PANICLE 33.82 34.17 0.98 163.54 68.94
8 % OF GRAIN FILLING 6.61 7.88 0.7 10.03 11.43
9 SPIKELET DENSITY 31.53 32.25 0.96 5.52 63.51
10 SPIKELET/PLANT 45.49 46.59 0.95 2435.54 91.51
11 PANICLE/PLANT 36.21 37.63 0.93 8.1 71.78
3.2. Tillers per Plant
Tiller trait in rice is a major determinant for panicle production [35, 36] and as a result, it affects total yield [37]. The genotypes, which produced higher number of effective tillers per plant showed higher grain yield in rice [38, 39].
The trait tillers per plant showed high GCV-PCV, high heritability and high genetic advance as percentage of mean (Table III) indicating the effect of additive gene on this trait. Thus, this trait may be used directly as selection index in plant improvement program. The PCV was higher than corresponding GCV in this trait also. This implies that this trait was also under the influence of environment. Sinha, et al., [40] and Padmaja et al., [41] also found similar results. Singh et al., [42] found moderate coefficients of variation for this trait. Anbanandan et al., [43] and Prajapati et al.,[28] reported high heritability and high genetic advance as percentage of mean for this trait. Ahmad et al., [32] reported moderate GCV-PCV, high heritability and high genetic advance and Bisne et al., [44] reported moderate heritability for this trait. High genetic advance for tillers per plant was also recorded by Kuldeep et al., [45] and Karthikeyan et al.,[46].
3.3. Days to 50% Flowering
High phenotypic and genotypic variances were exhibited by days to 50% flowering (Table III) and these results were in agreement with the observations of Sawant et al. [47]; Padmaja et al., [41] and Prajapati et al., [28]. Genotypic and phenotypic coefficients of variation were high and PCV was higher than corresponding GCV for this trait but is noteworthy that the differences between GCV and PCV values were minimum implying least influence of environment. This result is in accordance with the finding of Shahidullah et al.,[48]. The broad sense heritability, genetic advance and genetic advance as percentage of mean were also high indicating the governance of additive genes for this character. This implies that phenotypic selection on the basis of this character will be adequate to bring about desirable improvement. Moderate GCV-PCV, high heritability and moderate genetic advance for days to 50% flowering were found by Ahmed et al., [32] and Prajapati et al., [28] and moderate GCV-PCV, high heritability and high genetic advance were reported by Vange [49]. Bisne et al., [44] also reported moderate genetic advance for this trait.
3.4. Harvest Index
Harvest index is a vital character having physiological importance. It reflects translocation on alternatively dry matter partitioning of a given genotype to the economic parts. This trait showed high GCV and PCV indicating prominent variation among the genotypess for the trait. PCV was higher than their corresponding GCV which implies that the variation is not only due to genotypes but also due to the influence of environment. Estimates of heritability, genetic advance and genetic advance as percentage of mean for the
trait were also high. This feature suggested that the environmental influence on the phenotypic expression of this character was not apparent and the phenotypic expression of this trait was true representation of the genetic makeup. Therefore selection based on this character would be effective. These results coincide with the findings of Karim
et al., [50] and Bisne et al.[44]. Prajapati et al., [28] also found high GCV and PCV, heritability and genetic advance for the trait harvest index. Whereas Habib et al., [51] and Ahmed et al.,[32] reported moderate genotypic and phenotypic coefficients of variation, high heritability and high genetic advance as percentage of mean for this trait.
3.5. Length of Panicle
Panicle length showed moderate genotypic and phenotypic coefficients of variation, high heritability, low genetic advance and high genetic advance as percentage of mean (Table III) which was in accordance with the findings of Vange et al.,[49]. This indicates that although the variation is not so apparent still there is an opportunity to improve this trait through selection. The difference between genotypic and phenotypic coefficients of variation was negligible indicating little influence of environment. Prajapati et al.,[28] also observed moderate GCV and PCV, high heritability and moderate genetic advance as percentage of mean for this trait. Ahmadikhah [31] also observed high heritability for this trait. On the other hand, Habib et al.,[51] reported low GCV and PCV and high heritability, Bisne et al.,[44] observed high heritability and moderate genetic advance, Shahidullah et al., [48] low GCV and PCV, Chakraborty and Chakraborty [34] reported low heritability and low genetic advance as percentage of mean and Singh et al.,[52] reported low GCV PCV and low genetic advance as percentage of mean for this trait.
3.6. 100- Seeds Weight
genetic advance as percentage of mean.
3.7. Spikelet per Panicle
Spikelet per panicle is an important character contributing to grain yield. According to Kusutani et al., [38] and Dutta et al., [39] genotypes which produced higher number of grains per panicle showed higher grain yield in rice. Coefficients of variability observed at both phenotypic and genotypic level were high for the character spikelet per plant indicating apparent variation among the genotypes for this trait. The phenotypic coefficient of variation was higher than corresponding genotypic coefficient of variation. However a close proximities between GCV and PCV, gave evidence that the variability existing in each genotypes was mainly due to their genetic makeup. Estimates of heritability and genetic advance as percentage of mean were also high for this trait. Thus it can be interpreted that this trait was controlled by additive gene action and hence can be improved through simple selection methods. Similar results were also observed by Vange [49] Prajapati et al.[28], Ullah
et al., [33] and Singh et al.,[52]. Lal and Chauhan [30] reported high GCV and PCV and high genetic advance and Mustafa and Elsheikh, [56] observed high genotypic and phenotypic coefficient of variation for the trait spikelets per panicle.
3.8. Percentage of Viable Seeds
The trait percentage of viable seeds showed low GCV-PCV, high heritability, moderate genetic advance and moderate genetic advance as percentage of mean (Table III) in the present study. It revealed that non-additive gene action was involved for expression of this character. The high heritability was exhibited due to the influence of favourable environment rather than genotype and selection for such trait might not be rewarding. Hence this trait may not be useful as a criterion for selection for increased grain yield. Karim et al., [50] reported high GCV and PCV, moderate heritability and high genetic advance as percentage of mean for this trait.
3.9. Spikelet Density
This trait showed high GCV PCV, high heritability and high genetic advance as percentage of mean (Table III) indicating the suitability of the trait as selection index in plant improvement program. Although phenotypic coefficient of variation was higher than corresponding genotypic coefficient of variation implying the influence of environment on the expression of the trait, the difference of GCV and PCV was negligible. It revealed that the genotypic variation contribute maximum to phenotypic variation and the environmental deviation had minor contribution for the trait. Ali et al., [57] observed Moderate variability, high heritability and high genetic advance as percentage of mean and Ahmed et al., [32] reported low GCV and PCV, moderate heritability and low genetic advance as percentage
of mean for spikelet density.
3.10. Spikelet per Plant
Genotypic and phenotypic coefficients of variations were high (Table III) indicating pronounced variation for the character. The phenotypic coefficient of variation was higher than genotypic coefficient of variation but the difference was negligible. This feature suggested that the environmental influence was not considerable and the variation of genotypes regarding this trait was mainly due to genetic makeup. The heritability and genetic advance as percentage of mean were also high. This suggested the feasibility of genetic improvement of this trait under low selection pressure. Lal and Chauhan [30] reported moderate genotypic and phenotypic coefficient of variation for this trait.
3.11. Panicles per Plant
Panicles per plant registered high genotypic and phenotypic coefficients of variability (Table III) and this result was in agreement with the earlier observations of Karim et al., [50] and Singh et al., [52]. This indicated the presence of substantial amount of genetic variability for the trait in the study material and there is scope for selection. The PCV was slightly higher than GCV which implies less influence of environment on the trait. As genetic variability remains unaffected by environmental conditions, this type of variability was more useful for genetic improvisation through selection or hybridization. This character also showed high heritability and high genetic advance as percentage of mean, and this is in compliance with the findings of Prajapati et al., [28]. Thus it can be interpreted that the trait panicles per plant might be controlled by additive gene action, which could be improved through simple selection methods. Karim et al., [50] and Lal and Chauhan [30] also reported high genetic advance as percentage of mean. On the other hand, Habib et al., [51] reported moderate GCV and PCV, moderate heritability and moderate genetic advance as percentage of mean and Ullah
et al., [33] observed moderate genotypic and phenotypic coefficients of variation, high heritability and moderate genetic advance as percentage of mean for this trait.
3.12. Grain Yield
The estimates of heritability and genetic advance as percentage of means were also high for this trait suggesting preponderance of additive gene action in expression of this character. The presence of additive genetic variance offers immense opportunity for exploitation of heterosis. These results were in accordance with the findings of Das et al.,
[58], Kumar et al.,[55], Habib et al., [51], Anbanandan et al.,[43], Bisne et al.,[44] and Ullah et al.,[33]. Vange, [49] reported high genotypic and phenotypic coefficients of variation, moderate heritability and high genetic advance as percentage of mean, while Mustafa and Elsheikh [56] and Prajapati et al., [28] observed high GCV and PCV, high heritability and moderate genetic advance.
The order of genetic variability for different yield attributing characters was as follows, grain yield > spikelets per plant > panicles per plant > spikelets per panicle > tillers per plant > harvest index > spikelet density > days to 50% flowering > 1000 seeds weight > height > length of panicle >percentage of viable seeds.
4. Conclusions
Estimated heritability value alone is less reliable as these values are prone to alter with change in the environment and experimental material (Swarup and Changale [59]. Hence, the use of heritability values coupled with genetic advance would be more reliable than heritability alone. In the present investigation, along with high genetic variability, high heritability coupled with high genetic advance as percentage of mean were observed for traits viz. tillers per plant, days to 50% flowering, harvest index, spikelets per panicle, spikelet density, spikelet per plant, panicles per plant and grain yield. Thus these traits are most probably controlled by additive gene action and hence these traits can be fixed by selection. Based on the above results, it is suggested that the characters with high genotypic variability would be responsive to selection in the positive direction.
REFERENCE
[1] Ivy N.A., Uddin M.S., Sultana R. and Masud M.M. 2007. Genetic divergence in maize (Zea mays L.). Bangladesh J. Breed. Genet. 20(1): 53-56.
[2] Mondal M.A.A., Hossain M.M., Rasul M.G. and Uddin M.S. 2007. Genetic diversity analysis in Potato (Solanum tuberosum L.). Bangladesh J. Bot. 36(2): 121-125.
[3] Haydar A, Ahmed M.B., Hannan M.M., Razvy M.A., Mandal M.A., Salahin M., Karim R. and Hossain M. 2007. Analysis of Genetic Diversity in Some Potato Varieties Grown in Bangladesh. Middle-East J. Scientific Res. 2(3-4): 146-148. [4] Hittalmani S., Huang N., Courtois B., Venuprasad R.,
Shashidhar H.E., Zhuang J.Y., Zheng K.L., Liu G.F., Wang G.C., Sidhu J.S., Srivantaneeyakul S., Singh V.P., Bagali P.G., Prasanna H.C., McLaren G. And Khush G.S. 2003.
Identification of QTL for growth and grain yield related traits in rice across nine locations of Asia. Theor. Appl. Genet. 107: 679-690.
[5] Dudley J.W. and Moll R.H. 1969. Interpretation and use of estimates of heritability and genetic variances in plant breeding. Crop Sci. 9(3):257-262.
[6] Marwede V., Schierholt A., Moilers C. and Becker H.C. 2004. Genotype x environment interactions and heritability of Tocopherol contents in Canoloa. Crop Sci. 44(3): 728-731. [7] Rafi S.A., and Nath U.K. 2004. Variability, Heritability,
Genetic Advance and relationship of yield and yield contributing characters in dry Bean (Phaselous vulgaris L.). J. BioI. Sci. 4(2): 157-159.
[8] Johnson H.W., Robinson H.F. and Comstock R.E. 1955. Estimation of genetic and environmental variability in soybeans. Agron. J., 47: 314-318.
[9] Iqbal S., Mahmood T., Tahira, Ali, M., Anwar M. and Sarwar M. 2003. Path coefficient analysis in different genotypes of soyabean (Glycine max L.). Pak. J. BioI. Sci. 6(12):1085-1087.
[10] Rohman M.M., Iqbal A.S.M., Arifin M.S., Akhtar Z. and Husanuzzaman M. 2003. Genetic variability, correlation and Path analysis in Mungbean. Asian J. Plant Sci. 2(17-24): 1209-I211.
[11] Yoshida S. 1981. Fundamentals of rice crop science. IRRI. Los Banos, Philippines, Manila. pp.267.
[12] Chang, T. T., and E. A. Bardenas. 1965. The morphology and varietal characteristics of the rice plant. IRRI Tech. Bull. 4. pp.20.
[13] Datta S.K. 1981. Principles and Practices of Rice Production. Published by John Wiley and Sons. New York, pp.34. [14] Snedecor G.W. and Cochran W.G. 1967. Statistical methods.
VI Edition, published by Oxford and IBH Publishing Co. Culcutta, pp. 135-198.
[15] Panse V.G. and Sukhatme P.V. 1985. Statistical Methods for Agricultural Workers, 2nd edition, Indian Council of Agricultural Research Publication, New Delhi.
[16] Fisher R.A. and Yates F. 1963. Statistical tables for biological, agricultural and medical research, (6th edition) Oliver and Boyd publisher, Edinburg. pp.48-62.
[17] Lush J.L. 1949. Heritability of quantitative characters in farm animals. Proceedings of 8th Congress of Genetics and Heredities, 35: 356-375.
[18] Choudhary L.B. and Prasad B. 1968. Genetic variation and heritability of quantitative characters in Indian mustard II. Indian J. Agri. Sci., 38: 820-825.
[19] Burton G. W. and Davane E. M. 1952. Estimating heritability in tall fescue (Festuca arundiancea L.) from replicated clonal material. Agron. J., 45: 478-481.
[20] Sivasubramanian S. and Menon M. 1973. Heterosis and inbreeding depression in rice. Madras Agril. J., 60: 1139-1144.
[22] Robinson H.F., Comstock R.E. and Harvery P.H. 1951. Genotypic and phenotypic correlations in corn and their implication in selection. Agron. J., 43: 282-287.
[23] Prasad B., Patwari A.K. and Biswas P.S. 2001. Genetic Variability and selection criteria in fine grain rice (Oryza sativa). Pakistan J. Bio. Sci. 4(10):1188-1190.
[24] Mohammad T., Deva W. and Ahmad Z. 2002. Genetic variability of different plant and yield characters in rice. Sarhad J. Agric., 18: 207– 210.
[25] Huang, N., Courtois B., Khush G.S., Lin H.X., Wang G.L., Wu P. and Zheng K. 1996. Association of quantitative trait loci for plant height with major dwarfing genes in rice. Heredity, 77(2): 130–137.
[26] Ashrafuzzaman M., Islam M.R., Ismail M.R., Shahidullah S.M. and Hanafi M.M. 2009. Evaluation of six aromatic rice varieties for yield and yield contributing characters. Int. J. Agric. Biol., 11(5): 616–620.
[27] Okelola F. S., Adebisi M. A., Kehinde O. B., Oluwole A.M. 2007. Genotypic and phenotypic variability for seed vigour traits and seed yield in West African rice (Oryza sativa L.) genotypes. Am J. Sci., 3(3):34-41.
[28] Prajapati M. K., Singh C.M., Suresh Babu G., Roopa Lavanya, G. and Jadhav P. 2011. Genetic parameters for grain yield and its component characters in rice. Electron. J. Pl. Breed., 2(2):235-238.
[29] Pal Atanu K. and Sabesan T. 2010. Studies on genetic variability for lodging related traits in rice (Oryza sativa L.) Electron. J. Pl. Breed., 1(3):301-304.
[30] Lal Mohan and Chauhan Devendra K. 2011: Studies of genetic variability, heritability and genetic advance in relation to yield traits in rice, Agricultural Science Digest - A Research Journal. 31(3):220-222.
[31] Ahmadikhah A. 2010. Study on selection effect, genetic advance and genetic parameters in rice. Ann. Bi. Res., 1(4): 45-51.
[32] Ahmad H., Razvi S.M., Ashraf Bhat A., Najeeb S., Wani N., Habib M., Mir M.R. and Gupta B.B. 2010. Genetic variability and genetic divergence of important rice (Oryza sativa L.) varieties. Int. J. Curr. Res. 4:033-037.
[33] Ullah M.Z., Bashar M.K., Bhuiyan M.S.R., Khalequzzaman M. and Hasan M.J. 2011. Interrelationship and Cause-effect Analysis among Morpho-physiological Traits in Biroin Rice of Bangladesh. Int. J. Plant Breed. Genet., 5(3): 246-254. [34] Chakraborty R. and Chakraborty S. 2010. Genetic variability
and correlation of some morphometric traitswith grain yield in bold grained rice (Oryza sativa L.) gene pool of Barak valley. Am. Eurasian J. Sustain. Agric. 4(1): 26-29.
[35] Miller B.C., Hill J.E. and Roberts S.R. 1991. Plant population effects on growth and tied in water-seeded rice. Agron. J., 83(2): 291–297.
[36] Smith C.W. and Dilday R.H. 2003. Rice: Origin, history, technology, and production, 1st ed. Published by John Wiley & Sons, Inc., Hoboken, New Jersey.
[37] Gallagher J.N. and Biscoe P.V. 1978. Radiation absorption, growth and yield of cereals. J. Agric. Sci., 91: 47–60.
[38] Kusutani A., Tovata M., Asanuma K. and Cui J. 2000. Studies on the varietal differences of harvest index and morphological characteristics of rice. Japanese J. Crop Sci., 69: 359–364. [39] Dutta R.K., Baset Mia M.A. and Khanam. S. 2002. Plant
architecture and growth characteristics of fine grain and aromatic rices and their relation with grain yield. IRC Newslett., 51: 51–56.
[40] Sinha S. K., Tripathi A. K and Bisen 2004. Study of genetic variability and correlation coefficient analysis in midland landraces of rice. Annal of Agric. Res. 25(1): 1-3.
[41] Padmaja D., Radhika K., Subba Rao L.V. and Padma V. 2008. Studies on variability, heritability and genetic advance for quantitative characters in rice (Oryza sativa L.). J. Plant Genet. Resour. 21(3): 196-198.
[42] Singh B., Mishra M.K. and Naik R.K. 2010. Genetic diversity among some traditional aromatic rice (Oryza Sativa L.) varieties of Orissa. Indian J. Agric. Res., 44(2):141 – 145. [43] Anbanandan V., Saravanan K. and Sabesan T. 2009.
Variability, heritability and genetic advance in rice (Oryza sativa L.). Int. J. Plant Sci., 4(1): 61-6
[44] Bisne R., Sarawgi K. and Verulkar S.B. 2009. Study of heritability, genetic advance and variability for yield contributing characters in rice Bangladesh J. Agril. Res., 34(2): 175-179.
[45] Kuldeep T., Kumar B., Ramesh B. and Tomar A. 2004. Genetic variability and correlation of some seedling and plant trait in 70 genotypes of rice. Res. on Crops. 5(1):60-65. [46] Karthikeyan P., Anbuselvam Y., Elangaimannan R. and
Venkatesan M. 2010. Variability and heritability studies in rice (Oryza sativa L.) under coastal salinity. Electronic J. Pl. Breed., 1(2): 196-198.
[47] Sawant D.S., Patil S.L. and Bhave S.G. 1994. Variability, heritability and genetic advance in pure line of low land rice. Annals of Agric. Res. 15(1): 27-30.
[48] Shahidullah S.M., Hanafi M.M., Ashrafuzzaman M., Razi Ismail M. and Salam M.A. 2009. Phenological characters and genetic divergence in aromatic rices. Afr. J. Biotechnol.. 8(14):3199-3207.
[49] Karim D., Sarkar U., Siddique M.N.A., Khaleque Miah M. A. and Hasnat M. Z. 2007. Variability and Genetic Parameter Analysis in Aromatic Rice. Int. J. Sustain. Crop Prod. 2(5):15-18.
[50] Vange T. 2009. Biometrical studies on genetic diversity of some upland rice (Oryza sativa L.) accessions. Nature and Science, 7(1): 21-27.
[51] Habib S.H., Bashar M.K., Khalequzzaman M., Ahmed M.S. and Rashid E.S.M.H. 2005. Genetic analysis and morpho-physiological selection criteria for traditional Biroin Bangladesh rice germplasms. J. Bio. Sciences, 5(3): 315-318. [52] Singh S. K., Singh, C. M. and Lal G. M. 2011. Assessment of genetic variability for yield and its component characters in rice (Oryza sativa L.). Res. Plant Bio., 1(4): 73-76.
[54] Choudhury P. K. D. and Das P.K. 1997. Genetic variability, correlation and path analysis in deep water rice. J. Agril. Sci. Soc. 10(1): 155-157.
[55] Kumar M., Sharma P.R., Krakash N. and Singh P.K. 2009. Selection criteria for high yielding genotypes in early generations of rice. SAARC J. Agri.,7(2):37-42.
[56] Mustafa M.A. and Elsheikh M.A.Y. 2007. Variability, correlation and path co-efficient analysis for yield and its components in rice. Afr. Crop Sci. J., 15(4): 183-189. [57] Ali S.S., Jafri S., Khan T.Z., Mahmood A. and Butt M.A.
2000. Heritability of yield and yield components of rice. Pak J. Agric. Res., 16(2): 70-74.
[58] Das R.K., Islam M.A., Howlader M., Ibrahim S.M., Ahmed H.U. and Miah N.M. 1992. Variability and genetic association in upland rice (Oryza sativa L.). Bangladesh J. Plant. Genet. 5: 51-56.