Isolation and Screening of Cellulose Hydrolyzing Bacteria
from Different Ecological Niches
Anita Saini
1, Neeraj K Aggarwal
1,*, Anita Yadav
21Department of Microbiology, Kurukshetra University, India 2Department of Biotechnology, Kurukshetra University, India
Copyright©2017 by authors, all rights reserved. Authors agree that this article remains permanently open access under the terms of the Creative Commons Attribution License 4.0 International License
Abstract
371 bacteria were isolated from different ecological niches. Cellulolytic potential of the isolates was evaluated by qualitative as well as quantitative screening methods. 124 bacterial cultures showed production of zone of hydrolysis in the plate assay method. The hydrolytic potential of the isolates measured in terms of cellulolytic index indicated that 84 isolates showed cellulolytic index (CI) values between 1 and 4, 22 isolates between 4 to 6 and 18 isolates in the range of 6 to 13. The positive isolates withCI values ≥4.0 were screened quantitatively for the production of cellulases, determined as carboxy methyl cellulase (CMCase) activity and filter paper activity (FPase). Comparison of the activities shown by the isolates with that recorded in the standard isolate of Cellulomonas fimi
indicated that large number of bacteria produced considerably high amounts of cellulases. The isolate NAB37 showed highest levels of CMCase (0.948±0.011 U/ml) as well as FPase (0.125±0.005 FPU/ml) activities. The cellulolytic potential of the bacteria can be exploited in various cellulases based applications including detergents, textile, paper and pulp, food and bioethanol industries.
Keywords
Bacteria, Cellulolytic, Cellulase, Screening, Ecological Niches1. Introduction
Cellulose is the most abundant organic polymer on earth [1]. It is commonly found in the plant cell walls and accounts for 50% of the dry weight of the plant biomass [2]. Wastes form agricultural and industrial sources accumulated in the environment present a huge reservoir of cellulose. The renewability of the cellulose makes it an attractive feedstock for the production of various value added products [3]. Utilization of the cellulosic wastes can be a promising strategy for both the management of solid wastes as well as the production of beneficial products [4]. The cellulose can be hydrolyzed to the fermentable sugar, the glucose, which
can be further used to produce bioethanol [5]. In nature, various microorganisms including bacteria and fungi are known to be able to carry out bioconversion of cellulose by producing cellulolytic enzymes known as cellulases [6, 7]. The cellulase system consist of three major enzymes; i.e., endoglucanase (endo-1,4-β-D-glucanase, EC3.2.1.4), exoglucanase (exo-1,4-β-D-glucan cellobiohydrolase, EC3.2.1.91), and β-glucosidase (β-D-glucoside glucanohydrolase, EC 3.2.1.21), which act together to hydrolyze cellulose completely [8]. Endoglucanases hydrolyze cellulose polymer internally at random sites producing dextrans of variable lengths. Cellobiohydrolases release cellobiose units (a disaccharide of two glucose molecules linked by a β-1,4 linkage making the repeating units of cellulose) from the chain ends; and the
β-glucosidases act on cellobiose units converting them to the glucose [9].
Bacteria are interesting microbial group for the faster production of cellulase because of their high growth rate compared to fungi, easy handling and adaptability to various genetic manipulations [2, 8, 10]. Reports have shown cellulases production by various bacteria belonging to the genera of Bacillus, Cytophaga, Cellvibrio, Cellulomonas, Pseudomonas and Micrococcus [10, 11]. The present study focuses on isolation of cellulose degrading bacteria from different habitats followed with evaluation of their cellulolytic potential.
2. Materials and Methods
2.1. Sample Collection
2.2. Isolation of Cellulose Degrading Bacteria
An enrichment technique was used for the isolation of cellulose degrading bacteria. For the enrichment, 1gm of the sample was inoculated in an enrichment medium, i.e., minimal salt medium (0.2% KH2PO4, 0.2% K2HPO4, 0.2% NH4NO3, 0.05% NaCl, 0.05% MgSO4.7H20, 0.001% Fe2SO4.7H2O, 0.001% MnSO4.H20, pH 7.0) supplemented with 1% cellulose powder and 1% pretreated lignocellulosic biomass (pretreated by soaking in O.5M NaOH solution at room temperature for 2h). The incubation was done at 30oC, at 120rpm for 4 days. The enriched samples were serially diluted and appropriate dilutions were spread plated on minimal salt medium containing 1% of pretreated lignocellulosic biomass. The plates were incubated at 30oC for 7-8 days till appearance of bacterial colonies.
2.3. Primary Screening of Cellulose Hydrolyzing Bacteria
The bacterial isolates obtained were grown on the minimal agar medium supplemented with 1% CMC (carboxymethyl cellulose) (pH 7.0) at 30oC for 4-5 days. The plates were then flooded with 0.1% Congo red dye solution followed with destaining using 1M NaCl solution [12]. The appearance of a zone of hydrolysis around the colonies indicates synthesis of extracellular cellulases by the microbes. The cellulolytic potential of the positive isolates was evaluated by measuring cellulolytic index (CI), i.e., ratio of diameter of zone of hydrolysis to the diameter of the colony.
2.4. Secondary Screening of Cellulolytic Bacteria
The positive isolates in the primary screening showing CI values from 4.0 to 13.0 were screened quantitatively for the production of cellulases in terms of CMCase (endoglucanase) and FPase (total cellulase). The cultures were activated in nutrient broth (pH 7.0) at 30oC, in shaking conditions at 120rpm. For enzyme production, 1 ml of the activated culture was inoculated in 25ml of Mandel’s Medium (modified) (pH 7.0) containing 0.1% peptone, 0.14% (NH4)2SO4, 0.2% KH2PO4, 0.03% urea, 0.03% MgSO4.7H2O and 1ml of trace element solution containing 5mg/L FeSO4.7H2O; 1.6 mg/L MnSO4,7H2O; 1.4 mg/L ZnSO4.7H2O and 2mg/L CoCl2. The incubation was done at 30oC at 180rpm for 4 days and the enzyme was extracted by centrifugation of the contents at 10,000rpm at 4oC for 15-20min followed with filtration through Whatman filter paper no.1. The filtrate obtained was used as the crude enzyme for further assays.
2.5. Enzyme Assays
The crude enzyme extracts were assayed for CMCase (endoglucanase) and FPase (total cellulase) activities using method by Ghose et al [13]. The reaction mixture for CMCase assay consisted of 0.5ml of appropriately diluted crude enzyme extract and 0.5 ml of substrate (1% CMC prepared in 100mM sodium acetate buffer, pH 4.8). The reaction mixture for FPase assay was containing 0.5ml of enzyme and 0.5ml of 100mM sodium acetate buffer (pH 4.8)
along with 50mg (1x6cm) of Whatman filter paper no.1. The contents were incubated at 50oC for 10 min and 30 min for CMCase abd FPase assays respectively. The amount of reducing sugars released was determined by DNS method [14]. The CMCase activity was expressed in U/ml. One unit (IU) of enzyme activity is defined as the amount of enzyme required to release 1µmol of glucose in the reaction mixture per minute under specified conditions. The FPase activity was expressed as FPU/ml. One unit of filter paper (FPU) activity is defined as the amount of enzyme required to release 1µmol of reducing sugar from filter paper per ml per minute.
3. Results and Discussion
3.1. Isolation and Primary Screening of Bacterial Isolates
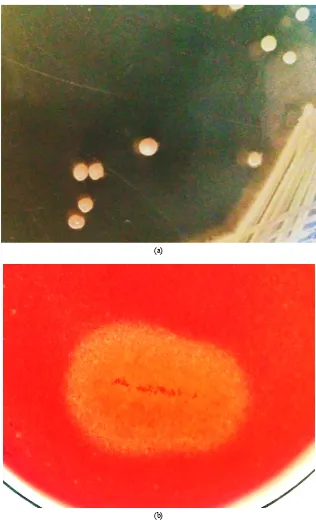
Total 371 isolates were obtained from different samples. Primary or qualitative screening by Congo red plate assay method showed 124 of them producing zone of hydrolysis. The halo around the colonies indicates production of extracellular cellulases by them. As evident from the varying diameter of zone of hydrolysis shown by different isolates, the cellulolytic potential of the isolates was different. 84 isolates showed CI values in the range of 1.0 to 4.0. 22 isolates showed CI values from 4.0 to 6.0, while 18 isolates gave CI values in the range of 6.0 to 13.0 (Figure 1). Table 1 shows the results of qualitative screening of the isolates along with the CI values estimated for them. Among all isolates, the bacterial culture NAB37 produced largest zone of hydrolysis showing CI value of 13.0±0.32 (Figure 2), followed with NAB25 (CI=12.0±0.26) and NAB3 (CI=11.0±0.31).
Figure1. Cellulolytic Indices of cellulase positive bacteria
3.2. Secondary Screening of Bacterial Isolates
Results of the quantitative screening of different bacterial isolates (with CI values in the range of 4.0 to 13.0) were compared with that shown by the standard isolate,
close to that of the standard culture (C. fimi) indicating considerably high cellulolytic potential of the isolates (Figure 3). Among all isolates, NAB37 isolated from rock soil showed highest CMCase (0.948±0.011 U/ml) activity.
The isolate NAB3 was the second largest endoglucanase producer showing CMCase value of 0.587±0.009 U/ml. NAB27 produced 0.442±0.007 U/ml of CMCase, while NAB16 produced 0.364±0.008 U/ml of endoglucanase.
(a)
[image:3.595.146.462.132.657.2](b)
Table 1. Qualitative Screening of Cellulolytic Bacteria & their CI values
S. No. Isolate Source CI value S. No. Isolate Source CI value
1 NAB 1 Waste Land Soil, Haryana 4.0 ± 0.16 21 NAB 21 Decaying Wood, Haryana 4.0 ± 0.11
2 NAB 2 Waste Land Soil, Haryana 5.0 ± 0.14 22 NAB 22 Decaying Wood, Haryana 4.0 ± 0.17
3 NAB 3 Waste Land Soil, Haryana 11.0 ± 0.31 23 NAB 23 Termite infested wood, Haryana 5.0 ± 0.17
4 NAB 4 Waste Land Soil, Haryana 4.0 ± 0.14 24 NAB 24 Termite infested wood, Haryana 4.0 ± 0.12
5 NAB 5 Decaying Haryana Aloevera plant, 8.0 ± 0.26 25 NAB 25 Termite infested wood, Haryana 12.0 ± 0.26
6 NAB 6 Soil near textile industry, Uttar Pradesh 5.0 ± 0.21 26 NAB 26 Termite infested wood, Haryana 4.0 ± 0.18
7 NAB 7 Soil near textile industry, Uttar Pradesh 7.0 ± 0.25 27 NAB 27 Garden Sol, Uttar Pradesh 6.0 ± 0.17
8 NAB 8 Soil near textile industry, Uttar Pradesh 7.0 ± 0.23 28 NAB 28 Decaying wood, Himachal Pradesh 4.0 ± 0.12
9 NAB 9 Cow Dung Pile, Harsyana 8.0 ± 0.29 29 NAB 29 Decaying wood, Himachal Pradesh 4.0 ± 0.13
10 NAB 10 Cow Dung Pile, Haryana 5.0 ± 0.13 30 NAB 30 Decaying wood, Himachal Pradesh 5.0 ± 0.16
11 NAB 11 Kitchen Garden Soil, Haryana 9.0 ± 0.26 31 NAB 31 Wetland Soil, Himachal Pradesh 4.0 ± 0.11
12 NAB 12 Kitchen Garden Soil, Haryana 13.0 ± 0.14 32 NAB 32 Wetland Soil, Himachal Pradesh 6.0 ± 0.13
13 NAB 13 Kitchen Garden Soil, Haryana 5.0 ± 0.17 33 NAB 33 Rock Soil, Himachal Pradesh 4.0 ± 0.11
14 NAB 14 Decaying Vegetation, KUK, Haryana 4.0 ± 0.11 34 NAB 34 Rock Soil, Himachal Pradesh 4.0 ± 0.12
15 NAB 15 Decaying Vegetation, KUK, Haryana 4.0 ± 0.18 35 NAB 35 Rock Soil, Himachal Pradesh 5.0 ± 0.16
16 NAB 16 Decaying Vegetation, KUK, Haryana 9.0 ± 0.27 36 NAB 36 Rock Soil, Himachal Pradesh 7.0 ± 0.20
17 NAB 17 Agricultural Field Soil, Haryana 5.0 ± 0.19 37 NAB 37 Rock Soil, Himachal Pradesh 13.0 ± 0.32
18 NAB 18 Agricultural Field Soil, Haryana 5.0 ± 0.18 38 NAB 38 Kitchen Garden Soil, Haryana 8.0 ± 0.21
19 NAB 19 Agricultural Field Soil, Haryana 8.0 ± 0.20 39 NAB 39 Kitchen Garden Soil, Haryana 11.0 ± 0.26
20 NAB 20 Agricultural Field Soil, Haryana 6.0 ± 0.12 40 NAB 40 Compost, Haryana 8.0 ± 0.22
Figure 3. CMCase activities shown by different bacterial isolates (a. NAB1 to NAB20; b. NAB21 to NAB40)
[image:5.595.75.536.310.731.2]Different isolates exhibited different FPase activity. 23 isolates showed FPase activities higher than or close to that recorded for C. fimi (Figure 4). NAB37 showed highest FPase production, i.e., 0.125±0.005 FPU/ml. The bacterial isolate NAB34 showed FPase value of 0.089±0.003 FPU/ml, while FPase value was considerably low in all other isolates. However, FPase values recorded in the cultures were comparable to that observed in the standard isolate, which indicates high cellulases production by the isolates.
It was observed that the zone of hydrolysis or cellulolytic index did not show correlation with the synthesis of cellulolytic enzymes in the production medium.
The cellulolytic bacteria have been isolated by various researchers from different samples. Rastogi et al. [15] have isolated cellulose-degrading bacteria belonging to the genera of Brevibacillus, Paenibacillus, Bacillus and Geobacillus.
Gupta et al. [16] isolated eight cellulose hydrolyzing bacteria from invertebrates showing hydrolytic capacity in the range of 4.0 to 9.0 and found that isolates produced CMCase in the range of 0.162 to 0.400 IU/ml. Khianngam et al. [17] isolated cellulolytic bacteria belonging to the genera of
Bacillus, Paenibacillus and Lysinibacillus from oil palm meal samples, which showed cellulase hydrolysis capacity in the range from 1.56 to 4.14 in the Congo red assay and produced CMCase in the range of 0.039±0.002 to 0.233±0.005 IU/ml. In an another study by Liang et al. [18], cellulolytic bacteria were isolated from soil samples from natural reserves producing zone of hydrolysis in Congo red method and found Paenibacillusterrae ME27 as the highest cellulase producer in secondary screening. Khatiwada et al.
[19] isolated cellulase producing bacteria from municipal solid and rice straw waste; and found that Bacillus sp.,
Pseudomonas sp. and Serratia sp produced considerable amounts of cellulases.
4. Conclusions
33.42% of the total bacteria isolated from different samples showed production of extracellular cellulases during plate assay and produced hydrolytic zone of varying diameter. A large number of isolates, among 40 bacteria with CI values in the range of 4.0 to 13.0, gave CMCase and FPase values comparable to that observed in the standard isolate of C. fimi. This confirms the cellulose hydrolysing capability of the isolates. The present work can be extended in future for enhancing cellulase production by bacteria by optimization studies and exploitation of cellulose degradation potential of the isolates in various industries such as cellulases based detergents, paper and pulp, textile, food, fermentation and lignocellulosics bioconversion. Owing to the need for renewable energy sources for future generations, the utilization of cellulases is remarkably attractive in saccharification of cellulosic materials during bioethanol production process.
REFERENCES
[1] Venkata NRE, Goli D, Rajesh T, Ghazi A, and Pourgharashi A. Screening and isolation of cellulase producing bacteria from dump yards of vegetable wastes. World J Pharm Pharm Res 2013; 3: 428-435.
[2] Patagundi BI, Shivasharan CT and Kaliwal BB. Isolation and Characterization of cellulase producing bacteria from soil. Int J Curr Microbiol App Sci. 2014; 3: 59-69.
[3] Bhat MK. Cellulases and related enzymes in biotechnology.
BiotechnolAdv 2000; 18: 355-383.
[4] Abo-state MAM, Ghaly MF and Abdellah EM. Production of cellulases and xylanases by thermophilic and alkalophilic bacterial strains isolated from agricultural wastes. World Appl Sci J 2013; 22:1603-1612.
[5] Olsson L and Hahn-Hagerdahl B. Fermentation of lingocellulose hydrolisates for ethanol production. Enzyme MicrobTechnol 1997; 18:312-331.
[6] Shankar T and Isaiarasu, L. Cellulase production by Bacillus pumilus EWBCM1 under varying cultural conditions.
Middle-East J Sci Res 2011; 8: 40-45.
[7] Christopherson MR, Suen G, Brahmacharya S, Jewell KA, Aylward FO, Mead D and Brumm PJ. The Genome Sequences of Cellulomonas fimi and “Cellvibrio gilvus” Reveal the Cellulolytic Strategies of Two Facultative Anaerobes, Transfer of “Cellvibrio gilvus” to the Genus Cellulomonas, and Proposal of Cellulomonas gilvus sp. Nov. PLoSOne 2013; 8: e53954.
[8] Sreedevi S, Sajith S and Benjamin S. Cellulase producing bacteria from the Wood-Yards on Kallai River Bank. Adv Microbiol 2013; 3:326-332.
[9] Sadhu S and Maiti TK. Cellulase production by bacteria: a review. British Microbiol Res J 2013; 3: 235-258.
[10] Sethi S, Datta A, Gupta BL and Gupta S. Optimization of cellulase production from bacteria isolated from soil. ISRN Biotechnol 2013; 2013: 1-7.
[11] Lynd LR, Weimer PJ, van Zyl WH and Pretorius IS. Microbial cellulose utilization: fundamentals and biotechnology. Microbiol Mol Biol Rev 2002; 66: 506-577. [12] Teather RM and Wood PJ. Use of congo red-polysaccharide
interactions in enumeration and characterization of cellulolytic bacteria from the bovine rumen. Appl Environ Microbiol 1982; 43: 777-780.
[13] Ghose TK. Measurements of cellulase activities.Pure Appl Chem 1987; 59:257-268.
[14] Miller GL. Use of dinitrosalicylic acid reagent for determination of reducing sugar. Anal Chem 1959; 31:426-428.
[15] Rastogi G, Muppidi GL, Gurram RN, Adhikari A, Bischoff KM, Hughes R, Apel WA, Bang SS, Dixon DJ and Saini RK. Isolation and characterization of cellulose-degrading bacteria from the deep subsurface of the Homestake gold mine, Lead, South Dakota, USA. J Ind Mictrobiol Biotechnol 2009; 36: 585-598.
cellulolytic potential. Int J Microbiol 2012; 2012:1-5. [17] Khianngam S, Pootaeng-on Y, Techakriengkrai T and
Tanasupawat S. Screening and identification of cellulase producing bacteria isolated from oil palm meal. J Appl Pharm Sci 2014; 4:090-096.
[18] Liang YL, Zhang Z, Wu M, Wu Y and Feng JX. Isolation, Screening, and Identification of cellulolytic bacteria from
natural reserves in the subtropical region of China and optimization of cellulase production by Paenibacillus terrae
ME27-1. Biomed Res Int 2014; 2014:1-13.