Full Length Research Article
RE-CONFIRMATION OF CONCURRENT VALIDITY OF FOCUS FACTOR AS FOUND BY
STANDARDIZED COGNITIVE ABILITY TEST
*Shruti Marwaha and Geetika Seth
Department of Research and Development, Centre for Research in Applied Cognitive Sciences,
Maxpro Intellithon Ltd. India
ARTICLE INFO ABSTRACT
The focus of attention has become a capricious area of research in educational science. It has become a standing concern in the field of academics, sports and life skills. To cater to the need of the day, the in-hand study was taken up to re-emphasize and re-establish the validity of the numerical value of focus factor as assessed by Cognitive Ability Test which is already developed and standardized. The research was carried in and around Chandigarh. The sample consisted of 240 school going students between 7-16 years of age from different schools. Random sampling was followed. The sample was divided into 4 groups according to their age. The Focus factor of all the subjects were found in two different stages, using two varied tests, both of which are developed and standardized scientifically. It was established through results that the Cognitive Ability Test is valid measure to find out the Focus factor of the subjects.
Copyright©2016, Shruti Marwaha and Geetika Seth. This is an open access article distributed under the Creative Commons Attribution License, which permits unrestricted use, distribution, and reproduction in any medium, provided the original work is properly cited.
INTRODUCTION
Focus factor refers to the ability to respond discretely to specific visual, auditory or tactile stimuli.Focused attention is the ability to respond discretely to specific visual, auditory or tactile stimuli. In cognitive psychology, there are at least two models which describe how visual attention operates. These models may be considered loosely as metaphors which are used to describe internal processes and to generate hypotheses that are falsifiable. Generally speaking, visual attention is thought to operate as a two-stage process. In the first stage, attention is distributed uniformly over the external visual scene and processing of information is performed in parallel. In the second stage, attention is concentrated to a specific area of the visual scene i.e., it is focused, and processing is performed in a serial fashion. The pioneering research of Lev Vygotsky and Alexander Luria led to the three-part model of neuropsychology defining the working brain as being represented by three co-active processes listed as Attention, Memory, and Activation. Attention is identified as one of the three major co-active processes of the working brain. A.R. Luria published his well-known book The Working Brain in
*Corresponding author: Shruti Marwaha,
Department of Research and Development, Centre for Research in Applied Cognitive Sciences, Maxpro Intellithon Ltd. India.
1973 as a concise adjunct volume to his previous 1962 book Higher Cortical Functions in Man. In this volume, Luria summarized his three-part global theory of the working brain as being composed of three constantly co-active processes which he described as the; Attention system, Mnestic (memory) system, and Cortical activation system. The two books together are considered by Homskaya's account as "among Luria's major works in neuropsychology, most fully reflecting all the aspects (theoretical, clinical, experimental) of this new discipline."The product of the combined research of Vygotsky and Luria have determined a large part of the contemporary understanding and definition of attention as it is understood at the start of the 21st-century. Focus is directing attention in a chosen way at a chosen object. One can focus with a lens to home in on a minuscule particle or a wide expanse or anywhere in between. When one focuseshis mind, he can concentrate on a single object, word, sound or idea, bringing our awareness to that one thing and filtering out distractions. Alternatively, one can open attention to a sequence of events in a process or a process within a system of processes as expansive as the universe. In all cases, there is filtering out of distractions that might take the mind off on a little journey to a place that is not consciously chosen to go. Focus factor has been described within the context of theories of attention, working memory, executive function, and consciousness. Baddeley (1993) proposed that the central
ISSN: 2230-9926
International Journal of Development Research
Vol. 06, Issue, 11, pp.9937-9941, November, 2016
International Journal of
DEVELOPMENT RESEARCH
Article History:
Received 22ndAugust, 2016
Received in revised form
17thSeptember, 2016
Accepted 12thOctober, 2016
Published online 30thNovember, 2016
Key Words:
executive in his model of working memory may function as Norman and Shallice’s (1986) Supervisory Attention System, such that it generates higher level schemas that override lower level, automatic, or environmentally generated schemas to achieve internally produced goals. The focus of attention has been a burgeoning area of research in human movement science for the last decade. There is considerable evidence that directing attention externally to the effect of a movement on the environment e.g., focusing on the flight of a ball in golf improves performance compared to focusing internally on bodily movements involved in the execution of the motor skill e.g., focusing on the motion of the arms in a golf swing. The advantage of an external focus of attention over an internal focus has been well documented across a wide variety of skills (Wulf, 2007a; Lohse et al., 2012). Furthermore, a number of studies have shown an external focus of attention, induced through instructions and feedback by the experimenter, improves performance relative to uninstructed control conditions (McNevin and Wulf, 2002; Wulf and McNevin, 2003; Wulf et al., 2003; Landers et al., 2005), and the advantage of focusing externally holds true for recovering/performing motor skills in clinical populations, such as stroke (Fasoli et al., 2002) and Parkinson’s disease patients (Landers et al., 2005; Wulf et al., 2009).
The psychological construct ‘Focus Factor’ describes a fundamental component of attention characterized by the subject’s readiness todetect rarely and unpredictably occurring signals over prolonged periods of time. Human imaging studies have demonstrated that activation of frontal and parietal cortical areas, mostly in the right hemisphere, are associated with sustained attention performance.The Test of Variables of Attention (T.O.V.A.) objectively measures the key components of attention and self-control, variability (consistency), response time (speed), commissions (impulsivity), and omissions (focus and vigilance). The T.O.V.A. provides information that is not available through self-report or the report of others. It can be used along with subjective measures for a more comprehensive picture of academic, social, and personal performance. The T.O.V.A. uses a USB-connected microswitch that is calibrated to the tester's computer screen, allowing for ±1 millisecond accuracy and avoidance of intrinsic delays in modern computers. Separate tests are administered for visual vs. auditory modes. In the visual version, the T.O.V.A. uses geometric shapes so that language and reading levels do not play a part in the scoring. The T.O.V.A. has two sections, similar to the high and low demand sections discussed above for the IVA. The first section is a "low brainstimulation task" where the targets are infrequently presented. The boring nature of this task pulls for "errors of omission" when the person does not respond to the target. The second half of this test is a "high brain stimulation task" in which targets are frequently presented. This task pulls for "errors of commission" since a person may expect to see a target and impulsively respond. The auditory version of the T.O.V.A. is the same paradigm using two easily recognized tones as the target and non-target stimuli.
Focus Factor Ff
[image:2.595.337.527.72.146.2]Is an indicator for collective attention or focus & concentration in accomplishing assigned tasks. It is one of the most prominent factors to achieve success. If focus factor is not high, even a high IQ is not beneficial. It is a ratio of accuracy vs. age & time. (Ff below 30 is poor, 30-50 is below avg, 50-75 is avg, 100 is optimum, above 150 is excellent)
Table 1. FocusFactor
Above 150 Excellent
120-150 Very good
90-120 Good
75-90 Above average
50-75 Average
30-50 Below par
Below 30 Poor
MATERIALS AND METHODS
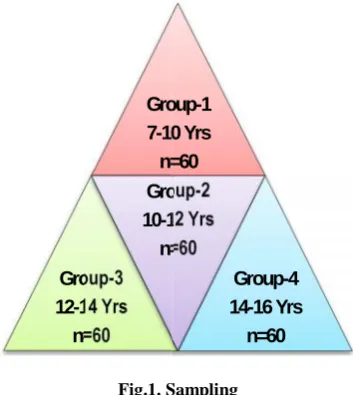
[image:2.595.344.521.229.427.2]Random sampling was undertaken to select subjects both males as well as females from different schools aging between 7-16 years. The sample was divided into four groups.
Fig.1. Sampling
Group1: Subject aging between 07-10 Years Group 2:Subject aging between 10-12 Years Group 3:Subject aging between 12-14 Years Group 4:Subject aging between 14-16 Years
Stages of study - The Groups were compared in twostages.
Table 2. Stages of study
Group-1 Group-2 Group-3 Group-4
Age Range 7-10 Yrs 10-12 Yrs 12-14 Yrs 14-16 Yrs
Day-1: Rapport Building Stage-1
Day-2
Ff tested by Test-1
Ff tested by Test-2
Ff tested by Test-1
Ff tested by Test-2 Day-3 & 4: Halt
Stage-2 Day-5
Ff tested by Test-2
Ff tested by Test-1
Ff tested by Test-2
Ff tested by Test-1
On the first day, rapport was built with the subjects. on the second day, Focus Factor of Group-1 (subjects aging between 7-10 years of age) and Group-3 (subjects aging between 12-14 years of age) was initially found using the Test-1. In contrast, those from Group-2 and Group-4 were given Test-2 to test their FF. A halt was given for next two days, following which, the subjects of Groups 1 and 3 were tested for FF through Test-2, while those from Group 2 and 4 were tested for FF using Test-1. Test 1 here refers to the The Test of Variables of Attention (T.O.V.A.) objectively measures the key components of attention and self-control, variability (consistency), response time (speed), commissions (impulsivity), and omissions (focus and vigilance). The Test 2 refers to the Cognitive Ability Test in question.
9938 Shruti Marwaha and Geetika Seth, Re-confirmation of concurrent validity of focus factor as found by standardized cognitive ability test
executive in his model of working memory may function as Norman and Shallice’s (1986) Supervisory Attention System, such that it generates higher level schemas that override lower level, automatic, or environmentally generated schemas to achieve internally produced goals. The focus of attention has been a burgeoning area of research in human movement science for the last decade. There is considerable evidence that directing attention externally to the effect of a movement on the environment e.g., focusing on the flight of a ball in golf improves performance compared to focusing internally on bodily movements involved in the execution of the motor skill e.g., focusing on the motion of the arms in a golf swing. The advantage of an external focus of attention over an internal focus has been well documented across a wide variety of skills (Wulf, 2007a; Lohse et al., 2012). Furthermore, a number of studies have shown an external focus of attention, induced through instructions and feedback by the experimenter, improves performance relative to uninstructed control conditions (McNevin and Wulf, 2002; Wulf and McNevin, 2003; Wulf et al., 2003; Landers et al., 2005), and the advantage of focusing externally holds true for recovering/performing motor skills in clinical populations, such as stroke (Fasoli et al., 2002) and Parkinson’s disease patients (Landers et al., 2005; Wulf et al., 2009).
The psychological construct ‘Focus Factor’ describes a fundamental component of attention characterized by the subject’s readiness todetect rarely and unpredictably occurring signals over prolonged periods of time. Human imaging studies have demonstrated that activation of frontal and parietal cortical areas, mostly in the right hemisphere, are associated with sustained attention performance.The Test of Variables of Attention (T.O.V.A.) objectively measures the key components of attention and self-control, variability (consistency), response time (speed), commissions (impulsivity), and omissions (focus and vigilance). The T.O.V.A. provides information that is not available through self-report or the report of others. It can be used along with subjective measures for a more comprehensive picture of academic, social, and personal performance. The T.O.V.A. uses a USB-connected microswitch that is calibrated to the tester's computer screen, allowing for ±1 millisecond accuracy and avoidance of intrinsic delays in modern computers. Separate tests are administered for visual vs. auditory modes. In the visual version, the T.O.V.A. uses geometric shapes so that language and reading levels do not play a part in the scoring. The T.O.V.A. has two sections, similar to the high and low demand sections discussed above for the IVA. The first section is a "low brainstimulation task" where the targets are infrequently presented. The boring nature of this task pulls for "errors of omission" when the person does not respond to the target. The second half of this test is a "high brain stimulation task" in which targets are frequently presented. This task pulls for "errors of commission" since a person may expect to see a target and impulsively respond. The auditory version of the T.O.V.A. is the same paradigm using two easily recognized tones as the target and non-target stimuli.
Focus Factor Ff
[image:2.595.303.562.543.626.2]Is an indicator for collective attention or focus & concentration in accomplishing assigned tasks. It is one of the most prominent factors to achieve success. If focus factor is not high, even a high IQ is not beneficial. It is a ratio of accuracy vs. age & time. (Ff below 30 is poor, 30-50 is below avg, 50-75 is avg, 100 is optimum, above 150 is excellent)
Table 1. FocusFactor
Above 150 Excellent
120-150 Very good
90-120 Good
75-90 Above average
50-75 Average
30-50 Below par
Below 30 Poor
MATERIALS AND METHODS
Random sampling was undertaken to select subjects both males as well as females from different schools aging between 7-16 years. The sample was divided into four groups.
Fig.1. Sampling
Group1: Subject aging between 07-10 Years Group 2:Subject aging between 10-12 Years Group 3:Subject aging between 12-14 Years Group 4:Subject aging between 14-16 Years
Stages of study - The Groups were compared in twostages.
Table 2. Stages of study
Group-1 Group-2 Group-3 Group-4
Age Range 7-10 Yrs 10-12 Yrs 12-14 Yrs 14-16 Yrs
Day-1: Rapport Building Stage-1
Day-2
Ff tested by Test-1
Ff tested by Test-2
Ff tested by Test-1
Ff tested by Test-2 Day-3 & 4: Halt
Stage-2 Day-5
Ff tested by Test-2
Ff tested by Test-1
Ff tested by Test-2
Ff tested by Test-1
On the first day, rapport was built with the subjects. on the second day, Focus Factor of Group-1 (subjects aging between 7-10 years of age) and Group-3 (subjects aging between 12-14 years of age) was initially found using the Test-1. In contrast, those from Group-2 and Group-4 were given Test-2 to test their FF. A halt was given for next two days, following which, the subjects of Groups 1 and 3 were tested for FF through Test-2, while those from Group 2 and 4 were tested for FF using Test-1. Test 1 here refers to the The Test of Variables of Attention (T.O.V.A.) objectively measures the key components of attention and self-control, variability (consistency), response time (speed), commissions (impulsivity), and omissions (focus and vigilance). The Test 2 refers to the Cognitive Ability Test in question.
Group-1 7-10 Yrs n=60 Group-3 12-14 Yrs n=60 Group-2 10-12 Yrs n=60
9938 Shruti Marwaha and Geetika Seth, Re-confirmation of concurrent validity of focus factor as found by standardized cognitive ability test
executive in his model of working memory may function as Norman and Shallice’s (1986) Supervisory Attention System, such that it generates higher level schemas that override lower level, automatic, or environmentally generated schemas to achieve internally produced goals. The focus of attention has been a burgeoning area of research in human movement science for the last decade. There is considerable evidence that directing attention externally to the effect of a movement on the environment e.g., focusing on the flight of a ball in golf improves performance compared to focusing internally on bodily movements involved in the execution of the motor skill e.g., focusing on the motion of the arms in a golf swing. The advantage of an external focus of attention over an internal focus has been well documented across a wide variety of skills (Wulf, 2007a; Lohse et al., 2012). Furthermore, a number of studies have shown an external focus of attention, induced through instructions and feedback by the experimenter, improves performance relative to uninstructed control conditions (McNevin and Wulf, 2002; Wulf and McNevin, 2003; Wulf et al., 2003; Landers et al., 2005), and the advantage of focusing externally holds true for recovering/performing motor skills in clinical populations, such as stroke (Fasoli et al., 2002) and Parkinson’s disease patients (Landers et al., 2005; Wulf et al., 2009).
The psychological construct ‘Focus Factor’ describes a fundamental component of attention characterized by the subject’s readiness todetect rarely and unpredictably occurring signals over prolonged periods of time. Human imaging studies have demonstrated that activation of frontal and parietal cortical areas, mostly in the right hemisphere, are associated with sustained attention performance.The Test of Variables of Attention (T.O.V.A.) objectively measures the key components of attention and self-control, variability (consistency), response time (speed), commissions (impulsivity), and omissions (focus and vigilance). The T.O.V.A. provides information that is not available through self-report or the report of others. It can be used along with subjective measures for a more comprehensive picture of academic, social, and personal performance. The T.O.V.A. uses a USB-connected microswitch that is calibrated to the tester's computer screen, allowing for ±1 millisecond accuracy and avoidance of intrinsic delays in modern computers. Separate tests are administered for visual vs. auditory modes. In the visual version, the T.O.V.A. uses geometric shapes so that language and reading levels do not play a part in the scoring. The T.O.V.A. has two sections, similar to the high and low demand sections discussed above for the IVA. The first section is a "low brainstimulation task" where the targets are infrequently presented. The boring nature of this task pulls for "errors of omission" when the person does not respond to the target. The second half of this test is a "high brain stimulation task" in which targets are frequently presented. This task pulls for "errors of commission" since a person may expect to see a target and impulsively respond. The auditory version of the T.O.V.A. is the same paradigm using two easily recognized tones as the target and non-target stimuli.
Focus Factor Ff
Is an indicator for collective attention or focus & concentration in accomplishing assigned tasks. It is one of the most prominent factors to achieve success. If focus factor is not high, even a high IQ is not beneficial. It is a ratio of accuracy vs. age & time. (Ff below 30 is poor, 30-50 is below avg, 50-75 is avg, 100 is optimum, above 150 is excellent)
Table 1. FocusFactor
Above 150 Excellent
120-150 Very good
90-120 Good
75-90 Above average
50-75 Average
30-50 Below par
Below 30 Poor
MATERIALS AND METHODS
Random sampling was undertaken to select subjects both males as well as females from different schools aging between 7-16 years. The sample was divided into four groups.
Fig.1. Sampling
Group1: Subject aging between 07-10 Years Group 2:Subject aging between 10-12 Years Group 3:Subject aging between 12-14 Years Group 4:Subject aging between 14-16 Years
Stages of study - The Groups were compared in twostages.
Table 2. Stages of study
Group-1 Group-2 Group-3 Group-4
Age Range 7-10 Yrs 10-12 Yrs 12-14 Yrs 14-16 Yrs
Day-1: Rapport Building Stage-1
Day-2
Ff tested by Test-1
Ff tested by Test-2
Ff tested by Test-1
Ff tested by Test-2 Day-3 & 4: Halt
Stage-2 Day-5
Ff tested by Test-2
Ff tested by Test-1
Ff tested by Test-2
Ff tested by Test-1
On the first day, rapport was built with the subjects. on the second day, Focus Factor of Group-1 (subjects aging between 7-10 years of age) and Group-3 (subjects aging between 12-14 years of age) was initially found using the Test-1. In contrast, those from Group-2 and Group-4 were given Test-2 to test their FF. A halt was given for next two days, following which, the subjects of Groups 1 and 3 were tested for FF through Test-2, while those from Group 2 and 4 were tested for FF using Test-1. Test 1 here refers to the The Test of Variables of Attention (T.O.V.A.) objectively measures the key components of attention and self-control, variability (consistency), response time (speed), commissions (impulsivity), and omissions (focus and vigilance). The Test 2 refers to the Cognitive Ability Test in question.
Group-1 7-10 Yrs n=60 Group-2 10-12 Yrs n=60 Group-4 14-16 Yrs n=60
Statistical analysis
Once the data was obtained, it was coded, tabulated and analyzed, keeping in mind the objectives of the study. Appropriate statistical tools were used to draw meaningful inferences. The statistical tools used in the present study are given in the table below;
RESULTS AND DISCUSSION
There was statistically insignificant difference traced in the Focus factor of the respondents aging between 7-10 years as assessed through the two tests.
Table 4. Mean, Standard deviation, standard error and t-values of Test-A & Test-B of subjects aging between 7-10 years (n=60)
Mean SD SEM t-value Lev of Sig.
Test-A 76 4.5 0.58 1.336
Test-B 77 3.65 0.47
Fig. 2. Mean Difference between Focus Factor of subjects aging 7-10 years, as derived from Test A and Test B
Table 5. M ean, Standard deviation, standard error and t-values of Test-A & Test-B of subjects aging between 10-12 years (n=60)
Mean SD SEM t-value Lev of Sig.
Test-A 86 4.59 0.59 1.339
Test-B 87.1 5.95 0.76
Fig. 3. Mean Difference between Focus Factor of subjects aging 10-12 years, as derived from Test A and Test B
There was a slight difference traced in the Focus factor of the respondents aging between 10-12 years as assessed through the two tests.
Table 6. Mean, Standard deviation, standard error and t-values of Test-A & Test-B of subjects aging between 12-14 years (n=60)
Mean SD SEM t-value Lev of Sig.
Test-A 74.95 6.85 0.88 1.569
Test-B 76.85 6.4 0.82
There was negligible difference traced in the Focus factor of the respondents aging between 12-14 years as assessed through the two tests.
40.00 50.00 60.00 70.00 80.00 90.00 100.00
Test-A Test-B 76.00 77.00
Fo
cu
s F
ac
to
r
Table 3. Statistical tools used for analysis of data
Statistical analysis
Once the data was obtained, it was coded, tabulated and analyzed, keeping in mind the objectives of the study. Appropriate statistical tools were used to draw meaningful inferences. The statistical tools used in the present study are given in the table below;
RESULTS AND DISCUSSION
There was statistically insignificant difference traced in the Focus factor of the respondents aging between 7-10 years as assessed through the two tests.
Table 4. Mean, Standard deviation, standard error and t-values of Test-A & Test-B of subjects aging between 7-10 years (n=60)
Mean SD SEM t-value Lev of Sig.
Test-A 76 4.5 0.58 1.336
Test-B 77 3.65 0.47
Fig. 2. Mean Difference between Focus Factor of subjects aging 7-10 years, as derived from Test A and Test B
Table 5. M ean, Standard deviation, standard error and t-values of Test-A & Test-B of subjects aging between 10-12 years (n=60)
Mean SD SEM t-value Lev of Sig.
Test-A 86 4.59 0.59 1.339
Test-B 87.1 5.95 0.76
Fig. 3. Mean Difference between Focus Factor of subjects aging 10-12 years, as derived from Test A and Test B
There was a slight difference traced in the Focus factor of the respondents aging between 10-12 years as assessed through the two tests.
Table 6. Mean, Standard deviation, standard error and t-values of Test-A & Test-B of subjects aging between 12-14 years (n=60)
Mean SD SEM t-value Lev of Sig.
Test-A 74.95 6.85 0.88 1.569
Test-B 76.85 6.4 0.82
There was negligible difference traced in the Focus factor of the respondents aging between 12-14 years as assessed through the two tests.
Test-B 77.00
40.00 50.00 60.00 70.00 80.00 90.00 100.00
Test-A 86.00
Fo
cu
s F
ac
to
r
Table 3. Statistical tools used for analysis of data
Statistical analysis
Once the data was obtained, it was coded, tabulated and analyzed, keeping in mind the objectives of the study. Appropriate statistical tools were used to draw meaningful inferences. The statistical tools used in the present study are given in the table below;
RESULTS AND DISCUSSION
There was statistically insignificant difference traced in the Focus factor of the respondents aging between 7-10 years as assessed through the two tests.
Table 4. Mean, Standard deviation, standard error and t-values of Test-A & Test-B of subjects aging between 7-10 years (n=60)
Mean SD SEM t-value Lev of Sig.
Test-A 76 4.5 0.58 1.336
Test-B 77 3.65 0.47
Fig. 2. Mean Difference between Focus Factor of subjects aging 7-10 years, as derived from Test A and Test B
Table 5. M ean, Standard deviation, standard error and t-values of Test-A & Test-B of subjects aging between 10-12 years (n=60)
Mean SD SEM t-value Lev of Sig.
Test-A 86 4.59 0.59 1.339
Test-B 87.1 5.95 0.76
Fig. 3. Mean Difference between Focus Factor of subjects aging 10-12 years, as derived from Test A and Test B
There was a slight difference traced in the Focus factor of the respondents aging between 10-12 years as assessed through the two tests.
Table 6. Mean, Standard deviation, standard error and t-values of Test-A & Test-B of subjects aging between 12-14 years (n=60)
Mean SD SEM t-value Lev of Sig.
Test-A 74.95 6.85 0.88 1.569
Test-B 76.85 6.4 0.82
There was negligible difference traced in the Focus factor of the respondents aging between 12-14 years as assessed through the two tests.
Fig. 4. Mean Difference between Focus Factor of subjects aging 12-14 years, as derived from Test A and Test B
Table 7. Mean, Standard deviation, standard error and t-values of Test-A & Test-B of subjects aging between 14-16 years (n=60)
Mean SD SEM t-value Lev of Sig.
Test-A 76.5 4.85 6.85 0.46
Test-B 77.1 5.4 7.4
Fig. 5. Mean Difference between Focus Factor of subjects aging 14-16 years, as derived from Test A and Test B
A statistically insignificant difference was notified in the Focus factor of the respondents aging between 14-16 years as assessed through the two tests.
Conclusion
The Focus Factor of all the subjects was found using two different tests, both of which are developed and standardized scientifically. It was established through results that the Cognitive Ability Test is valid measure to find out the Focus Factor of the subjects. Eventually, the concurrent validity of the numerical value of Focus Factor as assessed through the standardized Cognitive Ability Test was re-established.To conclude, Focus Factor of the subjects can be accurately notified with the Cognitive ability test in question. The test is found to be reliable and valid measure of Focus Factor i.e. focused attention of respondents ranging between 7-16 years of age.
Acknowledgement
Authors express indebtedness to the Almighty, who is the apostle of strength. Authors are inevitably grateful to the
subjects and all those directly as well as indirectly involved in the auspicious research work. Genuine thanks are expressed to all the authors/researches whose work is referred for making the present study a real success.
REFERENCES
Allan, C. J., Solman, G. J. F., Carriere, J. S. A., & Smilek, D. January 01, 2009. Anatomy of an error: A bidirectional state model of task engagement/disengagement and attention-related errors. Cognition, 111, 1, 98-113.
Baddeley, A. D. 1993. Working memory or working attention? In A. D. Baddeley & L. Weiskrantz (Eds.), Attention: Selection, awareness, and control: A tribute to Donald Broadbent. Oxford, UK: Oxford University Press.
Broadbent, D. E. 1957. A mechanical model for human attention and immediate memory. Psychological Review, 64, 205–215.PubMed
Cheyne, J. A., Carriere, J. S. A., & Smilek, D. September 01, 2006. Absent-mindedness: Lapses of conscious awareness and everyday cognitive failures. Consciousness and Cognition, 15, 3, 578-592.
Cohen, R. 1993. The neuropsychology of attention. New York: Plenum.
Cowan, N. 1988. Evolving conceptions of memory storage, selective attention, and their mutual constraints within the human information processing system. Psychological
Bulletin, 104, 163–191.PubMed
Hart, E. P., Dumas, E. M., Reijntjes, R. H., van, . H. K., van, . B. S. J., Middelkoop, H. Deficient sustained attention to response task and P300 characteristics in early Huntington's disease. Journal of Neurology, 259, 6,1191-8. Helton, W. S., Weil, L., Middlemiss, A., & Sawers, A. January
01, 2010. Global interference and spatial uncertainty in the Sustained Attention to Response Task (SART).
Consciousness and Cognition, 19, 1, 77-85.
Miller, G. A. 1956. The magical number seven, plus or minus two. Psychological Review, 63, 81–97.PubMed
Miller, G.A. 1956. Information theory. Scientific American, 195, 42-46.
Molenberghs, P., Gillebert, C. R., Schoofs, H., Dupont, P., Peeters, R., & Vandenberghe, R. November 01, 2009. Lesion neuroanatomy of the Sustained Attention to Response task. Neuropsychologia, 47, 13, 2866-2875. Nanda HK, Marwaha S, Chawla P. 2015. Development, Item
Analysis, Standardization, Review and Expansion of the Cognitive Ability Test for a Wider Age Range (7-16 Years) on a Single Test. International Journal of Multidisciplinary Research and Development, 334-350
Nanda HK, Marwaha S. 2015. Suggestive case study on evidence of effectiveness ofcustomized education training based on the outcomes of cognitive ability testing to develop high mental (cognitive) abilities & personality in students between 14-20 year age group to achieve maximum Employability International Journal of Applied
Research, 1(4): 47-54
Nanda, HK., Marwaha, Shruti., Chawla, Pawandeep., Kaur, Baljeet. 2015. Development and Standardization of Cognitive Ability Test for Children. International Journal of Applied Research, 1(4): 69-77.
Norman, D., & Shallice, T. 1986. Attention to action: Willed and automatic control of behaviour. In R. J. Davidson, G. E. Schwartz, & D. E. Shapiro (Eds.), Consciousness and self-regulation: Advances in research and theory (Vol. 4, pp. 1–18). New York: Plenum.
40.00 50.00 60.00 70.00 80.00 90.00 100.00 Test-A Test-B 74.95 76.85 Fo cu s F ac to r 40.00 50.00 60.00 70.00 80.00 90.00 100.00 Test-A Test-B 76.50 77.10 Fo cu s F ac to r
[image:4.595.36.288.283.490.2]9940 Shruti Marwaha and Geetika Seth, Re-confirmation of concurrent validity of focus factor as found by standardized cognitive ability test
Fig. 4. Mean Difference between Focus Factor of subjects aging 12-14 years, as derived from Test A and Test B
Table 7. Mean, Standard deviation, standard error and t-values of Test-A & Test-B of subjects aging between 14-16 years (n=60)
Mean SD SEM t-value Lev of Sig.
Test-A 76.5 4.85 6.85 0.46
Test-B 77.1 5.4 7.4
Fig. 5. Mean Difference between Focus Factor of subjects aging 14-16 years, as derived from Test A and Test B
A statistically insignificant difference was notified in the Focus factor of the respondents aging between 14-16 years as assessed through the two tests.
Conclusion
The Focus Factor of all the subjects was found using two different tests, both of which are developed and standardized scientifically. It was established through results that the Cognitive Ability Test is valid measure to find out the Focus Factor of the subjects. Eventually, the concurrent validity of the numerical value of Focus Factor as assessed through the standardized Cognitive Ability Test was re-established.To conclude, Focus Factor of the subjects can be accurately notified with the Cognitive ability test in question. The test is found to be reliable and valid measure of Focus Factor i.e. focused attention of respondents ranging between 7-16 years of age.
Acknowledgement
Authors express indebtedness to the Almighty, who is the apostle of strength. Authors are inevitably grateful to the
subjects and all those directly as well as indirectly involved in the auspicious research work. Genuine thanks are expressed to all the authors/researches whose work is referred for making the present study a real success.
REFERENCES
Allan, C. J., Solman, G. J. F., Carriere, J. S. A., & Smilek, D. January 01, 2009. Anatomy of an error: A bidirectional state model of task engagement/disengagement and attention-related errors. Cognition, 111, 1, 98-113.
Baddeley, A. D. 1993. Working memory or working attention? In A. D. Baddeley & L. Weiskrantz (Eds.), Attention: Selection, awareness, and control: A tribute to Donald Broadbent. Oxford, UK: Oxford University Press.
Broadbent, D. E. 1957. A mechanical model for human attention and immediate memory. Psychological Review, 64, 205–215.PubMed
Cheyne, J. A., Carriere, J. S. A., & Smilek, D. September 01, 2006. Absent-mindedness: Lapses of conscious awareness and everyday cognitive failures. Consciousness and Cognition, 15, 3, 578-592.
Cohen, R. 1993. The neuropsychology of attention. New York: Plenum.
Cowan, N. 1988. Evolving conceptions of memory storage, selective attention, and their mutual constraints within the human information processing system. Psychological
Bulletin, 104, 163–191.PubMed
Hart, E. P., Dumas, E. M., Reijntjes, R. H., van, . H. K., van, . B. S. J., Middelkoop, H. Deficient sustained attention to response task and P300 characteristics in early Huntington's disease. Journal of Neurology, 259, 6,1191-8. Helton, W. S., Weil, L., Middlemiss, A., & Sawers, A. January
01, 2010. Global interference and spatial uncertainty in the Sustained Attention to Response Task (SART).
Consciousness and Cognition, 19, 1, 77-85.
Miller, G. A. 1956. The magical number seven, plus or minus two. Psychological Review, 63, 81–97.PubMed
Miller, G.A. 1956. Information theory. Scientific American, 195, 42-46.
Molenberghs, P., Gillebert, C. R., Schoofs, H., Dupont, P., Peeters, R., & Vandenberghe, R. November 01, 2009. Lesion neuroanatomy of the Sustained Attention to Response task. Neuropsychologia, 47, 13, 2866-2875. Nanda HK, Marwaha S, Chawla P. 2015. Development, Item
Analysis, Standardization, Review and Expansion of the Cognitive Ability Test for a Wider Age Range (7-16 Years) on a Single Test. International Journal of Multidisciplinary Research and Development, 334-350
Nanda HK, Marwaha S. 2015. Suggestive case study on evidence of effectiveness ofcustomized education training based on the outcomes of cognitive ability testing to develop high mental (cognitive) abilities & personality in students between 14-20 year age group to achieve maximum Employability International Journal of Applied
Research, 1(4): 47-54
Nanda, HK., Marwaha, Shruti., Chawla, Pawandeep., Kaur, Baljeet. 2015. Development and Standardization of Cognitive Ability Test for Children. International Journal of Applied Research, 1(4): 69-77.
Norman, D., & Shallice, T. 1986. Attention to action: Willed and automatic control of behaviour. In R. J. Davidson, G. E. Schwartz, & D. E. Shapiro (Eds.), Consciousness and self-regulation: Advances in research and theory (Vol. 4, pp. 1–18). New York: Plenum.
Test-B 76.85
Test-B 77.10
9940 Shruti Marwaha and Geetika Seth, Re-confirmation of concurrent validity of focus factor as found by standardized cognitive ability test
Fig. 4. Mean Difference between Focus Factor of subjects aging 12-14 years, as derived from Test A and Test B
Table 7. Mean, Standard deviation, standard error and t-values of Test-A & Test-B of subjects aging between 14-16 years (n=60)
Mean SD SEM t-value Lev of Sig.
Test-A 76.5 4.85 6.85 0.46
Test-B 77.1 5.4 7.4
Fig. 5. Mean Difference between Focus Factor of subjects aging 14-16 years, as derived from Test A and Test B
A statistically insignificant difference was notified in the Focus factor of the respondents aging between 14-16 years as assessed through the two tests.
Conclusion
The Focus Factor of all the subjects was found using two different tests, both of which are developed and standardized scientifically. It was established through results that the Cognitive Ability Test is valid measure to find out the Focus Factor of the subjects. Eventually, the concurrent validity of the numerical value of Focus Factor as assessed through the standardized Cognitive Ability Test was re-established.To conclude, Focus Factor of the subjects can be accurately notified with the Cognitive ability test in question. The test is found to be reliable and valid measure of Focus Factor i.e. focused attention of respondents ranging between 7-16 years of age.
Acknowledgement
Authors express indebtedness to the Almighty, who is the apostle of strength. Authors are inevitably grateful to the
subjects and all those directly as well as indirectly involved in the auspicious research work. Genuine thanks are expressed to all the authors/researches whose work is referred for making the present study a real success.
REFERENCES
Allan, C. J., Solman, G. J. F., Carriere, J. S. A., & Smilek, D. January 01, 2009. Anatomy of an error: A bidirectional state model of task engagement/disengagement and attention-related errors. Cognition, 111, 1, 98-113.
Baddeley, A. D. 1993. Working memory or working attention? In A. D. Baddeley & L. Weiskrantz (Eds.), Attention: Selection, awareness, and control: A tribute to Donald Broadbent. Oxford, UK: Oxford University Press.
Broadbent, D. E. 1957. A mechanical model for human attention and immediate memory. Psychological Review, 64, 205–215.PubMed
Cheyne, J. A., Carriere, J. S. A., & Smilek, D. September 01, 2006. Absent-mindedness: Lapses of conscious awareness and everyday cognitive failures. Consciousness and Cognition, 15, 3, 578-592.
Cohen, R. 1993. The neuropsychology of attention. New York: Plenum.
Cowan, N. 1988. Evolving conceptions of memory storage, selective attention, and their mutual constraints within the human information processing system. Psychological
Bulletin, 104, 163–191.PubMed
Hart, E. P., Dumas, E. M., Reijntjes, R. H., van, . H. K., van, . B. S. J., Middelkoop, H. Deficient sustained attention to response task and P300 characteristics in early Huntington's disease. Journal of Neurology, 259, 6,1191-8. Helton, W. S., Weil, L., Middlemiss, A., & Sawers, A. January
01, 2010. Global interference and spatial uncertainty in the Sustained Attention to Response Task (SART).
Consciousness and Cognition, 19, 1, 77-85.
Miller, G. A. 1956. The magical number seven, plus or minus two. Psychological Review, 63, 81–97.PubMed
Miller, G.A. 1956. Information theory. Scientific American, 195, 42-46.
Molenberghs, P., Gillebert, C. R., Schoofs, H., Dupont, P., Peeters, R., & Vandenberghe, R. November 01, 2009. Lesion neuroanatomy of the Sustained Attention to Response task. Neuropsychologia, 47, 13, 2866-2875. Nanda HK, Marwaha S, Chawla P. 2015. Development, Item
Analysis, Standardization, Review and Expansion of the Cognitive Ability Test for a Wider Age Range (7-16 Years) on a Single Test. International Journal of Multidisciplinary Research and Development, 334-350
Nanda HK, Marwaha S. 2015. Suggestive case study on evidence of effectiveness ofcustomized education training based on the outcomes of cognitive ability testing to develop high mental (cognitive) abilities & personality in students between 14-20 year age group to achieve maximum Employability International Journal of Applied
Research, 1(4): 47-54
Nanda, HK., Marwaha, Shruti., Chawla, Pawandeep., Kaur, Baljeet. 2015. Development and Standardization of Cognitive Ability Test for Children. International Journal of Applied Research, 1(4): 69-77.
Norman, D., & Shallice, T. 1986. Attention to action: Willed and automatic control of behaviour. In R. J. Davidson, G. E. Schwartz, & D. E. Shapiro (Eds.), Consciousness and self-regulation: Advances in research and theory (Vol. 4, pp. 1–18). New York: Plenum.
Robertson, I. H., Manly, T., Andrade, J., Baddeley, B. T., & Yiend, J. 1997. ‘Oops!’: Performance correlates of everyday attentional failures in traumatic brain injured and normal subjects. Neuropsychologia, 35(6), 747–758. Smilek, D., Carriere, J. S. A. & Cheyne, J. A. July 01, 2010.
Failures of sustained attention in life, lab, and brain: Ecological validity of the SART. Neuropsychologia, 48, 9, 2564-2570.
Sohlberg, M., & Mateer, C. A. 1989. Introduction to cognitive rehabilitation: Theory and practice. New York: Guilford Press.
Strauss, Esther; Sherman, Elizabeth M.; Spreen, Otfried 2006. A Compendium of Neuropsychological Tests: Administration, Norms, and Commentary. Oxford: Oxford University Press. ISBN 978-0-19-515957-8
Van, S. M. K., Thijs, R. D., Fronczek, R., Middelkoop, H. A., Lammers, G. J., & Van, D. J. G. January 01, 2012. Sustained attention to response task (SART) shows impaired vigilance in a spectrum of disorders of excessive daytime sleepiness. Journal of Sleep Research, 21, 4,390-5. Weldon MS, Roediger, HL, Challis BH. 1989. The properties of retrieval cues constrain the picture superiority effect.
Memory & Cognition, 17:95-105.