Available online on www.ijpsr.com 378 IJPSR (2011), Vol. 2, Issue 2 (Research Article)
Received on 12 September, 2010; received in revised form 12 December, 2010; accepted 17 January, 2011
DEVELOPMENT AND VALIDATION OF SPECTROPHOTOMETRIC METHOD FOR THE DETERMINATION OF RISPERIDONE IN BULK DRUG AND PHARMACEUTICAL FORMULATION
Moynul Hasan*1, Abdullh Al Masud 2 and Jamiuddin Ahmed 3
Department of Pharmacy, Dhaka International University 1, Banani, Dhaka, Bangladesh ACI Pharmaceuticals Ltd. 2, Dhaka, Bangladesh
Department of pharmacy, Primeasia University 3, Banani, Dhaka, Bangladesh
ABSTRACT
A simple, sensitive and accurate spectrophotometric method has been developed for the deterrmination of Risperidone in raw material and capsule. The λmax of Risperidone was found to
be 202nm. Risperidone obeys linearity within the concentration range of 2.5 to 20µg/mL and coefficient correlation was found to be 0.9991.The regression of the curve was Y= 0.0508X+0.0112. The %RSD value is below 2.0 for intraday and interday precision indicated that the method is highly precised. The percentage recovery value was higher than 100%, indicating the accuracy of the method and absence of interference of the excipients present in the formulation. The proposed method will be suitable for the analysis of Risperidone in bulk and pharmaceutical formulations.
Keywords:
Risperidone, Spectroscopy,
Estimation, Validation
Correspondence to Author:
Moynul Hasan
Available online on www.ijpsr.com 379 INTRODUCTION: Risperidone is psychotropic agent
used to treat schizophrenia, action of which is mediated through a combination of dopamine Type 2 (D 2 ) and serotonin Type 2 (5HT 2 ) receptor
antagonism. It is a selective monoaminergic antagonist with high affinity for 5HT 2, D 2 and H1
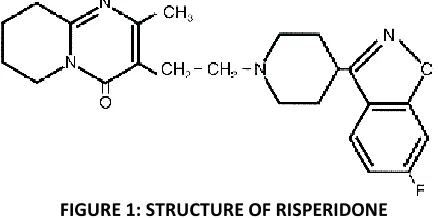
[image:2.612.59.278.260.369.2]histaminergic receptors 1. It belongs to chemical class of benzisoxazole derivatives and is 3-[2-[4-(6-fluoro-1, 2-benzisoxazol-3-yl)-1-piperidinyl] ethyl]-6, 7, 8, 9-tetrahydro-2-methyl-4H-pyrido- [1, 2-a]-pyrimidin-4-one (Fig. 1) with molecular formula of C 23 H 27 FN 4 O 2 and molecular weight of 410.49.
FIGURE 1: STRUCTURE OF RISPERIDONE
Literature survey revealed that various methods have been reported for estimation of Risperidone in biological matrices such as plasma with help of LC 2, 3 , LC with diode array detection 4 , LC with tandem mass spectrometry 5, 6, 7 and LC with electrochemical detection 8. Few stability-indicating methods have been reported for determination of Risperidone in bulk powder and tablets in presence of its degradation products 9, 10.
However very few methods were reported for quantitation of Risperidone in tablet dosage forms in the literature. The objective of the present investigations was to develop a simple, accurate and economical spectrophotometric methods for estimation of Risperidone in tablet formulations. MATERIALS AND METHODS:
Chemicals and Reagents: Risperidone was
receieved as a gift sample from ACI Pharmaceutical Ltd, Bangladesh and Risperidone tablet manufactured by Orion Laboratories Ltd,
Bangladesh were purchased from local market. Analytical grade Hydrochloric acid (0.1N HCL) used as solvent.
Instruments: UV-Visible double beam
spectrophotometer (UV-1601 PC SHIMADZU Limited, Japan), Micropipette of Variable volume 10-1000 μL (Gene Pete Co.) and Digital balance (Citizen Co.)
Methods:
Selection of Wavelength: In order to ascertain the wavelength of maximum absorption (λmax) of the
drug, different solutions of the drugs (5μg/mL and 10μg/mL) in 0.1N HCl were scanned using spectrophotometer within the wavelength region of 200-380nm against methanol as blank. The resulting spectra showed characteristic absorption maxima at 202nm for Risperidone.
Preparation of Standard Solution for Calibration: 10 mg Standard Risperidone was accurately weighed and transferred to 100 mL volumetric flask and was dissolved properly and diluted up to the mark with 0.1N HCl. Then 5mL of this solution was diluted to 100mL with 0.1N HCl . Appropriate amounts of this stock solution were diluted with the same solvent, yields concentrations of 2.5g/mL, 5g/mL, 10g/mL, 15g/ml and 20g/mL which were used for the construction of calibration curve.
Available online on www.ijpsr.com 380 solvent. After suitable dilution, the absorbance of
final sample was recorded against the blank at 202 nm. All determinations were conducted in triplicate (Table 1).
The proposed method was validated according to ich guidelines for linearity, precision, accuracy, stability, lod, loq and stability 11 (Table 2). Linearity: The linearity of this method was determined at five concentration levels ranging from 2.5g/mL-20g/mL . The plot of absorbance Vs respective concentration (Fig. 2) of Risperidone was found to be linear in the range of 2.5g/mL- 20g/mL. Beer’s law was obeyed over this concentration range. The regression equation was found to be Y =0.0508X + 0.0112 and the correlation coefficient (r) of the standard curve was found to be 0.9991 (Table 2).
Precision: The precision of the assay was determined by repeatability (intraday) and intermediate precision (inter-day) and reported as %RSD. For this, 5μg/mL concentration solution was measured three times in day and same was measured in next three days. Then the %RSD was calculated.
Accuracy (Recovery Studies): Recovery studies were performed to judge the accuracy of the method and were carried out by adding a known quantity of pure drug to the preanalyzed formulation and the proposed method was followed. From the amount of drug found, percentage recovery was calculated. Recovery study was carried out at three levels 80%, 100% and 120% for the formulation concentration of 5µg/mL (Table 3).
LOD & LOQ: LOD (k= 3.3) and LOQ (k= 10) of the method were established according to ICH definitions. LOD and LOQ of method are reported in Table 2. In this study, LOD and LOQ were based on the standard deviation of the response and the
slope of the corresponding curve using the following equations;
LOD = 3.3 S/M; LOQ = 10 S/M
Where S is the standard deviation of the absorbance of the sample and M is the slope of the calibrations curve.
Stability Study: In order to demonstrate the stability of both standard and sample solutions during analysis, both solutions were analyzed over a period of 24 h at room temperature and % RSD of absorbance for both solutions was calculated. RESULTS & DISCUSSION: The λmax of Risperidone
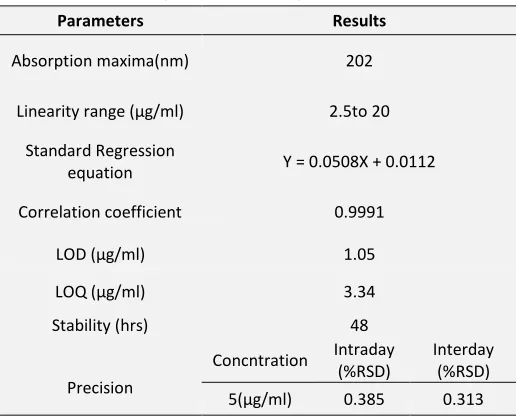
was found to be 202nm. From the optical characteristics (Table 2) of the proposed method, it was found that Risperidone obeys linearity within the concentration range of 2.5 to 20µg/mL and coefficient correlation was found to be 0.9991. The regression of the curve was Y =0.0508X+0.0112. The detection and quantization limits as LOD (k=3.3) and LOQ (k=10) were calculated and these were found to be 1.05µg/mL and 3.34µg/mL respectively.
The precision (measurements of intraday and interday) results showed (Table 2) good reproducibility with percent relative standard deviation (% RSD) is below 2.0. This indicated that method is highly precised. The percentage recovery value (table 3), which was higher than 100 %, indicating the accuracy of the method and absence of interference of the excipients present in the formulation.
Available online on www.ijpsr.com 381 was also applied for the assay of Risperidone in
[image:4.612.45.282.148.450.2]tablet formulation (in triplicate) and the results are presented in Table 4. The results obtained were good agreement with the label claims.
TABLE 1: DATA FOR STANDARD CURVE
Concentration (μg/ml) Absorbance
0.00 0.000
2.5 0.134
5 0.278
10 0.525 15 0.785
20 1.014
[image:4.612.42.300.486.695.2]FIG. 2: STANDARD CURVE OF RISPERIDONE
TABLE 2: VALIDATION PARAMETERS
Parameters Results
Absorption maxima(nm) 202
Linearity range (µg/ml) 2.5to 20
Standard Regression
equation Y = 0.0508X + 0.0112
Correlation coefficient 0.9991
LOD (µg/ml) 1.05
LOQ (µg/ml) 3.34
Stability (hrs) 48
Precision
Concntration Intraday (%RSD)
Interday (%RSD) 5(µg/ml) 0.385 0.313
TABLE 3: RECOVERY STUDY
Level of Addition (%)
Formulation (µg/ml)
Addition of pure drug
(µg/ml)
% Recovery of pure
drug
Recovery (%)±S.D.
80 5 4 100.5
100 5 5 100.5 100.67±0.29 120 5 6 101.0
TABLE 4: DETERMINATIONS OF ACTIVE INGREDIENTS IN TABLETS
Sample Label
claimed Amount found
% Labeled Claim*
Risperidone 2 mg/tablet 2.01±0.008 100.5
* Average of three determinations
CONCLUSION: The proposed method was simple, sensitive and reliable with good precision and accuracy. The proposed method is specific while estimating the commercial formulations without interference of excipients and other additives. Hence, this method can be used for the routine determination of Risperidone in pure samples and pharmaceutical formulations.
ACKNOWLEDGEMENTS: The authors are thankful to Orion Laboratories Ltd for providing necessary facilities for conducting this research work.
REFERENCES:
1. Stahl SM, Essential psychopharmacology. 2nd ed., Cambridge: Cambridge University Press; 2000, 425-434. 2. Titier K, Dιridet E, Cardone E, Abouelfath A, Moore N: Simplified high-performance liquid chromatographic method for determination of risperidone and 9-hydroxyrisperidone in plasma after overdose. J Chromatogra Bio Sci Appl 2002; 772:373-378.
3. Woestenborghs R, Lorreyne W, Rompaey F, Heykants J: Determination of risperidone and 9-hydroxyrisperidone in plasma, urine and animal tissues by high-performance liquid chromatography. J Chromatogra Bio Sci Appl 1992; 583: 223-230.
Available online on www.ijpsr.com 382 5. Zhou Z, Li X, Li K, Xie Z, Cheng Z, Peng W: Simultaneous
determination of clozapine, olanzapine, risperidone and quetiapine in plasma by high-performance liquid chromatography-electrospray ionization mass spectrometry. J Chromatogra Bio Sci Appl 2004; 802:257-262.
6. Flarakos J, Luo W, Aman M, Svinarov D, Gerber N, Vouros P: Quantification of risperidone and 9-hydroxyrisperidone in plasma and saliva from adult and pediatric patients by liquid chromatography-mass spectrometry. J Chromatogra A 2004; 1026:175-183.
7. Remmerie BM, Sips L, Vries R, Jong J, Schothuis A, Hooijschuur E. Validated method for the determination of risperidone and 9-hydroxyrisperidone in human plasma by liquid chromatography-tandem mass spectrometry. J Chromatogra Bio Sci Appl 2003; 783:461-472.
8. Moing J, Edouard S, Levron J: Determination of risperidone and 9-hydroxyrisperidone in human plasma by high-performance liquid chromatography with electrochemical detection. J Chromatogra Bio Sci Appl 1993; 614:333-339. 9. Sherif EL, Zeanu B, Houssini M: High performance liquid
chromatographic and thin layer densitometric methods for the determination of risperidone in the presence of its degradation products in bulk powder and in tablets. J Pharm Biomed Anal 2005; 36:975-981.
10. Tomar RS, Joseph TJ, Murthy AS, Yadav DV, Subbaiah G, Krishna Reddy KV: Identification and characterization of major degradation products of risperidone in bulk drug and pharmaceutical dosage forms.J Pharm Biomed Anal. 2004; 36:231-235.
11. Validation of Analytical Procedures: Text and Methodology, Proceedings of International Conference on Harmonization (ICH). Geneva, 2005