Full Length Research Article
CORRELATION BETWEEN ACCURACY SENSITIVITY SPECIFICITY AND POSITIVE PREDICTIVE
VALUE PARAMETERS IN DETECTING DIFFERENTIALLY EXPRESSED GENES
*
1,2Dago Dougba Noel,
2Lallié Hermann Désiré N. M.,
2Diarrassouba Nafan,
2Silué Souleymane and
3Giovanni Malerba
1
Department of Biotechnology, University of Verona, Italy Strada le Grazie 15, Cà vignal 1, 837134 Verona, Italy
2
Unité Formation Recherche (UFR) Sciences Biologiques, Université Péléforo Gon Coulibaly de Korhogo,
BP1328 Korhogo, Côte d’Ivoire
3
Department of Life and Reproduction sciences, Section of Biology and Genetics, University of Verona,
Strada le Grazie 837134 Verona, Italy
ARTICLE INFO ABSTRACT
RNA-seq high-throughput sequencing technology is rapidly becoming the standard method for measuring RNA expression levels. We previously evaluated the performance of different grape microarray design strategies based on custom microarray platforms assuming RNA-seq gene expression data as a reference. We subsequently evaluated sensitivity, specificity, accuracy and positive predictive value (PPV) parameters of these microarray design strategies in detecting significantly differential expressed genes (DEGs) in gene expression differential analysis. For this paper we investigated the relationship between these parameters applying several R software statistical tests and functions. This survey emphasizes a strong discrepancy between sensitivity and specificity parameters (p-value ≤ 0.001) evaluating the analyzed grape microarray design strategies performance in discriminating significantly differentially expressed genes. Furthermore, we demonstrated a substantial correlation and a lower variance difference between specificity, accuracy and PPV parameters estimating microarrays’ capacity to detect differentially expressed genes.
Copyright © 2015 Dago Dougba Noel et al. This is an open access article distributed under the Creative Commons Attribution License, which permits unrestricted use, distribution, and reproduction in any medium, provided the original work is properly cited.
INTRODUCTION
With the fast development of high-throughput sequencing technologies, a new generation of genome-wide gene expression measurements is under way. This is based on mRNA sequencing (RNA-seq), which complements the already well-established technology of microarrays, and is expected to overcome some of the latter’s disadvantages. These RNA-seq data pose new challenges, however, as the strengths and weaknesses have yet to be fully identified. Ideally, Next Generation Sequencing (NGS) measures can be integrated for more comprehensive gene expression investigation and to facilitate analysis of whole regulatory networks. Analysis of the gene expression process has been an
important topic for many years (Baldi et al., 2002), as it can
*Corresponding author: Dago Dougba Noel
Department of Biotechnology, University of Verona, Italy Strada le Grazie 15, Cà vignal 1, 837134 Verona, Italy
produce results that are key to understanding the way in which genetic information is processed, as well as the mechanisms involved in both natural and abnormal processes. With the developments of microarray technologies, which allow for gene expression quantification of a very large number of genes at the same time, this analysis has moved from gene to
genome level (Baldi et al., 2002). Recent advances in high
throughput sequencing technologies NGS have introduced a new alternative to microarrays, namely RNA-seq (Mortazavi et al., 2008). This quantifies gene expression by sequencing short strands of cDNA, aligning sequences obtained back to the genome or transcriptome, and counting the aligned reads for each gene. This technology is expected to overcome some of the disadvantages of microarrays. For instance, it may be used to identify transcripts that have not been previously
annotated (Hurd et al., 2009) and it may even quantify both
very low transcripts (unlike microarrays where there is
background noise interference) (Mortazavi et al., 2008), and
very high ones (where microarrays suffer from hybridisation saturation, i.e. only a limited amount of cDNA can hybridise
ISSN: 2230-9926
International Journal of Development Research
Vol. 5, Issue, 03, pp. 3734-3739, March,2015
DEVELOPMENT RESEARCH
Article History:
Received 13th December, 2014 Received in revised form 20th January, 2015
Accepted 06th February, 2015 Published online 17th March, 2015
Key words:
to a microarray spot) (Hurd et al., 2009). Accordingly, NGS technologies are now challenging microarrays as the tool of choice for genome analysis. The increased affordability of comprehensive sequence-based genomic analysis will enable new questions to be addressed in many areas of biology. It is inevitable that massively-parallel sequencing platforms will supercede the microarray for many applications, however, there are niches for microarrays to fill and interestingly we may very well witness a symbiotic relationship between microarrays and high-throughput sequencing in the future (Lin Feng et al., 2010). In fact, we previously estimated the performance assessment of different grape microarray design strategies based on single and/or multiple short and/or long oligonucleotides per gene model transcripts with NGS RNA-seq approach evaluating their sensitivity, specificity, accuracy,
and positive predictive value (PPV) parameters in
discriminating significantly differentially expressed genes (DEGs) in gene expression differential analysis (Dago Noel, 2012). In the present study we re-estimated these statistical parameters and evaluated the relationship between them evaluating the ability of microarrays to discriminate DEGs previously recognized as such by NGS RNA-seq approach in gene expression differential analysis. For this reason, we based our analysis on different functions and statistical tests of R package such as R fitting curve analysis, Pearson correlation test and variance estimation test by using a principal
component (PCA) analysis (Gabriel, 1971, Ian Jolliffe, 2005).
MATERIALS AND METHODS
a. Accuracy, Sensibility, Specificity and positive
predictive values (PPV) parameters.
We hereby estimate the accuracy, the sensibility, the specificity and the PPV of four previously developed grape microarray design strategies in detecting DEGs in gene expression differential analysis assuming RNA-seq gene
expression data as reference (Dago Noel, 2012). We
re-estimated these parameters basing on their below reported mathematical formula.
Sensitivity : measures the proportion of actual positives which are correctly identified as such.
Sensitivity= Number of true positive ÷ (Number of true positives + Number of false negatives)
Specificity: measures the proportion of negatives which are correctly identified
Specificity=Number of true negatives ÷ (Number of true negatives + Number of false positives)
In the fields of statistics, the accuracy of a measurement is the degree of closeness of measurements of a quantity to that quantity's actual (true) value.
Accuracy= (Number of true positives + Number of true negatives)÷ (Number of true positives + Number of false positives+ Number of false negatives + Number of true negatives)
In statistics and diagnostic testing, the positive predictive value, or precision rate is the proportion of subjects with positive test results who are correctly diagnosed.
PPV= Number of true positives÷ Number of positives calls
b. Pearson correlation, variance estimation based on
principal component analysis (PCA) and curve function analysis based on R software (R version 3.1.2).
R is a free software environment for statistical computing and graphics. It compiles and runs on a wide variety of UNIX platforms, Windows and MacOS. We estimated the correlation between sensitivity, accuracy, specificity and PPV parameters using the R (V. 3.1.2) statistical correlation test (cor.test). We also estimated the variance of the analyzed parameters by performing the principal component analysis (PCA) based on R software. One of the many handy, and perhaps under-appreciated, functions in R is the curve fitting analysis. It is a neat little function that provides mathematical plotting, e.g., to plot functions. The curve function takes, as its first argument, an R expression. That expression should be a mathematical function in terms of x. For the present analysis we set the PPV parameter (arbitrary choice) as the above described mathematical function. We applied R curve fitting function to the analyzed parameters (sensitivity, specificity, accuracy and PPV) with the aim to predict their degree of agreement and/or disagreement. Intensity signal for the analyzed grape microarray design strategies has been normalized using all the normalization combination methods (unpublished data) on the R limma package (Smyth, 2005). All background correction combination and different internal probes average parameters
(mean, median) based on R limma package (Smyth, 2005) for
all grape microarray designs intensity data pre-processing and differential analysis respectively have been considered. Then, for this survey 240 background correction combination and different internal probes average parameters have been considered (unpublished data).
RESULTS
Relationship between accuracy, sensitivity, specificity and PPV parameters by R curve fitting analysis
This analysis based on commonly expressed genes between both RNA-seq and the four analyzed grape microarray design platforms (Dago Noel, 2012). We were able to calculate approximately sensitivity, specificity, accuracy, and PPV parameters values basing on their different mathematical definitions as reported in the materials and methods chapter. For each analyzed grape microarray design platforms, we used several combinations of background subtraction and all combinations of data normalization procedures based on limma package (Smyth, 2005) of R software. In total we analyzed 240 combinations (unpublished data). We then compared each calculated statistical parameters with the aim of predicting their agreement and/or disagreement evaluating
Number of differentially expressed genes by RNA-seq
True False
Number of differentially expressed genes by
grape microarray designs (test outcome)
True True positive False positive
microarrays performance in detecting DEGs. For this we used
R software curve fitting function (Sandra Lach Arlinghaus et
al., 1994, William M. Kolb, 1984) which is the process of
constructing a curve, or mathematical function, that has the best fit to a series of data points (Halli, 1992), possibly subject to constraints. Interestingly, fitted curves can be used as an aid
for data visualization (Halimah Badioze Zaman et al., 2009,
John R. Hauser, 2009) to summarize the relationships among
two or more variables (Sandra Lach Arlinghaus, 1994).
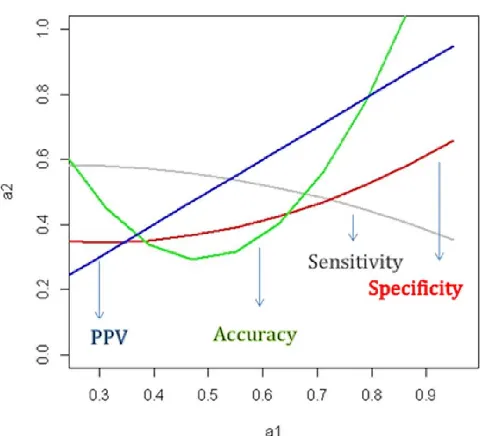
Moreover, all analyzed statistical parameters curve have been fitted by PPV parameters (arbitrary choice). Results of curve fitting analysis of sensitivity, specificity, accuracy and PPV parameters applying polynomial curves to data points have been summarized in Fig.1 and suggest two tendencies. In fact, while the fitting curves associated with specificity, accuracy and the PPV parameters that evaluate microarrays performance detecting DEGs increase, those of sensitivity parameters (gray curve) decreases (Fig.1). These results suggest a good agreement between specificity, accuracy and PPV parameters evaluating grape microarrays performance in calling DEGs when RNA-seq gene expression data set has been assumed as reference. Further, Fig. 1 shows the opposite behavior of fitting curves associated with sensitivity (gray curve) and specificity (red curve) parameters suggesting a lower agreement between these parameters evaluating microarrays ability to detect DEGs.
Pearson correlation between accuracy, sensitivity, specificity and PPV parameters
We performed a Pearson correlation test analysis between the four analyzed parameters. The results of this analysis have been reported in Table 1 (Pearson correlation table) and show a good correlation between specificity and accuracy
[image:3.595.311.553.50.268.2]parameters (R2:0.82).
Table 1. Pearson correlation between accuracy, PPV, sensitivity and specificity parameters
Sensitivity Specificity Accuracy PPV Sensitivity 1
Specificity -0.88 *** 1
Accuracy -0.44 *** 0.82 *** 1
PPV -0.59 *** 0.73 *** 0.78 *** 1 Degree of freedom (df): 238; *** p-value ≤ 0.001, ** 0.01 < p-value ≤ 0.1 and * p-value < 0.1
Furthermore, a substantial correlation has been observed between specificity, accuracy and PPV parameters. As previously showed, two tendencies have been observed in the above survey (see Fig. 1). In fact, while specificity, accuracy and PPV parameters displayed a discrete correlation between themselves, it is interesting to observe a lack of correlation between the formers and sensitivity parameter (see Table 1). Moreover, it is noteworthy to observe that sensitivity and specificity parameters exhibited a negative correlation (very low correlation see Table 1), suggesting the incapacity of the four analyzed grape microarray design strategies to associate these two parameters in discriminating DEGs in gene expression differential analysis. These results also suggest that an high specificity of grape microarray platforms in detecting DEGs could predict their good accuracy and PPV discriminating DEGs in differential analysis.
Fig. 1. Curve fitting describing relationship between sensitivity, specificity, accuracy and PPV parameters. Sensitivity, accuracy and specificity parameters have been fitted by PPV parameter
Euclidian distance of Person correlation among accuracy, sensitivity, specificity and PPV parameters
We next calculated the Euclidian distance between the Pearson correlation of the analyzed statistical parameters as reported in Fig. 2. As previously suggested (see above), two groups and/or tendencies and/or cluster groups have been also discriminated in this analysis. The cluster dendrogram analysis based on the Euclidian distance of the Pearson correlation between the 4 analyzed statistical parameters, showed two different cluster groups strongly distinct among them as expected (Fig. 2).
Fig. 2. Cluster dendrogram of Euclidean distance of Pearson correlation values between accuracy, sensitivity, specificity and
[image:3.595.325.532.479.726.2]The cluster dendrogram analysis reported in Fig.2 suggests a very low agreement between sensitivity and specificity parameters in the evaluation of the analyzed microarrays performance detecting DEGs. In other words, these results support the idea that it is practically impossible for the analyzed grape microarray design strategies to combine a high specificity and a high sensitivity parameters in detecting DEGs in gene expression differential analysis. Further this analysis showed that specificity parameter, are effective predicting PPV and accuracy parameters (Fig. 2) in discriminating DEGs previously recognized as such by NGS RNA-seq approach.
Accuracy, sensitivity, specificity and PPV variance estimation by PCA analysis
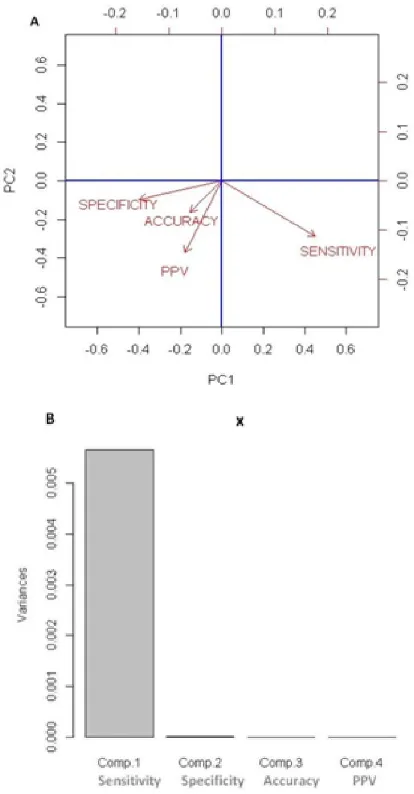
[image:4.595.60.267.330.727.2]The biplot provides a useful tool for data analysis and allows for the visual appraisal of the structure of large data matrices. It is especially effective in principal component analysis, where the biplot can show inter-unit distances and indicate clustering of units as well as display variances and correlations of the variables. Here we used biplot (Gabriel, 1971) for the clustering of accuracy, sensitivity, specificity and PPV parameters basing on their variance variables.
Fig. 3. PCA analysis to evaluate variance variability of sensitivity, specificity, accuracy and PPV statistical parameters. The probability of these variance test ranges from 0.004 to 0.7
The evaluation of the variance estimation, due to the large multivariate datasets have been processed by the principal component analysis (PCA) that reduces the dimensionality of the analyzed parameters. The principal component analysis facilitates the observation of different behavior among the four analyzed parameters evaluating grape arrays performance in discriminating DEGs. However, the PCA analysis based on variance estimation of the 4 analyzed statistical parameters and visualized by the biplot, evidenced a good clustering (small variance difference) between accuracy, specificity and PPV parameters with respect to sensitivity parameter (see Fig. 3 panel A). These observations suggest a good agreement between specificity, accuracy and PPV parameters evaluating grape microarray platforms ability discriminating DEGs. Moreover, even if the estimated variance difference between specificity, accuracy and PPV parameters is negligible, it is noteworthy to observe a relatively considerable variance difference between specificity and PPV parameters (Fig. 3 panel A). On the other hand, a high variance difference was observed between specificity and sensitivity parameters, suggesting the incapacity of the analyzed microarray designs to combine these two parameters in the selection of DEGs in gene expression differential analysis. However, as shown in panel B of Fig. 3, the low agreement between sensitivity parameter and that of the other could be due to it high intersect variance variability with respect to those of sensitivity, accuracy and PPV parameters when several combination of microarray background correction and expression data normalization methods have been applied.
DISCUSSION
Compared to microarrays, RNA-seq technology offers increased specificity and sensitivity, for enhanced detection of
genes, transcripts, and differential expression (Lin Feng et al.,
2010). Sequencing coverage depth can easily be increased to detect rare transcripts, single transcripts per cell, or weakly
expressed genes (Song Lu et al., 2010). However, with array
hybridization technology, gene expression measurement is limited by background at the low end and signal saturation at the high end. RNA-seq technology quantifies discrete, digital sequencing read counts, offering a broader dynamic range
(Song Lu et al., 2010). Gene expression microarray have been
commercially available for more than 15 years, providing researchers with biological meaningful results that have enhanced our understanding of disease progression and supported advances in therapeutic development.
However, several studies have been compared microarray and RNA-seq gene expression analysis showing the superiority of
RNA-seq with respect to microarray (John C. Marioni et al.,
2008, Dago D. Noel et al., 2014). In fact Many researchers are
now transitioning to NGS approaches and RNA-seq in particular, due to its discovery based nature, improved sensitivity, and dynamic range. Additionally, RNA-seq allows for the analysis of gene isoforms, splice variants, and novel gene fusions. Given the voluminous amounts of past microarray data, there is now a need to associate and integrate microarray and RNA-seq data via advanced bioinformatic
approaches (Shweta S Chavan et al., 2013). Integration of
in discriminating DEGs. Hence, we calculated sensitivity, specificity, accuracy and PPV statistical parameter values of our previously analyzed grape microarray design strategy platforms applying several combination of array background correction and data normalization methods (240 combination in total) (unpublished data) with the aim to study their relationship evaluating microarrays capacity to call DEGs. Performance of a gene expression analysis tools can be measured (i) in terms of theoretic aim that result associated of the detection of the high rate of true positive DEGs (PPV) and (ii) in terms of functional aim that consists of detecting as many as possible DEGs (sensitivity). The high level of these two parameters discriminating DEGs in gene expression differential analysis could result in a good performance of the
under-analyzed gene expression tool (Liu et al., 2002). Our
analysis exhibited a low correlation between sensitivity and PPV parameters. Further, we showed that while the fitted curve associated to the PPV parameter increased, those associated with the sensitivity parameters decreased (Fig. 1) suggesting a few true positive DEGs calling by the analyzed grape microarray design strategies.
However, a good correlation has been observed between specificity, accuracy and PPV. Moreover clustering analysis based on the Pearson correlation analysis suggests that accuracy predict effectively the specificity of analyzed microarrays discriminating DEGs in gene expression differential analysis when RNA-seq was assumed as reference (Fig. 2). Variance estimation analysis based on principal component analysis showed a high variance difference between sensitivity and specificity parameters. It is noteworthy to observe that the biplot that provides a useful tool of data analysis and allows for a visual appraisal of the
structure of large data matrices (Gabriel, 1971; Gabriel et al.,
1990) also showed a relatively high variance variability between sensitivity and specificity parameters (Fig. 3). Taking together, these results supposed the detection of few true DEGs by all analyzed microarray platform and design strategies. In other words, we showed that microarray gene expression analysis technologies independently of the applied background correction and data normalization methods, were not able to associate sensitivity and specificity statistical
parameters in discriminating DEGs (Liu et al., 2002).
Variance analysis also showed a good clustering between specificity, accuracy and PPV parameters. Low agreement between sensitivity and PPV, accuracy and specificity influence the performance of microarrays in gene expression differential analysis (detecting either few true positive called DEGs either many false positive called DEGs). Further, in Fig. 1, the behavior of the fitted curves associated to sensitivity parameter decrease while those associated to sensitivity, accuracy and PPV parameters increase. Next, Fig. 2 and Fig. 3 (panel A) and Table 1 evidenced the discrepancy between sensitivity and specificity parameters in evaluating grape microarray design strategies performance in gene expression differential analysis when compared with expression data set of RNA-seq. Taking these results into account as a whole suggests the difficulty of microarrays to detect a high rate of true positive DEGs previously recognized as such by RNA-seq
(Marioni, Mason et al., 2008). We also showed that the
combination of several microarray background correction and
data normalization methods influence the variability of the sensitivity parameter with respect to the other’s (Fig. 3 and panel B). We supposed that the discrepancy between sensitivity and accuracy, specificity and PPV could be due to the former high variance variability. In conclusion this survey showed a good agreement between accuracy, specificity and PPV statistical parameters evaluating microarrays performance detecting DEGs in gene expression differential analysis. Next, we demonstrated that the accuracy parameter effectively predict the specificity and the PPV parameters in evaluating microarray capacity to detect DEGs. Finally we demonstrated that the incapacity of all analyzed grape microarray design strategies to combine both sensitivity and specificity parameters in gene expression differential reduce their performance in detecting DEGs previously detected as such by RNA-seq approach.
Acknowledgements
Professor Massimo Delledonne Director of the Functional Genomic Center of the University of Verona-Italy.
REFERENCES
Baldi, P. and Hatfield, W. 2002. DNA Microarray and Gene Expression. From experiments to data analysis and modelling. Cambridge University Press.
Dago Dougba Noel, Alberto Ferrarini, Diarrassouba Nafan, Fofana Inza Jésus, Silué Souleymane, Giovanni Malerba and Massimo Delledonne, 2014. Probes specificity in array design influence the agreement between microarray and RNA-Seq in gene expression analysis. African Journal of Science and Research, (3) 5:08-12 ISSN: 2306-5877 Available Online: http://ajsr.rstpublishers.com/.
Dago Noel, 2012. Performance assessment of different microarray designs using RNA-Seq as reference Id prodotto: 67051; Id Ugov: 404537.
Gabriel, K. R. 1971. The biplot graphic display of matrices with application to principal component analysis Biometrika 58 (3): 453-467.
Gabriel, K. R. and Odoroff, C. L. 1990. Biplots in biomedical
research. Statistics in Medicine, 9, 469–485.
Halimah Badioze Zaman, Peter Robinson, Maria Petrou, Patrick Olivier and Heiko Schröder, 2009. Visual Informatics Page 689.
Halli, S.S. and K.V. Rao, 1992. Advanced Techniques of
Population Analysis. isbn 0306439972 Page 165 (cf. ...
functions are fulfilled if we have a good to moderate fit for the observed data).
Hurd, PJ. and Nelson, CJ. 2009. Advantages of next-generation sequencing versus the microarray in epigenetic research. Briefings in Functional Genomics & Proteomics 8:174–183.
Ian Jolliffe, 15 Oct. 2005. Principal Component Analysis Published Online: DOI: 10.1002/0470013192.bsa501. John C. Marioni, Christopher E. Mason, Shrikant M. Mane, et
al. 2008 Jun 11. RNA-Seq: an assessment of technical reproducibility and comparison with gene expression arrays. Genome Res. 18:1509-1517 doi:10.1101/gr. 079558108.
Lin Feng, Hang Liu, Yu Liu, Zhike Lu, Guangwu Guo, Suping Guo, Hongwei Zheng, Yanning Gao, Shujun Cheng, Jian Wang, Kaitai Zhang and Yong Zhang, 2010. Power of Deep Sequencing and Agilent Microarray for Gene Expression Profiling Study. Mol Biotechnol. 45:101–110 DOI 10.1007/s12033-010-9249-6.
Liu, W.M., R. Mei, X. Di, T. B. Ryder, E. Hubbell, S. Dee, T. A. Webster, C. A. Harrington, M. H. Ho, J. Baid and S. P. Smeekens, 2002. Analysis of high density expression microarrays with signed-rank call algorithms Applied Research and Production Development, Affymatrix, Inc., 3380 Central Expressway, Santa Clara, CA 95051, USA . Marioni, J., Mason, C., Mane, S., Stephens, M. and Gilad, Y.
2008. RNA-Seq: an assessment of technical reproducibility and comparison with gene expression arrays. Genome research 18: 1509.
Mortazavi, A., Williams, BA., McCue, K., Schaeffer, L. And Wold, B. 2008. Mapping and quantifying mammalian transcriptomes by RNA-Seq. Nature Methods 5:621–628. Sandra Lach Arlinghaus, 1994. PHB Practical Handbook of
Curve Fitting. CRC Press.
Sandra Lach Arlinghaus, 1994. PHB Practical Handbook of Curve Fitting. CRC Press.
Shweta S. Chavan, Michael A. Bauer, Erich A. Peterson,
Christoph J. Heuck and Donald J. Johann, 2013. Towards
the integration, annotation and association of historical
microarray experiments with RNA-seq BMC
Bioinformatics, 14 (Suppl 14):S4 doi:10.1186/1471-2105-14-S14-S4.
Smyth, G.K. 2005. Limma: linear models for microarray data edited by: R. Gentleman, V. Carey, S. Dudoit, R. Irizarry. W. Huber 2005. In Bioinformatics and Computational Biology Solutions using R and Bioconductor, pp.397-420. Song Liu, Lan Lin, Peng Jiang, Dan Wang and Yi Xing, 2010. A comparison of RNA-Seq and high-density exon array for detecting differential gene expression between closely related species 578–588 Nucleic Acids Research, 2011, Vol. 39, No. 2 Published online 22 September 2010 doi:10.1093/nar/gkq817.
William M. Kolb, 1984. Curve Fitting for Programmable Calculators. Syntec, Incorporated.