IJPSR (2014), Volume 5, Issue 9 (Research Article)
Received on 06 March 2014; received in revised form, 26 May 2014; accepted, 28 June 2014; published 01 September 2014
ULTRASOUND ASSISTED EXTRACTION OF QUERCETIN FROM CABBAGE
Brajesh Kumar 1, 2 *, Kumari Smita 1 and Brajendra Kumar 3
Centro de Nanociencia y Nanotecnologia, Universidad de las Fuerzas Armadas-ESPE 1, Av. Gral. Rumiñahui s/n, Sangolqui, P.O. BOX 171-5-231B, Ecuador.
Department of Chemistry, TATA College, Kolhan University 2, Chaibasa - 833202, Jharkhand, India. Department of Computer Science and Engineering, National Institute of Technology 3, Durgapur - 713209, West Bengal, India.
ABSTRACT: Cabbage is an important vegetable crop of the Brassicaceae
family consumed all over the world and regularly used in our day to day life. It contains potentially health-promoting flavonoid compounds such as quercetin. Flavonoids are secondary plant metabolites that are synthesized via the shikimate pathway. In this study, extraction yield of quercetin from cabbage by application of ultrasound-assisted extraction (UAE) was studied with three different methanol: water mixture ratios; 40:60, 60:40 and 80:20, (v/v) for 30, 40 and 60 min. Effect of ultrasound was observed, and the presence of methanol in the solvent also improved greatly the extraction process. High-Performance Liquid Chromatography (HPLC) has been an important tool for the separation of these metabolites in the last 4 decades. Quercetin contents of the samples were determined by HPLC method. It was determined that the most efficient application for extracting samples under sonication by 60:40 methanol/water (v/v) at 30 °C for a 40 min run (1378. 9 μg/mL).
INTRODUCTION: The Chinese cabbage (Brassica rapa var. pekinensis) is one of the most important vegetables in the B. rapa (campestris) (2n = 20) group and is a native of China. Because of the high content of flavonoids, it is also important for health benefits. It is believed to have originated by the natural crossing of ‘Pak choi’ and ‘turnip.’ Based on the head type, Chinese cabbage is available in different forms. Also, this vegetable became more popular due to the richness in
phytochemicals such as polyphenolics,
glucosinolates, carotenoids, and vitamin C that have shown antioxidant, anticancer 1, and potential anti-obesity properties 2.
QUICK RESPONSE CODE
DOI:
10.13040/IJPSR.0975-8232.5(9).3779-83
This article can be accessed online on www.ijpsr.com
DOI link: http://dx.doi.org/10.13040/IJPSR.0975-8232.5(9).3779-83
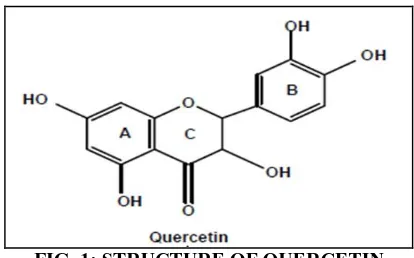
[image:1.612.335.542.514.643.2]Quercetin Fig. 1 is the most common component in Chinese cabbage, but many other compounds can also influence the final quality of quercetin for its characterization.
FIG. 1: STRUCTURE OF QUERCETIN
In recent years, several analytical methods have been reported to obtain such valuable natural compounds from plants for commercialization, including supercritical fluid extraction 3, ultrasound-assisted extraction 4, microwave assisted extraction 5, and solid phase extraction 6.
Keywords:
Quercetin, Flavonol, Ultrasound-assisted extraction, HPLC, Solvent
Correspondence to Author: Brajesh Kumar
Assistant Professor and Head, Department of Chemistry, TATA College, Kolhan University, Chaibasa - 833202, Jharkhand, India.
It has few advantages like shortening the extraction time, less solvent consumption, high extraction yield, and also enhances the quality of extracts. In ultrasonic applications, sound waves are generating at frequencies greater than human hearing range, can alter the materials both in physical and chemical ways applying sponge effect and cavitations 7. This technique is efficient with lower liquid-solid ratios by increasing the mass transfer rate. These effects enhance solvent penetration in solid and cease the release of extracts by destroying the solid matrix. Implosions of cavitation bubbles generate high pressure and temperature and enough to obtain sufficient reaction energy 8. Ultrasonic assistance has also been used successfully in some process of the food industry like emulsification,
crystallization, filtration, separation, de-foaming, extrusion, fermentation, and microbial inhibition 9-11
[image:2.612.50.566.291.693.2], etc. Table 1 shows the contents of major flavonols in fruits and vegetables 12. The quercetin content in the different fruits and vegetables varied greatly. The data indicate that the significant amount of quercetin present in cabbage, as major flavonols. Quercetin is a naturally available antioxidant and various health benefits. On looking this importance of cabbage and benefit of ultrasound, the present work is aimed at exploring the effect of water/ methanol composition and ultrasound radiation time during the extraction of quercetin from cabbage; develop and validate a simple HPLC method for analysis of quercetin in the cabbage.
TABLE 1: CONTENTS OF MAJOR FLAVONOLS IN FRUITS AND VEGETABLES
Fruit/Vegetable Major Flavonol Content (mg/100g fresh weight)
Kaempferol Myricetin Quercetin
Apple (Fuji) 0.01 0—0.03 0—4.91
Beans 8.00—44.37 - 0—0.01
Beets 0 0 0—0.67
Broccoli 0.70—9.15 0—0.03 0—13.70
Brussel sprouts 0.74—1.28 0 0—0.60
Chinese Cabbage 0.01—16.30 0—0.10 0—39.00
Carrots 0—0.60 0—0.40 0—1.50
Cauliflower 0—1.25 0 0—3.90
Cowpeas 1.92 2.60 17.22
Cucumber (with peel) 0 0—0.33 0
Dates - 0 0—2.40
Egg plant 0.01 0.03 0
Garlic Chives 2.12 - 0.12
Grapes (black) 0 0.45 1.26—3.70
Grapes (red) 0—0.01 0—0.03 0—3.98
Grapes (white) 0 0—0.45 0.20—3.87
Kiwifruit 0 0 0
Lemons 0 0 0—3.47
Lettuce 0—0.04 0 0—14.56
Mangos 0.01 0.03 0
Onions (raw) 0—1 0—0.03 1.50—118.70
Onion (red) 0—4.50 0—3.80 0—191.70
Oranges (all varieties) 0—0.01 0—0.03 0—0.90
Pear (raw) 0 0 0—20.50
Pepper (green, hot chilli) 0 1.20 10.50—21.02
Pepper (yellow) 0 0 28.83—78.38
Potato (flesh & skin) 0—0.05 0 0—3.41
Raspberries (raw) 0—0.66 0 0—4.58
Spinach (raw) 0—55 0—0.04 0—27.22
Strawberries (raw) 0—1.61 0—0.03 0—3.20
Tomato (cherry) 0—0.27 - 0.17—20.30
Watercress 1—1.50 0.20 4—8.30
MATERIALS AND METHODS:
Preparation of Standard Solution of Quercetin: A 200, 400, 500 and 800 μgmL-1 standard solutions of quercetin were prepared by transferring 2 mg, 4
method of analytical HPLC grade purity were purchased from commercial sources. Standard quercetin was supplied from Sigma Aldrich, USA.
Extraction of Quercetin: It was performed under sonication using an ultrasonic cleaning bath, Bransonic Ultrasonic Corporation; model no 5510E-DTH (with a frequency of 42 kHz and a nominal power 135 W). 2 g accurately weighed of fresh cabbage were finely chopped, and mixed with 20 ml of methanol: water (40:60, 60:40, 80:20 v: v) mixture. The mixture was homogenized in a high-speed blender for 1 min and transferred to a 50 ml flask. Quercetin present in the sample was extracted for different time intervals, i.e. - 20, 30 and 40 min in an ultrasonic cleaning bath at 30 °C. The sample was cooled and centrifuged at 5000 rpm for 10 min. This procedure was repeated twice and collected supernatants were kept for analysis of quercetin.
Chromatographic Determination of Quercetin: The chromatography system consisted of the Agilent 1100 HPLC system (Agilent Technologies, Palo Alto, CA, USA) with a quaternary pump, an autosampler, and a diode array detector. The system was controlled via the use of Chemstation software (Agilent Technologies, Palo Alto, CA, USA). A sample of 20 µL was injected into an Agilent Eclipse Zorbax XDB column (250 x 4.6 mm, particle size 5 µm) coupled with a C18-type guard column (Phenomenex, Torrance, CA, USA). The flow rate was set to 1 mL min-1. The solvents used for gradient elution were water containing 0.2% TFA in water (A) and 100 % methanol (B). The elution program was as follows: 0 min, 7 % (v/v) of solvent B; 0–8 min, 7%; 8–20 min, 7–15%; 20–35 min, 15-65%; 35–40 min, 65-80%; 40–45
min, 80-7%. Chromatograms were recorded at a wavelength of 270 nm.
RESULTS AND DISCUSSION:
HPLC Method: The present study was aimed to develop an accurate HPLC method for the analysis of quercetin in Chinese cabbage extract at 1 mL min-1 flow rate with methanol/ water as the best mobile phase and C18 column (250 × 4.6 mm, particle size 5 µm) at 270 nm optimum wavelength detection. These parameters and analysis condition were used throughout the analysis. The two common solvents generally used as mobile phase in flavonoid analysis are acetonitrile and methanol, and their UV cutoff λmax is 190 and 205 nm, respectively. They do not interfere with the two UV–VIS absorption bands at 240–285 nm and 300–560 nm corresponding to two aromatic rings (A and B) of the flavonoid aglycones. The chromatography peak, which obtained for this system with the retention times, Rt was determined as 34.203 min for quercetin, Fig. 2a. To calculate the quercetin percentage, calibration graphs for quercetin were constructed by plotting the area of the quercetin peak against the quercetin concentration at three concentration levels (100 – 500 mg/L).
[image:3.612.55.560.581.734.2]A good linear relationship (correlation coefficient (R2) > 0.998) was observed between the concentration of quercetin and the respective peak area. Standards for each concentration level were analyzed in triplicate. The equation obtained from the calibration graph was: y = 5.5684x – 645.3, R2 = 0.9987, (where y is peak area, and x is the concentration of quercetin) quercetin concentration (μg/mL) Fig. 2b.
FIG. 2: HPLC CHROMATOGRAM (A) AND CALIBRATION CURVE (B) FOR STANDARD QUERCETIN AT 270 nm
HPLC method precision and accuracy can often be enhanced by using appropriate internal standard, which also serves to correct for fluctuation in the detector response. To extract quercetin from cabbage, different concentration of methanol was used under sonication, and quantification of quercetin content validated by the proposed HPLC method. The typical chromatogram was obtained
[image:4.612.56.561.176.525.2] [image:4.612.316.566.562.726.2]from different concentration of methanol, Fig. 4. The results obtained for the analysis of quercetin for each sample by HPLC method showed 60% methanol concentration can be used with high efficiency. The HPLC method was simple, rapid, and accurate so that it can be used for the determination of quercetin.
FIG. 3: HPLC CHROMATOGRAM OF CABBAGE EXTRACT AT (A) 40 %, (B) 80 % AND (C) 60 % METHANOL UNDER SONICATION FOR 40 MIN, Rt OF QUERCETIN IS 34.203, λ = 270 nm
Effect of Methanol Concentration and Sonication Time on Quercetin: Increases in sonication time and solvent mixture, the amount of quercetin 1st increases, then decreases with optimum conditions at 60% methanol and 40 minutes (1378. 9 μg/mL), Fig. 3. It showed that 60 % methanol concentration penetrate the cell wall of cabbage efficiently and solubilize the maximum amount of quercetin. Increases in sonication time had a negative effect on the quercetin extraction because of the decomposition of quercetin to 3, 4-dihydroxyphenyl acetic acid and then 3-hydroxyphenylacatic acid as mechanism 12 shown
in Fig. 5. FIG. 4: GRAPH SHOWING THE DIFFERENT METHANOL CONCENTRATION AT DIFFERENT SONICATION TIME A
FIG. 5: EFFECT OF SONICATION TO QUERCETIN
CONCLUSION: In conclusion, quercetin can be extracted safely from solid cabbage using sonication. There is no increase in quercetin content with an increase by sonication time. Increasing sonication may affect the bioactivity of quercetin. Ultrasound-assisted extraction showed the efficient and eco-friendly way for extraction and may apply successfully to different fruits and vegetable to extract quercetin and its glucosides.
ACKNOWLEDGEMENT: This scientific work has been funded by the Prometeo Project of the National Secretariat of Higher Education, Science,
Technology and Innovation (SENESCYT),
Ecuador. The authors are also grateful to the TATA College research fund (2013-2014) for financial support.
CONFLICT OF INTEREST: Nil
REFERENCES:
1. Podsędek A: Natural antioxidants and antioxidant capacity of Brassica vegetables: A review. LWT- Food Science and Technology 2007; 40: 1-11.
2. Williams DJ, Edwards D, Hamernig I, Jian L, James AP, Johnson SK and Tapsell LC: Vegetables containing phytochemicals with potential anti-obesity properties: A review. Food Research International 2013; 52: 323-23. 3. Grażyna Z: Pressurized liquid extraction versus other
extraction techniques in micropreparative isolation of pharmacologically active isoflavones from Trifolium L. species. Talanta 2009; 79: 46-53.
4. Jang M, Asnin L, Nile SH, Keum YS, Kim HY and Park SW: Ultrasound-assisted extraction of quercetin from onion solid wastes. International Journal of Food Science and Technology 2013;48: 246-52.
5. Careri M, Corradini C, Elviri L and Mangia A: Optimization of a rapid microwave-assisted extraction method for the liquid chromatography-electrospray- tandem mass spectrometry determination of isoflavonoid aglycones in soybeans. J Chromatogr. A 2007; 1152: 274-79.
6. Suarez B, Picinelli A and Mangas JJ: Solid phase extraction and high-performance liquid chromatographic determination of polyphenols in apple musts and ciders. J Chromatogr A 1996; l727: 203-09.
7. Abid M, Jabbar S, Wu T, Hashim MM, Hu B, Lei S, Zhang X and Zeng X: Effect of ultrasound on different quality parameters of apple juice. Ultrasonics Sonochemistry 2013; 20: 1182-87.
8. Khan MK, Vian MA, Tixier SF, Dangles O and Chemat F, Ultrasound-assisted the extraction of polyphenols (flavanone glycosides) from orange (Citrus sinensis L.) peel. Food Chem 2010; 119: 851-58.
9. Mason TJ and Lorimer JP: Applied Sonochemistry. Wiley-VCH, Weeinheim, 2002.
10. Patit A and Bates D: Ultrasonic innovations in the food industry: From the laboratory to a commercial product. Innov Food Sci Emerg 2008; 9: 147-54.
11. Soria AC and Villamiel M: Effect of ultrasound on the technological properties, the bioactivity of food: a review. Trends Food Sci Techno 2010; l21: 323-31.
12. Survey NS, Upadhyaya CP, Kumar B, Ko EY and Park SW; New Genera of Flavonols and Flavonol Derivatives as Therapeutic Molecules, Journal of the Korean Society for Applied Biological Chemistry 2011: 54: 1-18.
All © 2013 are reserved by International Journal of Pharmaceutical Sciences and Research. This Journal licensed under a Creative Commons Attribution-NonCommercial-ShareAlike 3.0 Unported License. This article can be downloaded to ANDROID OS based mobile. Scan QR Code using Code/Bar Scanner from your mobile. (Scanners are available on Google Playstore)
How to cite this article: