Georgia State University Georgia State University
ScholarWorks @ Georgia State University
ScholarWorks @ Georgia State University
Public Health Theses School of Public Health
Spring 3-29-2010
Associations of Race, Age, and Socioeconomic Status among
Associations of Race, Age, and Socioeconomic Status among
Women with Prediabetes: An Examination of Nhanes Data
Women with Prediabetes: An Examination of Nhanes Data
2005-2006 Regarding Prediabetes Risk
2005-2006 Regarding Prediabetes Risk
Rose T. Kattakayam
Georgia State University
Follow this and additional works at: https://scholarworks.gsu.edu/iph_theses
Part of the Public Health Commons
Recommended Citation Recommended Citation
Kattakayam, Rose T., "Associations of Race, Age, and Socioeconomic Status among Women with Prediabetes: An Examination of Nhanes Data 2005-2006 Regarding Prediabetes Risk." Thesis, Georgia State University, 2010.
https://scholarworks.gsu.edu/iph_theses/92
ASSOCIATIONS OF RACE, AGE, AND SOCIOECONOMIC STATUS AMONG WOMEN WITH PREDIABETES:
AN EXAMINATION OF NHANES DATA 2005-2006 REGARDING PREDIABETES RISK
by
ROSE THOMAS KATTAKAYAM
BVSc, KERALA AGRICULTURAL UNIVERSITY
A Thesis Submitted to the Graduate Faculty of Georgia State University in Partial Fulfillment
of the
Requirements for the Degree MASTER OF PUBLIC HEALTH
ii
APPROVAL PAGE
ASSOCIATIONS OF RACE, AGE, AND SOCIOECONOMIC STATUS AMONG WOMEN WITH PREDIABETES: AN EXAMINATION OF NHANES DATA
2005-2006 REGARDING PREDIABETES RISK.
by
ROSE THOMAS KATTAKAYAM
Approved:
__________________________________________ Committee Chair
__________________________________________ Committee Member
__________________________________________ Committee Member
iii
DEDICATION PAGE
iv
ACKNOWLEDGEMENTS
Author’s Statement
In presenting this thesis as a partial fulfillment of the requirements for an advanced degree from Georgia State University, I agree that the Library of the University shall make it available for inspection and circulation in accordance with its regulations governing materials of this type. I agree that permission to quote from, to copy from, or to publish this thesis may be granted by the author or, in her absence, by the professor under whose direction it was written, or in his absence, by the Associate Dean, College of Health and Human Sciences. Such quoting, copying, or publishing must be solely for scholarly purposes and will not involve any potential financial gain. It is understood that any copying from or publication of this dissertation which involves potential financial gain will not be allowed without written permission of the author.
Notice to Borrowers
All theses deposited in the Georgia State University Library must be used in accordance with the stipulations described by the author in the preceding statement.
The author of this thesis is:
Rose Thomas Kattakayam 3570 Davyne Bnd,
Cumming, GA 30040
The Chair of the committee for this thesis is:
Sheryl M. Strasser PhD, MPH, MSW, CHES, CPHQ
Institute of Public Health, College of Health and Human Sciences
Georgia State University P.O. Box 3995 Atlanta, Georgia 30302-3995
Users of this thesis who are not regularly enrolled as student of Georgia State University are required to attest acceptance of the preceding stipulation by signing below. Libraries borrowing this thesis for the use of their patrons are required to see that each user records here the information requested.
NAME OF USER ADDRESS DATE TYPE OF USE (EXAMINATION
CURRICULUM VITAE
Rose Thomas Kattakayam
3570 Davyne Bnd Cumming, GA 30040 770-781-8899 (H) 404-232-5469 (C) [email protected]
EDUCATION
Master of Public Health, August 2008 – Present Georgia State University, Atlanta, GA
Bachelor of Veterinary Science & Animal Husbandry, June 2004 Kerala Agricultural University, Mannuthy, India
EXPERIENCE
Centers for Disease Control and Prevention, Atlanta, GA Epidemiology Assistant, July 2009 – Present NCHHSTP, Division of Tuberculosis Elimination
- Data entry, data management and quality assurance for clinical trial studies.
- Analysis of data for clinical trial studies such as foreign-born TB transmission, comparison of treatment regimens and adverse events, and latent tuberculosis clinical trials.
Georgia State University, Atlanta, GA
Graduate Research Assistant, January 2009 – Present GSU College of Health & Human Sciences, Institute of Public Health - Assisting the professor in evaluating and reporting for projects such as
the Prevention of Under-aged Drinking Coalition in Georgia and South Atlanta for the Environment (SAFE).
- Assisting the professor in various duties such as preparing surveys electronically for research studies and various duties as per professors’ research interest.
Kerala Agricultural University, Mannuthy, India
Student Internship Trainee, December 2003 – June 2004 - Shadowed Veterinarians and assisted them in large and small animal
practice, administered vaccines and medicines, monitored patients and assisted in surgeries.
- Worked in different farms under the supervision of the farm
TITLE OF THESIS:
ASSOCIATIONS OF RACE, AGE, AND SOCIOECONOMIC STATUS AMONG WOMEN WITH PREDIABETES: AN EXAMINATION OF NHANES DATA 2005-2006 REGARDING PREDIABETES RISK
STUDENT’S NAME:
Rose Thomas Kattakayam, BVSc
THESIS CHAIR:
Sheryl M. Strasser, PhD, MPH, MSW, CHES, CPH
ABSTRACT
Background: Prediabetes (PD) defined as having glucose values above normal but not high enough to be diagnosed as diabetes, is known to be a risk factor for type 2 diabetes and associated complications. Early prevention efforts can reverse the condition or delay the development of type 2 diabetes. This study examines the sociodemographic risk factors for PD in women.
Methods: Using secondary data from National Health and Nutrition Examination Survey NHANES 2005-2006, chi-square analysis was done to find the prevalence of the disease among different categories of women with respect to age, ethnicity, and socioeconomic status. Univariate and multivariate analyses were performed to determine the associations of the sociodemographic factors with PD among women. A p-value of <0 .05 and 95% confidence intervals were used to determine statistical significance throughout all the analyses performed.
Results: In total, 3,461 cases were included in the study analysis. Cases with indications of PD were found in 716 (20.7%) of the sample. Increased age was consistently
associated with PD in women [χ=392.3(3), p<.001]. Prevalence of PD peaked for those aged 60 and above. Results of multivariate analysis suggested that being non-Hispanic Blacks was associated with increased likelihood of PD. Education was found to be significantly associated with PD but an inverse relationship could not be established.
Table of Contents
APPROVAL PAGE ... ii
DEDICATION PAGE ... iii
ACKNOWLEDGEMENTS ... iv
INTRODUCTION... 1
1a. Background... 1
1b. Purpose of Study ... 2
1c. Research Questions ... 3
REVIEW OF THE LITERATURE ... 5
2a. Biology ... 5
2b. PD in women ... 6
2c. Risk Factors ... 7
a. Age ... 7
b. Ethnicity... 8
c. Socioeconomic Status (SES) ... 9
e. Income ... 11
2d. Summary ... 12
2e. Theoretical basis of the study ... 12
METHODOLOGY ... 14
3a. Data Sources and Study Population ... 14
3b. Study Measures ... 15
3c. Statistical Analysis ... 16
RESULTS ... 18
4a. Sample Demographics ... 18
4b. PD and Sociodemographic association ... 20
DISCUSSION AND CONCLUSION ... 26
5a. Discussion... 26
5b. Limitations of the Study ... 29
5c. Recommendations ... 29
LIST OF TABLES
Table 1. Demographic Profile of Female NHANES 2005-2006 Sample……….19
Table 2. Mean Values and Standard Deviations of Continuous Study Variables………20
Table 3. Percentages of Self-reported PD, IFG, IGT, A1C levels and Total PD………..20
Table 4.PD Prevalence by Demographic Variables………...21
Table 5.PD Prevalence Distribution by SES (n=3461)……….22
Table 6. Univariate Analysis of Sociodemographic Factors and PD Results…………....23
1
CHAPTER I
INTRODUCTION
1a. Background
Diabetes is a group of diseases in which high levels of glucose are present in the
blood due to defects in insulin production, action or both (CDC, 2007; ADA, 2008).
There are three different types of diabetes- Type 1, Type 2 and Gestational Diabetes
Mellitus (GDM). The disease and its complications are the major causes of morbidity,
mortality, reduced quality of life (CDC, 2007) and economic loss in the U.S (Hogan,
Dall, & Nikolov, 2003). The recent trends show that over the next 50 years the number of
Americans with diagnosed diabetes will increase (Boyle et al., 2001). Another condition
known as prediabetes (PD) has also been recognized and is defined as a state that occurs
when a person's blood glucose levels are higher than normal but not high enough for a
diagnosis of diabetes. In 2007, an estimated 57 million people aged 20 years and older
had PD in the U.S (National Institute of Health (NIH), 2008).
There are concerns about people having prediabetic conditions, as an increased
risk of type 2 diabetes is associated with those diagnosed with PD (Tuomilehto et al.,
2001). A study by de Vegt et al in a Dutch population found that the risk of development
of type 2 diabetes was more than 10 times in those who had PD (2001). PD can
eventually progress to developing cardiovascular diseases (Coutinho, Wang, Gerstein,
Hertzel & Yusuf, 1999; Meigs, Nathan, D'Agostino, & Wilson, 2002). The complications
2
The public health burden of the disease is enormous in terms of the health care
expenditure. Even the lowest prediabetic levels have been found to be associated with
increased medical costs (Nichols & Brown, 2005). In a study by Zhang and colleagues,
medical claims data to estimate per capita excess health care use was combined with
national estimates of health care use and medical costs to calculate national expenditures
associated with PD. The results of the study were extrapolated to suggest that national
annual medical costs of PD exceed 25 billion dollars or an additional $443 dollars for
each adult with PD (2009).
The diagnosis of PD or borderline diabetes is important as scientific evidence
suggests that the progression to type 2 diabetes and its associated complications can be
delayed or reversed. Lifestyle changes can prevent or delay development of type 2
diabetes among persons with PD irrespective of their age, race and sex (Diabetes
Prevention Program Research Group, 2002).
1b. Purpose of Study
Blood glucose levels that are not within a diagnosable level of diabetes do not
indicate that a person is free from diabetes-complications or risks. There are no studies
that were conducted to find the prevalence of PD in various subgroups of women. The
purpose of this study is to examine the of associations of age, race and socioeconomic
status among a female NHANES sample, whose blood glucose levels are elevated but not
high enough to be diagnosed as diabetes. This study will examine reported borderline
diabetes as well as laboratory variables such as fasting plasma glucose levels, glucose
tolerance levels or glycalated hemoglobin percentages in women to determine whether
3
Using NHANES 2005-2006 data, the prevalence rates of borderline diabetes among
women by race, age, and SES variables such as income, poverty income ratio (PIR) and
education were examined. This study is important because PD is an early warning sign
for development of type 2 diabetes and associated complications. The results of this study
will help shed light on how widespread PD is among diverse groups of women —and
subsequently, findings can help inform directions for future preventive efforts.
1c. Research Questions
Question #1: What percentage of female NHANES 2005-2006 sample has PD?
Null Hypothesis #1: The prevalence of self-reported PD in a female NHANES 2005-2006
sample is not different from actual prevalence of PD.
Alternate Hypothesis #1: The prevalence of self-reported PD in a female NHANES
2005-2006 sample is different from actual prevalence of PD.
Question #2: How does PD in a female NHANES 2005 - 2006 sample differ by age?
Null Hypothesis #2: PD in women is not associated with age in NHANES 2005-2006
sample.
Alternate Hypothesis #2: PD in women is associated with age in NHANES 2005-2006
sample.
Question #3: How is PD in a female NHANES 2005-2006 sample different by ethnicity?
Null Hypothesis #3: PD in women is not associated with ethnicity in NHANES
2005-2006 sample.
Alternate Hypothesis #3: PD in women is associated with ethnicity in NHANES
2005-2006 sample.
4
Null Hypothesis #4: PD in women is not associated with education in NHANES
2005-2006 sample.
Alternate Hypothesis #4: PD in women is associated with education in NHANES
2005-2006 sample.
Question #5: How is PD in a female NHANES 2005-2006 sample different by family
income levels?
Null Hypothesis #5: PD in women is not associated with family income in NHANES
2005-2006 sample.
Alternate Hypothesis #5: PD in women is associated with family income in NHANES
2005-2006 sample.
Question #6: How is PD in a female NHANES 2005 2006 sample different by Poverty
income ratio (PIR)?
Null Hypothesis #6: PD in women is not associated with PIR in NHANES 2005-2006
sample.
Alternate Hypothesis #6: PD in women is associated with PIR in NHANES 2005-2006
5
CHAPTER II
REVIEW OF THE LITERATURE
The literature review examined risk factors for PD as well as complications of
having prediabetic glucose levels in females. The following chapter is dedicated to
presenting scientific literature that supports inclusion of the variables of interest in this
study. Since there are very limited studies on PD, risk factors for diabetes were
examined as they align naturally with the risk factors for PD.
2a. Biology
Typically, PD does not have any physical symptoms aside from darkening of the
skin in some areas of the body, such as neck, elbows, armpits, knees and knuckles
(MayoClinic.com, n.d.). In some people, symptoms of diabetes such as increased thirst,
frequent urination, fatigue and blurred vision may be present. PD can be diagnosed with
Impaired Fasting Glucose (IFG) or Impaired Glucose Tolerance (IGT) or both (American
Diabetes Association (ADA), 2008). An FPG level of 100-125 mg/dl or OGT levels of
140-200 mg/dl (NIH, 2008) is classified as PD. The A1C test which measures the
glycalated hemoglobin is yet another recommendation to determine the glucose levels in
the blood (ADA, 2009). An A1C of 5.7 – 6.4 percent indicates that blood glucose levels
are in the prediabetic levels.
The IFG and the OGT measure two different phenomena physiologically (Nathan
6
recommended by the ADA. The IGT is more sensitive and can detect defects in glucose
levels in the aged (Wahl et al., 1998). The addition of a 2 hour OGTT will add an
additional 2% to the original prevalence of diagnosed diabetes using IFG (Cowie et al.,
2009).
The studies measuring the total IFG also referred to as the Impaired Plasma
Glucose (IPG) and the OGT are very few. Cowie et al. compared the prevalence rates of
IFG and IGT for the years 1988-1994 and 2005-2006 using NHANES data. The
researchers found that just above 25% of the population had IFG. The prevalence of IGT
was about half that of IFG. The total PD was calculated using IFG or IGT levels and
estimated to be about 30% in the study (2008). The prevalence of self-reported PD was
found to be 4% using the data from the National Health and Nutrition Examination
Survey (NHANES) 2005-2006 (Rolka, Burrows, Li & Geiss, 2008).
2b. PD in women
Different studies have found that prevalence of PD in women to be contradictory.
In one study using the data from the National Health Interview Survey, self-reported PD
was found to be more prevalent in women (4.8%) than men (3.2%)(Rolka, Burrows, Li
& Geiss, 2008). In contrast to this, Cowie et al. found that the crude prevalence of total
PD using 2005-2006 data was much greater in men than in women (2008). According to
this study, the IFG was found to be higher in men than women while when the IGT levels
were compared, no differences between the two genders were observed.
PD and pregnancy studies go back to the late 1950s. In a study by Barnes, the
7
baby have been described (1961). This finding is again strengthened by the study that
found an association between fetal outcomes such as perinatal mortality, still birth and
PD in mothers (Wood, Sauve, Ross, Brant, & Love, 2000). Children of prediabetic
mothers have an eight fold increased risk of PD or diabetes at 19-27 years of age (Damm,
2009). Pregnant women need not reach a diagnostic threshold for gestational diabetes to
be at risk for diabetes or prediabetes (Retnakaran, 2008).
2c. Risk Factors
a. Age
One of the risk factors for PD and type 2 diabetes is the age of a person. Women
with diabetes were more likely than women without diabetes to be aged 45 years or
above (Beckles & Thompson-Reid, 2002). In a study conducted by Rolka and colleagues,
it was found that the prevalence of self-reported PD increased with age (2008). The
prevalence was found to be 2.7% and 6% in ages 18 to 44 years and above 60 years
respectively. 25.9 % who had IGT were 20 and above while 35.4 % were 60 years and
older.
In a study by Cowie et al. the variation of the prevalence of IFG, IGT and PD
according to age was observed (2008). The results of the study indicated that in
individuals over 20 years, the IFG prevalence was 25.7% and it increased with age
doubling between 20-39 and 40-59 years of age. After 60 years of age, the IFG levels
remained constant with age. About half the prevalence was found in ages 20 years and
above for IGT levels and the prevalence increased with age and peaked at 75 years of age
with 35.1% prevalence. The total PD estimated by either IFG or IGT was around 30% in
8
b. Ethnicity
There are certain population subgroups that are at more risk to develop PD as well
as type 2 diabetes. It is not clear why there are racial differences in PD or diabetes
prevalence, but behavioral, environmental, socioeconomic, genetic, physiologic risk
factors are postulated (Abate & Chandalia, 2003). Some findings indicate that certain
race may be at higher risk for type 2 diabetes, regardless of socioeconomic status (SES).
Racial or ethnic disparities in diabetes have been increasing in normal and overweight
individuals belonging to minority populations (Zhang, Wang, & Huang, 2009).
African-Americans, Hispanics, Native African-Americans, Asian African-Americans, and Pacific Islanders are at
higher risk for type 2 diabetes than Whites (ADA, 2004). The same groups may also
develop PD long before they have diabetic glucose levels in the blood and hence
screening at an earlier stage in such groups is recommended by the ADA. This is in turn
reinforced by a study based on the Behavioral Risk Factor Surveillance System (BRFSS)
(Beckles & Thompson-Reid, 2002). It has also been postulated that African-American
children are found to have a higher disease risk than White children (Lindquist, Gower, &
Goran, 2000).
Persons from minority ethnic groups suffer disproportionately from type 2
diabetes and its long-term complications when compared to Caucasians even though
African-American women are more likely to report diabetes than White women
(Signorello et al., 2007). A study by Annis et al. found that non-Hispanic Blacks had
higher prevalence rates than non-Hispanic Whites or Mexican Americans (Annis,
Caulder, Cook, & Duquette, 2005). The prevalence of diabetes in Whites was higher
9
changes in the African-American population may have contributed to the higher rates of
prevalence of the disease in the present century.
A higher prevalence of total PD in Mexican Americans than in non-Hispanic
Whites or non-Hispanic Blacks was reported by Cowie et al., but it was not significantly
different (2008). Although the changes over time in the level of IFG, IGT and PD for the
years 1988-2002 and 2005-2006 was compared in this study, no significant changes with
ethnicity were observed. When the hemoglobin A1C (HbA1C) levels in diagnosed and
undiagnosed diabetes in Whites, Blacks and Hispanics were compared it was found that
there were differences between different racial groups (Boltri, Okosun, Davis-Smith, &
Vogel, 2005). A study in Mexican Americans using the NHANES 1999-2002 suggested
that they are less likely to be aware and to be treated for their diabetic condition than
non-Hispanic Whites (Hertz, Unger, & Ferrario, 2006).
c. Socioeconomic Status (SES)
There are no studies done to find associations of PD with SES of a population.
Since PD is the precursor of type 2 diabetes, it has been assumed that the same SES
factors that affect the prevalence rate of type 2 diabetes will also influence the rates in
persons with PD. The prevalence of diabetes varies with SES in a population and can be
measured using different variables; the most common ones that are used are education,
income and occupation (Abate & Chandalia, 2003; Beckles & Thompson-Reid, 2002).
People with low SES have poorer health than other persons (Adler & Ostrove, 1999).
SES variables are known risk factors for diabetes mellitus as disadvantaged
circumstances may lead to unhealthy behaviors, inadequate access to health care,
10
Normal glucose levels in humans can be impaired by psychological stress (Wing,
Epstein, Blair, & Nowalk, 1985).
SES may also affect diabetes by its influence on prenatal and perinatal factors.
Barker and colleagues conducted studies based on animal and epidemiological research
to suggest that problems such as diabetes in a person are related to the poor nutritional
status of the mother (1994). But there are also questions about the methodology of this
study that makes the theory controversial (Joseph and Kramer, 1996). The research done
by Beckles & Thompson using the BRFSS data found that the SES of women with
diabetes was found to be lower compared to the SES of women without diabetes (2002).
SES may be a strong confounder of diabetes in women than men (Signorello et al., 2007).
So it is necessary that research attention should focus on the impact of SES in relation to
women with diabetes.
There are various factors such as sex and race that influence the association of
SES and diabetes. These factors were studied by Robbins et al. by examining different
SES variables within different strata of sex and race (2001). It was found that these
variables varied with gender and ethnicity of a person. The results of the study strongly
suggested that SES has a strong inverse association with diabetes in African-American
women and White women but not in men of both ethnicities. A community health survey
in Boston found that SES determined by a combination of education and income has a
stronger association with the prevalence of diabetes than race or ethnicity (Link &
11
d. Education
A low level of formal education remained significantly more common among
women with diabetes than among those without diabetes (Beckles & Thompson-Reid,
2002). Years of education was found to be strongly associated with diabetes prevalence
among White women, but was not found to be a significant predictor of diabetes
prevalence among African-American women (Robbins, Vaccarino, Zhang & Kasl, 2001).
These researchers found that with an education of more than 12 years, there was an
inverse association with the diabetes prevalence. A 2005 study by Annis and colleagues
also suggested a similar finding. Signorello and colleagues also showed that the
prevalence of diabetes had an inverse association with educational level in women and
that the prevalence was 1.6 times higher in those with less than 9 years of education
compared to those who had graduated from college (2007). But a contradictory finding
was that education level as a SES factor may be misleading in women and retired
population (Robbins, Vaccarino, Zhang, & Kasl, 2001).
e. Income
Income, particularly modeled as PIR, may be a more sensitive indicator of current
SES level of an adult. Income is used as a direct measurement of economic wealth as
well as major determinant of social prestige in the United States (Liberatos, Link, &
Kelsey, 1988). The PIR ratio is based on family size and is the ratio of family income
with the family’s poverty threshold level (Fryar, Merino, Hirsch, & Porter, 2009). With
higher percentages of PIR, the prevalence rates of diabetes decreased as suggested by
12
for ages 65 and above, low income African-Americans were more at risk for poor
nutrition and chronic health conditions than Caucasians (Bowman, 2009).
Women with an annual household income of less than $25,000 are twice likely to
have diabetes than women who have an annual household income of above $25,000
(Beckles & Thompson-Reid, 2002). Similar results were found in a study by Signorello
showing that people with lower income levels had higher prevalence rates of diabetes
than higher income levels (2007). However, this study did not found variations in the
income-diabetes association when stratified according to gender and race.
2d. Summary
Most studies have shown how diabetes has been linked to different risk factors
such as age, ethnicity/race and socioeconomic factors such as income level, PIR and
education in women. There are not many studies that linked PD to these risk factors. The
same risk factors for diabetes might also have an influence on the prevalence rates of PD
in females. Belonging to a certain age, race or SES level might increase the risk for PD.
Research has shown that SES variables such as education and income are negatively
associated with the prevalence of diabetes.
2e. Theoretical basis of the study
Examination of diabetes risk in women is important for multiple reasons. Using
the Life Course Perspective as the theoretical foundation provides rationale for the
development of the research questions of this study. This theory considers chronic
disease in terms of biological, behavioral, and psychosocial factors that operate across all
stages of lifespan to cause or modify disease risk (Aboderin et al., 2002). The Life Course
13
affects individuals from pre-conception through death. Therefore, women from
disadvantaged backgrounds have a greater risk for the development of PD and gradually
type 2 diabetes and its complications such as adverse birth outcomes, cardiovascular
diseases, increased morbidity, and premature mortality.
14
Chapter III
METHODOLOGY
3a. Data Sources and Study Population
The data for this study came from NHANES 2005-2006. The National Center for
Health Statistics conducts the NHANES annually (CDC, 2009). The information gathered
from NHANES is meant for health-related research purposes. The NHANES data is a
population based survey of the civilian, non-institutionalized U.S population in which
participants are interviewed at their homes and then a subset participated in the laboratory
examination component (Cowie et al., 2009). This is the only national survey that
captures information about diabetes and PD from an interview as well as laboratory
measures such as FPG, IGT and glycalated hemoglobin level. An informed consent is
obtained from each participant for the interview as well as the laboratory examination
(CDC, 2009). For this study, data from NHANES 2005-2006 questionnaire, demographic
and laboratory files were used.
Self-reported PD status was determined on the basis of how a person answered
question number 160 in the questionnaire. The question asked was whether an individual
was ever told by a doctor or professional that she had PD, IFG, IGT, borderline diabetes
or was told that blood sugar was higher than normal but not high enough to be
diagnosed as diabetes. Pregnant women were not excluded from the survey. The
prevalence rates of self-reported as well as laboratory diagnosed PD (IFG or IGT or A1C)
in women 12 years and above were determined in this study. A woman was determined to
15
The 2005 -2006 NHANES laboratory data contains measures such as the OGTT
and A1C levels of participants in addition to the fasting blood glucose levels. This helped
in assessing the agreement between self-reported and laboratory diagnosed PD using FPG
levels. Standard diagnostic criteria were used to determine whether an individual had PD
based on IFG, IGT or A1C values. If a person had IFG between 100-125 mg/dl or IGT
between 140-199mg/dl or A1C levels between 5.7-6.4% then they were classified as
having PD. These laboratory values were as per the recommendations of the American
Diabetes Association (2008).If any of these values were above the standard for PD
classification, then such cases were excluded from the analysis. The values below these
standards were classified as normal.
3b. Study Measures
The study measures that were considered in the study were obtained from the
demographic file. These included age, ethnicity, education, family income and poverty
income ratio. Any participant who did not have complete information on the
demographic characters was eliminated from the study.
Age:
Age was reported as a whole number in years at the time of screening. Age was
then classified based on the 2000 Census bureau (CDC, 2002) into four different
categories of 12–19 years, 20–39 years, 40-65years and above 65years.
Ethnicity:
Ethnicity was categorized in to the following groups: Hispanic, non Hispanic Whites,
16
are not discussed as there is a wide variation within this group and it cannot be
meaningfully interpreted.
SES:
SES was assessed by education, family income and poverty income ratio (PIR).
Educational level was self-reported and was categorized into 4 groups: Less than high
school, High School Graduate /GED equivalent, Some College, College Grad or more.
Family income was classified into four groups, <$20,000, $20,000-44999,
$45,000-74999, and >$75,000. The family income and family size was used to calculate the PIR
of participants. In this study the PIR was divided into three categories <1.00, 1.00-1.85
and >1.86. This was based on the standards recommended by the US Census Bureau
(CDC, 2002).
3c. Statistical Analysis
The Statistical Package for the Social Sciences (SPSS) R version 17.0 was used to
truncate, organize and analyze the data in NHANES 2005-2006 to make it suitable for the
study. To achieve sufficient subpopulation representation, NHANES oversampled certain
populations (CDC, 2002). To account for any unequal probabilities of selection, over
sampling and non-response, appropriate sample weights were utilized for the prevalence
estimates. Frequency tables were produced to determine the representation of categorical
variables such as age, ethnicity, education, income and PIR of the participants.
Frequency tables of self-reported PD as well as IFG, OGT and A1C were also produced.
The differences between the mean ages of prediabetic and normal women were
determined by an independent t-test for equality of means. The prevalence estimates of
17
performed using the Pearson chi-square test. Univariate and multivariate logistic
regression analyses were performed to estimate the factors that were associated with PD.
PD (coded as 0 for normal and 1 for PD) was the dependent variable in the models. The
independent variables were age, ethnicity, education, family income and PIR.
Throughout all the analysis performed, a p value of 0.05 and confidence interval of 95%
18
Chapter IV
RESULTS
The answers to the research questions are presented in detail in this chapter.
4a. Sample Demographics
The total sample of NHANES respondents that met the study eligibility criteria
was 3461 out of which 716 women were found to be prediabetic. The demographic
characteristics of the respondents who were included in the study with respect to age,
ethnicity, education, income and PIR are presented in Table 1. About 63.9% of the
sample was between the ages of 12 and 39. Forty-two percent of the participants
identified themselves as non-Hispanic Whites, while both Hispanic and non-Hispanic
Blacks each represented about a quarter of the sample, 27.6% and 25.3% respectively
Nearly two-thirds of the sample reported having an high school education or less
(62.9%). Over half the respondents earned less than$45,000. Majority of the respondents
were classified in the upper tertile of the PIR (greater than 1.86%). The mean age of
women who had prediabetes was statistically significantly higher than those who had
normal blood glucose levels while the PIR means between the two groups were not
19
Table 1.Demographic Profile of Female NHANES 2005-2006 Sample (n=3461)
Variables N %
Age
12-19 years 1148 33.2
20-39 years 1064 30.7
40-59 years 669 19.3
>60years 580 16.8
Ethnicity
Hispanic 954 27.6
Non-Hispanic Whites 1454 42 Non-Hispanic Blacks 877 25.3
Other 176 5.1
Education
<High School 1516 43.8 High School Grad/GED 661 19.1
Some College 787 22.7
College Grad or more 493 14.2
Income
<20,000 861 24.9
$20,000-44,999 1064 30.7
$45000-74,999 708 20.5
>75,000 725 20.9
PIR
<1 724 20.9
1-1.85 715 20.7
20
Table 2.Mean Values and Standard Deviations of Continuous Study Variables
Variables Prediabetic Normal p value
Mean SD Mean SD
Age 49.02 21.4 31.8 19.23 <0.001
PIR 2.38 0.8 2.33 0.82 0.209
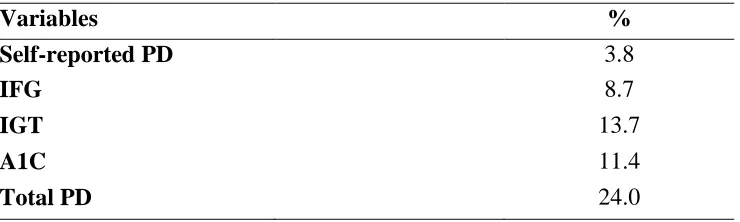
The prevalence of self–reported PD and different categories of laboratory-diagnosed PD
is presented in Table 3. The overall estimated prevalence of PD among the participants
was 24%. Only 3.8% of the participants reported that a doctor or professional told them
that they had PD. IGT prevalence was found to be greater than that of IFG and
prediabetic A1C prevalence rates. Among the three laboratory measures, the number of
people diagnosed with prediabetes was highest using IGT (13.7%).
Table 3.Percentages of Self-reported PD, IFG, IGT, A1C levels and Total PD (n=3461)
Variables %
Self-reported PD 3.8
IFG 8.7
IGT 13.7
A1C 11.4
Total PD 24.0
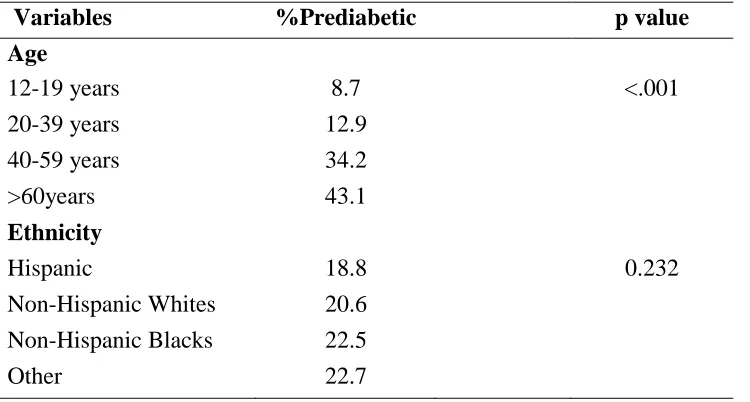
4b. PD and Sociodemographic association
The prevalence of PD significantly increased with age at screening (χ2
(3) =
392.3, p<0.001). Women who were 60 years and older experienced the highest
prevalence (43.10%) followed by those with ages 40-59 years (34.20%). PD rates by
ethnicity showed that the prevalence was nearly equal among Hispanics (18.8%),
[image:31.612.119.489.414.525.2]21
differences were not significant as indicated by the chi square analysis (χ2 (3) = 4.29,
[image:32.612.115.490.174.375.2]p=0.232). Complete results are shown in Table 4.
Table 4. PD Prevalence by Demographic Variables (n=3461)
Variables %Prediabetic p value
Age
12-19 years 8.7 <.001
20-39 years 12.9 40-59 years 34.2 >60years 43.1
Ethnicity
Hispanic 18.8 0.232
Non-Hispanic Whites 20.6 Non-Hispanic Blacks 22.5
Other 22.7
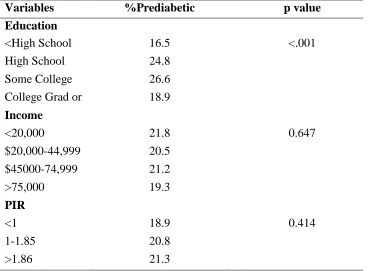
Table 5 displays the frequencies and percentages of women who had PD according to
different categories of education, family income and PIR. For the first three categories of
education, the prevalence of PD increased significantly (χ2 (3) = 40.61, p<0.001) and then
decreased for women who were graduates or had a higher degree. The prevalence of PD
among the different categories of income did not vary much (χ2 (2) = 1.66, p=0.647). The
prevalence of PD increased slightly with increasing tertiles of PIR but was not found to
22
Table 5.PD Prevalence Distribution by SES (n=3461)
Variables %Prediabetic p value
Education
<High School 16.5 <.001 High School
Grad/GED
24.8 Some College 26.6 College Grad or
more
18.9
Income
<20,000 21.8 0.647
$20,000-44,999 20.5 $45000-74,999 21.2 >75,000 19.3
PIR
<1 18.9 0.414
1-1.85 20.8
>1.86 21.3
The results of univariate analysis of the association between each of the examined
independent variables and PD are shown in Table 6. The magnitude of association
between the independent variables and outcome variable are quantified using the odds
ratio from the logistic regression models. As shown, an increase in age and level of
education was associated with increased odds of having PD among women. Ethnicity,
family income and PIR were not statistically significantly associated with occurrence of
prediabetes among women.
To determine whether the associations in the univariate model were not dependent
of other covariates, multivariate logistic regression was performed with different
categories of independent variables. PIR was eliminated from multivariate analysis
23
Table 6. Results of Univariate Analysis of Sociodemographic Factors Associated with PD (n=3461)
Variables OR 95% CI p value
Age
12 - 19 years (Referent)
20 - 39 years 1.55 1.18 - 2.03 0.002 40 -59 years 5.45 4.21 - 7.07 <.001 >60years 7.94 6.10 - 10.33 <.001
Ethnicity
Non-Hispanic Whites
(Referent) (Referent)
Hispanic 0.89 0.72 - 1.09 0.261 Non-Hispanic Blacks 1.11 0.91 - 1.37 0.296 Other multiracial 1.11 0.78 - 1.65 0.519
Education
College Grad or more
(Referent) Some College
High School Grad/GED
1.56 1.18 - 2.05 0.002 High School Grad/GED 1.42 1.07 - 1.89 0.017 <High School 0.85 0.65 - 1.11 0.224
Income
>75,000 (Referent)
$45,000-74,999 0.86 0.67 - 1.10 0.216 $20000-44,999 0.96 0.76 - 1.23 0.756 <20,000 0.92 0.74 - 1.15 0.472
PIR
>1.86 (Referent)
1 - 1.85 1.13 0.87 - 1.46 0.363 <1 1.16 0.93 - 1.44 0.187
As illustrated in Table 7, except for family income, all other independent
variables were found to be statistically significantly associated with occurrence of
prediabetes among women while adjusting for the other 3 variables. Some of the factors
24
Black. It was found that having higher levels of education were associated with higher
likelihood of PD adjusting for age, ethnicity and family income.
Table 7. Results of Multivariate Logistic Model for sociodemographic factors associated
with PD (n=3357)
Variables OR 95% CI p value
Age
12 - 19 years (Referent)
20 - 39 years 1.75 1.29 - 2.38 <.001 40 - 59 years 6.65 4.91 - 8.99 <.001 > 60 years 10.80 7.97 - 14.64 <.001
Ethnicity
Non-Hispanic Whites
(Referent) (Referent)
Hispanic 1.69 1.32 - 2.17 <.001 Non-Hispanic Blacks 1.76 1.39 - 2.22 <.001 Other multiracial 1.85 1.22 - 2.81 0.004
Education
College Grad or more
(Referent) Some College
High School Grad/GED
1.85 1.37 - 2.50 <.001 High School Grad/GED 1.63 1.18 - 2.24 0.003 <High School 1.57 1.13 - 2.19 0.008
Income
>75,000 (Referent)
25
Chapter V
DISCUSSION AND CONCLUSION
5a. Discussion
Early interventions are necessary to prevent the occurrence of diabetes in women
by recognizing the risk factors associated with the condition. Early life style changes
have been proved to be effective to prevent diabetes development among those who have
PD (Diabetes Prevention Program Research Group, 2002). There are studies that have
looked at the occurrence of diabetes and sociodemographic factors, but few of them have
looked at the association of these risk factors and PD in women. This is particularly
important as interventions in women will not only prevent occurrence of type 2 diabetes
in the individuals, but may also have an impact on the risk of development of the
condition in the offspring.
The study objective was to find the risk factors that are associated with PD
occurrence in women using the NHANES 2005-2006 data. NHANES is unique because it
represents the US non-institutionalized population. This study also uses self-reported as
well as laboratory measures (IFG, IGT and A1C) to determine the prediabetic condition
of a woman. NHANES data from 2005-2006 is particularly the best for this study as this
was the first year when the glucose tolerance and glycohemoglobin measures were
included in the laboratory examination in addition to the fasting glucose measures of the
previous years.
26
women in NHANES 2005-2006 sample. The prevalence of self-reported PD was 1.8%
less than the total prevalence of PD in a study by Rolka and colleagues (2008). The
finding that 24% of the NHANES female participants being identified as prediabetic fell
within the range of prevalence rates published by other researchers. For example, the
study by Cowie et al found that the prevalence of prediabetes as 29.5% (2009). However
this was also based on both genders. In 1988 -1994, the CDC reports that total prevalence
of PD (IFG, IGT or both) is 40.1% in the U.S (2008). The unique feature of this study is
that in addition to FPG and IGT measures, A1C measures were used as an indicator of
PD. Among the measures of PD: self-report, IFG, and IGT and HbA1C—the prevalence
of prediabetic cases were highest when IGT was used for determining whether a
participant is prediabetic or not. This result is inconsistent with the finding that the
prevalence of IFG is higher than IGT (Cowie et al., 2009).
Age consistently emerged as a variable which was strongly associated with PD in
women. As age increased, the association also increased. In analyzing the impact of age
on the prevalence of PD, the difference in the mean of ages of the prediabetic group was
found to be statistically higher than the mean age of the normal group. The peak in
prevalence of PD in this study was found to be at age 65 and above. Previous research
supports this assertion by reporting the peak prevalence for the condition at age 75 and
above (Cowie et al, 2009). The study results reinforce early screening in a woman and
education about diet and exercise if one is diagnosed with PD in order to reverse or delay
development of type 2 diabetes. Early intervention in women of child bearing age
diagnosed with PD will also help to prevent negative outcomes in the offspring.
27
non-Hispanic Whites in the study which is consistent with the report of MMWR in 2003.
However, being Hispanic was found to be protective factor in univariate analysis which
was contradictory to the results of multivariate analysis in which being Hispanic was
found to increase the likelihood of PD, than being a non-Hispanic White. This can be
explained by the discrepancies in the data that matched the type of analysis that was
done. The ―other racial‖ group was found to have higher chances than any other ethnic
group in multivariate analysis. Since this group could not be clearly defined it was
eliminated from the discussion.
Researchers have found that SES is associated with type 2 diabetes in women but
not consistently in men (Robbins, Vaccarino, Zhang & Kasl, 2001). Education levels
were acknowledged in the literature to be inversely associated with diabetes outcome in
White women and not significantly associated in African American women in an
NHANES III study (MMWR, 2003). Conversely, in this study it was found that
education was significantly but not inversely associated with PD. As the levels of
education decreased, it was found that women had lesser likelihood of being prediabetic.
However, the interaction of education and PD for different ethnicities was not analyzed.
Results from the logistic regression analyses showed that income and PIR were
not significant predictors of PD in women. This result is inconsistent with the findings by
other researchers which found that PIR was strongly and inversely associated with
diabetes in women (Robbins, Vaccarino, Zhang & Kasl, 2001). One of the reasons for
this might be that poor health may affect the income of the individual and not the reverse
28
income in this study which are not consistent with findings that income was a good
indicator of SES than education (Liberatos, Link & Kelsey, 1988).
5b. Limitations of the Study
One limitation of the study is the use of secondary data. Even though, NHANES
is a robust and well sampled data set, it provided only few ways of looking at the
relationship between demographic characters, SES and PD. A chance of self-report bias
is present as variables such as age, education and family income are self-reported in
NHANES. Misclassification bias might have occurred when participants were classified
into different categories. Also NHANES excluded institutionalized patients who are
likely to be older adults. There might be additional variables such as occupation type that
would be useful to find the association between SES of women and PD.
5c. Recommendations
Future research that focuses on additional PD risk factors is warranted. Future
studies that examine family history of diabetes, obesity, chronic conditions such as blood
pressure, use of alcohol and tobacco, access to healthcare which can be potential
mediators between sociodemographic characteristics and their association with PD are
recommended. It is also important to examine how PD among women and men differ.
Studies classifying SES variables by ethnicity might also be able to shed light on how PD
varies in different categories of ethnicity among women. The association of type of
occupation of women with PD would be helpful in finding which SES variables are
strongly related to PD in women. A study on how sociodemographic factors and their
29
5d. Conclusion
This study is important because it determines the burden of PD among a national
sample of females in the US. Women have unique risks that may vary on the basis of age,
ethnicity and education. The results of this study help provide useful insights to public
health professionals who are developing upstream health promotion approaches in their
attempt to address PD before it advances into diabetes disease. The findings of this study
have several implications for health of women. The prevalence of PD is higher than the
reported prevalence of PD in the US. PD and diabetes are known to complicate
pregnancy and cause adverse affects in the prenatal and perinatal life of the offspring.
Interventions for prediabetic women of child bearing age (20-39years) might decrease the
chance of having PD and also the subsequent development of type 2 diabetes in the
mother as well as the offspring. Early screening for PD and lifestyle modifications
30
REFERENCES
Abate, N., & Chandalia, M. (2003). The impact of ethnicity on type 2 diabetes. Journal of
Diabetes and Its Complications, 17(1), 39-58.
Aboderin, I., Ben-Shlomo, Y., Lynch, J. W., Yajnik, C. S., Kuh, D., & Yach, D. (2002). Life course perspectives on coronary heart disease, stroke and diabetes; The evidence and implications for policy and research. World Health Organization.
ADA. (2004). Screening for Type 2 diabetes. Diabetes Care, 27(1), 11-14.
ADA. (2008). Diagnosis and Classification of Diabetes Mellitus. Diabetes Care, 31(1), S55-S60.
ADA. (2009). American Diabetes Association’s New Clinical Practice Recommendations
Promote A1C as Diagnostic Test for Diabetes. Retrieved from
http://www.diabetes.org/for-media/2009/cpr-2010-a1c-diagnostic-tool.html
Adler, N. E., & Ostrove, J. M. (1999). Socioeconomic status and health: what we know and what we don't. Annals of the New York Academy of Sciences, 896, 3-15. Annis, A. M., Caulder, M. S., Cook, M. L., & Duquette, D. (2005). Family history,
diabetes, and other demographic and risk factors among participants of the National Health and Nutrition Examination Survey 1999-2002. Preventing
Chronic Disease, 2(2), A19.
Barker D. J. P. (1994). Mothers, Babies and Disease in Later Life. London: BMJ Publishing Group.
Barnes, P. H. (1961). Prediabetes and Pregnancy, Canadian Medical Association Journal,
85(12), 681-688.
Boltri, J. M., Okosun, I. S., Davis-Smith, M., & Vogel, R. L. (2005). Hemoglobin A1C Levels in Diagnosed and Undiagnosed Black, Hispanic, and White Persons with Diabetes: Results from NHANES 1999-2000. Ethnicity & Disease, 15(4), 562-567.
Bowman, S. (2009). Socioeconomic Characteristics, Dietary and Lifestyle Patterns, and Health and Weight Status of Older Adults in NHANES, 1999-2002: A
Comparison of Caucasians and African Americans. Journal of Nutrition For the Elderly, 28(1), 30-46.
Boyle J. P., Honeycutt A. A., Narayan K. M. V., Hoerger T. J., Geiss L. S., Chen H., Thompson T. J. (2001). Projection of Diabetes Burden Through 2050 Impact of changing demography and disease prevalence in the U.S. Diabetes Care, 24(11), 1936-1940.
Beckles, G. L. A., & Thompson-Reid, P. E. (2002). Socioeconomic Status of Women with Diabetes --- United States, 2000, Morbidity and Mortality Weekly Report, 51(07), 147-8, 159.
CDC. (2002). NHANES 1999-2000 Addendum to the NHANES III Analytic Guidelines. Retrieved from http://www.cdc.gov/nchs/data/nhanes/guidelines1.pdf
CDC. (2007). 2007 National Diabetes Fact Sheet: general information and national estimates of diabetes in the United States. Atlanta, GA: U.S. Department of Health and Human Services, Centers for Disease Control and Prevention. Retrieved October 21, 2009, from
31
CDC. (2009). NHANES - About the National Health and Nutrition Examination Survey.
National Center for Health Statistics. Retrieved February 13, 2010, from
http://www.cdc.gov/nchs/nhanes/about_nhanes.htm
CDC. (2009). Public-Use Data Files and Documentation. Retrieved February 13, 2010, from http://www.cdc.gov/nchs/data_access/ftp_data.htm
Coutinho, M., Wang, Y., Gerstein, H. C., & Yusuf, S. (1999). The Relationship Between Glucose and Incident Cardiovascular Events, Diabetes Care22(2), 233-240. Cowie, C. C., Rust, K. F., Ford, E. S., Eberhardt, M. S., Byrd-Holt, D. D., Li, C.,…Geiss,
L. S. (2009). Full Accounting of Diabetes and Pre-Diabetes in the U.S. Population in 1988–1994 and 2005–2006. Diabetes Care, 32(2), 287-294.
Damm, P. (2009). Future risk of diabetes in mother and child after gestational diabetes mellitus. International Journal of Gynecology and Obstetrics,104(1), S25 -6. Diabetes Prevention Program Research Group. (2002). Reduction in the Incidence of
Type 2 diabetes with Lifestyle Intervention or Metformin. N Engl J Med, 346(6), 393-403.
Feinstein, J. S. (1993). The relationship between socioeconomic status and health: a review of the literature. The Milbank Quarterly, 71(2), 279-322.
Fryar, C. D., Merino, M. C., Hirsch, R., & Porter, K. S. (2009). Smoking, Alcohol Use, Illicit Drug Use Reported by Adolescents Aged 12-17 years: United States, 1999-2004. National Health Statistics Reports, 15.
Hertz, R., Unger, A., & Ferrario, C. (2006). Diabetes, Hypertension, and Dyslipidemia in Mexican Americans and Non-Hispanic Whites. American Journal of Preventive
Hogan, P., Dall, T., & Nikolov, P. (2003). Economic Costs of Diabetes in the U.S. in 2002, Diabetes Care, 26(3), 917-932. Joseph, K.S., & Kramer, M. S. (1996). Review of the Evidence on Fetal and Early Childhood Antecedents of Adult Chronic Disease. Epidemiologic Interviews, 18(2): 158.
Joseph, K.S., & Kramer, M. S. (1996). Review of the Evidence on Fetal and Early Childhood Antecedents of Adult Chronic Disease. Epidemiologic Interviews, 18(2): 158.
Liberatos, P., Link, B. G., & Kelsey, J. L. (1988). The measurement of social class in epidemiology. Epidemiologic Reviews, 10, 87 -121.
Lindquist, C. H., Gower, B. A., & Goran, M. I. (2000). Role of dietary factors in ethnic differences in early risk of cardiovascular disease and type 2 diabetes. American
Journal of Clinical Nutrition, 71(3), 725-732.
Link, C. L., & McKinlay, J. B. (2009). Disparities in the prevalence of diabetes: is it race/ethnicity or socioeconomic status? Results from the Boston Area Community Health (BACH) survey. Ethnicity and Disease, 19(3), 364-5.
MayoClinic.com. (n.d.). PrediabetesMayoClinic.com. Retrieved February 7, 2010, from http://www.mayoclinic.com/health/prediabetes/DS00624/DSECTION=symptoms Meigs, J. B., Nathan, D. M., D'Agostino, R. B., & Wilson, P. W. F. (2002). Fasting and
postchallenge glycemia and cardiovascular disease risk: the Framingham Offspring Study. Diabetes Care, 25(10), 1845-1850.
MMWR. (2003). Prevalence of Diabetes and Impaired Fasting Glucose in Adults --- United States, 1999--2000, 52(35), 833-837.
32
& Bernard C. (2007). Impaired Fasting Glucose and Impaired Glucose Tolerance.
Diabetes Care, 30(3), 753-759.
NIH (2008). National Diabetes Statistics, 2007. National diabetes Information Clearing
House, Retrieved February 6, 2010, from
http://diabetes.niddk.nih.gov/dm/pubs/statistics/index.htm
Nichols, G. A., & Brown, J. B. (2005). Higher Medical Care Costs Accompany Impaired Fasting Glucose. Diabetes Care, 28(9), 2223-2229.
Retnakaran, R. (2008). Watch for Impaired Glucose Tolerance During Pregnancy,
Clinician Reviews, 18(8).
Robbins, J. M., Vaccarino, V., Zhang, H., & Kasl, S. V. (2001). Socioeconomic Status and Type 2 diabetes in African American and Non-Hispanic White Women and Men: Evidence from the Third National Health and Nutrition Examination Survey, American Journal of Public Health,91(1), 76-83.
Rolka, D. R., Burrows, N. R., Li, Y., & Geiss, L. S. (2008). Self-Reported Prediabetes and Risk-Reduction Activities --- United States, 2006. Morbidity and Mortality
Weekly Report, 57(44), 1203-1205.
Signorello, L. B., Schlundt, D. G., Cohen, S. S., Steinwandel, M. D., Buchowski, M. S., McLaughlin, J. K., Hargreaves, M. K., & Blot, W. J. (2007). Comparing Diabetes Prevalence between African Americans and Whites of Similar Socioeconomic Status. American Journal of Public Health, 97(12), 2260-2267.
Smith, J. P. (1999). Smith JP. Healthy bodies and thick wallets: the dual relation between health and economic status. J Econ Perspect, 13(2), 145-166.
Tuomilehto, J., Lindstrom, J., Eriksson, J. G., Valle, T. T., Hamalainen, H., Ilanne-Parikka, P., Keinanen-Kiukaanniemi, S.,… Uusitupa, M. (2001). Prevention of Type 2 diabetes Mellitus by Changes in Lifestyle among Subjects with Impaired Glucose Tolerance. N Engl J Med, 344(18), 1343-1350.
de Vegt, F., Dekker, J. M., Jager, A., Hienkens, E., Kostense, P. J., Stehouwer, C. D. A., Nijpels, G.,….Heine, R. (2001). Relation of Impaired Fasting and Postload Glucose With Incident Type 2 diabetes in a Dutch Population: The Hoorn Study.
Journal of American Medical Association,285(16), 2109-2113.
Wahl, P., Savage, P., Psaty, B., Orchard, T., Robbins, J., & Tracy, R. (1998). Diabetes in older adults: comparison of 1997 American Diabetes Association classification of diabetes mellitus with 1985 WHO classification. The Lancet, 352(9133), 1012-1015.
Wing, R. R., Epstein, L. H., Blair, E., & Nowalk, M. P. (1985). Psychologic Stress and Blood Glucose Levels in Nondiabetic Subjects, Psychosomatic Medicine,47(6). Wood, S. L., Sauve, R., Ross, S., Brant, R., & Love, E. J. (2000). Prediabetes and
perinatal mortality. Diabetes Care,23(12), 1752-4.
Zhang, Q., Wang, Y., & Huang, E. (2009). Changes in racial/ethnic disparities in the prevalence of Type 2 diabetes by obesity level among US adults. Ethnicity &
Health, 14(5), 439-457.