www.hydrol-earth-syst-sci.net/18/4965/2014/ doi:10.5194/hess-18-4965-2014
© Author(s) 2014. CC Attribution 3.0 License.
Predicting East African spring droughts using Pacific
and Indian Ocean sea surface temperature indices
C. Funk1, A. Hoell2, S. Shukla2, I. Bladé3, B. Liebmann4, J. B. Roberts5, F. R. Robertson5, and G. Husak2 1US Geological Survey and University of California Santa Barbara Geography, Santa Barbara, USA
2University of California Santa Barbara Geography, Santa Barbara, USA
3Universitat de Barcelona and Institut Català de Ciències del Clima, Barcelona, Spain 4University of Colorado and NOAA Earth Systems Research Laboratory, Boulder, USA 5NASA Marshall Space Flight Center, Huntsville, USA
Correspondence to: C. Funk (chris@geog.ucsb.edu)
Received: 21 February 2014 – Published in Hydrol. Earth Syst. Sci. Discuss.: 20 March 2014 Revised: 5 September 2014 – Accepted: 5 November 2014 – Published: 10 December 2014
Abstract. In eastern East Africa (the southern Ethiopia, east-ern Kenya and southeast-ern Somalia region), poor boreal spring (long wet season) rains in 1999, 2000, 2004, 2007, 2008, 2009, and 2011 contributed to severe food insecurity and high levels of malnutrition. Predicting rainfall deficits in this region on seasonal and decadal time frames can help de-cision makers implement disaster risk reduction measures while guiding climate-smart adaptation and agricultural de-velopment. Building on recent research that links more fre-quent East African droughts to a stronger Walker circulation, resulting from warming in the Indo–Pacific warm pool and an increased east-to-west sea surface temperature (SST) gra-dient in the western Pacific, we show that the two dominant modes of East African boreal spring rainfall variability are tied to SST fluctuations in the western central Pacific and central Indian Ocean, respectively. Variations in these two rainfall modes can thus be predicted using two SST indices – the western Pacific gradient (WPG) and central Indian Ocean index (CIO), with our statistical forecasts exhibiting reason-able cross-validated skill (rcv ≈0.6). In contrast, the current generation of coupled forecast models show no skill during the long rains. Our SST indices also appear to capture most of the major recent drought events such as 2000, 2009 and 2011. Predictions based on these simple indices can be used to support regional forecasting efforts and land surface data assimilations to help inform early warning and guide climate outlooks.
1 Introduction
1.1 How understanding trends can lead to better drought predictions
Since 2003, scientists from the University of California, Santa Barbara’s Climate Hazards Group, the US Geological Survey, the Universitat de Barcelona, the National Ocean and Atmospheric Administration’s (NOAA) Earth Systems Re-search Laboratory, Physical Science Division, Climate Anal-ysis Branch, and the National Aeronautics and Space Admin-istration have been working to improve the US Agency for International Development’s Famine Early Warning System Network’s (FEWS NET) drought early warning capabilities for eastern Africa. In this introduction, we describe how our deepening understanding of boreal spring rainfall trends can lead to useful new SST indices that support better drought prediction.
study (Funk et al., 2008) examined the canonical correlation between moisture transports over eastern Africa and reanal-ysis precipitation over the Indian Ocean and found that in-creased precipitation over the southern central Indian Ocean (CIO, 0–15◦S, 60–90◦E) is associated with decreased east-erly low-level moisture flows into the Horn of Africa. Further confirmation of this relationship was obtained from a sim-ulation using the Community Atmospheric Model (CAM), which suggested that anomalous diabatic heating over the In-dian Ocean decreased onshore moisture transports (Funk et al., 2008).
These diagnostic analyses were later extended by using a combined principal component analysis (PCA) based on zonal surface winds, 500 hPa vertical velocities, rainfall and SSTs over the tropical Indo–Pacific area (IPA) (Williams and Funk, 2011). The leading principal component (PC) was shown to represent a low-frequency oceanic warming sig-nal associated with an enhancement of the Indian branch of the Walker circulation increased warm pool precipitation and with declining rainfall in eastern Africa and the cen-tral equatorial Pacific. Specifically, Figs. 7 and 8 of Williams and Funk (2011) identified enhanced low-level convergence and increases in convection over the warm pool, subsidence over the eastern Horn of Africa, westerly surface zonal wind anomalies over the northern equatorial Indian Ocean, and re-ductions in total atmospheric precipitable water over eastern Africa.
While the first mode of Williams and Funk’s (2011) com-bined PCA exhibited a strong secular trend and tracked closely with global average temperatures (r=0.86), the sec-ond mode varied on interannual timescales and was strongly related to the El Niño–Southern Oscillation (ENSO), with a negative correlation of -0.75 between its time series and the Niño 4 SST index (5◦S–5◦N, 160◦E–150◦W). Like the IPA PC1 “trend mode”, the second mode (in one of its phases) was associated with drying over East Africa via anomalies in the Indian Ocean’s Walker circulation
The IPA PC1, which was linked to warming in the Indo– Pacific warm pool, appeared to be associated with East African (EA) drought in two ways. First, PC1 helps explain the downward 1980–2009 rainfall trends across the eastern portions of the Greater Horn of Africa. Second, it was hy-pothesized that the enhanced subsidence associated with the increasing PC1 mode would be even stronger when occur-ring in combination with a La Niña event. Indeed, La Niña events also produce increased upward motion over the equa-torial Indo–Pacific and increased subsidence and higher sur-face pressures over East Africa (Nicholson and Kim, 1997; Nicholson and Selato, 2000; Ogallo, 1988). To test this hy-pothesis, 1950–2009 La Niña events were categorized into warm warm-pool and cool warm-pool groups (based on the IPA PC1) and composited. Composites of La Niña events dis-played a much stronger negative precipitation anomaly over eastern Africa when the warm pool was warmer. Since the warm pool has exhibited a strong increase in temperature
over the past few decades, this corresponded with a stronger La Niña teleconnection in the recent period (Williams and Funk, 2011). In particular, over eastern East Africa compos-ites of low PC1/La Niña events had standardized precipita-tion index (SPI) (McKee et al., 1993) values of about−0.1, while composites of high PC1/La Niña events had SPI values ranging from−0.4 to−0.8. In the summer of 2010, when our NOAA partners predicted that there was a high proba-bility for the development of a strong La Niña, FEWS NET used composites of high PC1/La Niña events to provide early warning of the devastating 2011 drought (Ververs, 2011).
In 2012, new research (Lyon and DeWitt, 2012) suggested that a 1998 shift in Pacific SSTs had played an important role in increasing the intensity of the Walker circulation, thereby drying eastern East Africa. In that study several sets of atmospheric general circulation model (GCM) simula-tions were run to isolate the Indian and Pacific effects. In-dian Ocean forcing produced anomalous circulations similar to those identified in prior FEWS NET analyses of Indian Ocean influences (Funk et al., 2005, 2008; Jury and Funk, 2013; Verdin et al., 2005; Williams et al., 2011). The Pacific Ocean forcing effects were consistent with those identified in the spring IPA analysis of Williams and Funk (2011).
In 2013 and 2014, FEWS NET scientists built on Williams and Funk (2011) and Lyon and DeWitt (2012) to bet-ter explain these teleconnections. Hoell and Funk (2013a) showed that a stronger western Pacific SST gradient (WPG) combined with La Niña conditions produced stronger East African spring drying. Hoell and Funk (2013a) defined the WPG as the difference between standardized SST in the Niño 4 region (160◦E–150◦W, 5◦S–5◦N) and the western Pacific (WP, 130–150◦E, 0–20◦N).
The WPG analysis of Hoell and Funk (2013a) is simi-lar to Williams and Funk (2011), but offers a more trans-parent physical mechanism: a strong WPG combined with a cold eastern Pacific produces a strong SST gradient spanning the entire Pacific Basin; stronger SST gradients are known to produce larger circulation changes (Lindzen and Nigam, 1987). The temporal response of the WPG combines the long-term warming trend of the WP (Funk, 2012) with the strong ENSO-related variations of the Niño 4 regions.
The WPG and CIO indices, furthermore, can link the process-based studies discussed above with the requirements of real-time monitoring, climate diagnostics and analyses. Such analysis helped FEWS NET identify analog years and effectively communicate risks to decision makers in 2011 (Ververs, 2011) and 2012. Our main point is that there are important climate indices, beyond the well-known Niño 3.4 (Indeje et al., 2000) and the Indian Ocean dipole (IOD) in-dices (Saji et al., 1999), that can inform East African climate outlooks such as the Greater Horn of Africa Climate Out-look Forum (GHACOF). While these other indices are good indicators of the region’s boreal fall “short” rains, the WPG may be preferable during boreal spring because of the high sensitivity this season exhibits to WP and Niño 4 SST.
1.2 Climate change and Pacific decadal variability (PDV)
Long-rain declines have been confirmed by many recent studies (Funk et al., 2012; Liebmann et al., 2014; Lyon and DeWitt, 2012; Viste et al., 2012), and corroborated by analyses of normalized difference vegetation index imagery (Pricope et al., 2013) and satellite-observed soil moisture (Omondi et al., 2013). Omondi et al. (2013) identify a large post-2005 decline in the Gravity Recovery and Climate Ex-periment (GRACE) soil moisture values over the Greater Horn of Africa. These declines appear consistent with the detailed 2008–2011 drought analyses provided by Nichol-son (2014b). The source of the SST forcing behind these re-cent East African rainfall declines, however, continues to be a matter of considerable debate.
One interpretation (Funk et al., 2013) is that the re-cent strengthening of the WPG, warm pool precipitation in-creases, and related East African precipitation declines, is a function of anthropogenic warming in the WP combined with natural decadal cooling in the central Pacific. Both the WP SST (Hoell and Funk, 2013b) and the magnitude of the WPG (Hoell and Funk, 2013a) have increased dramatically over the past 30 years, increasing the frequency of droughts and the number of opportunities for drought prediction. Hoell and Funk (2013b) compare the influence of WP, IOD and ENSO influences on boreal spring East African rainfall, and find that WP drought influences tend be as strong as or stronger than IOD and ENSO. This view implies that WP warming is largely anthropogenic and has contributed to re-cent East African drying.
An alternative interpretation (Lyon et al., 2013; Yang et al., 2014) suggests that the dominant driver of recent East African drought has been PDV, interpreted as linearly de-trended ENSO-residual changes in Pacific SST. Lyon et al. (2013) make a convincing and important case for the large dynamic response associated with the tropical SST anomaly pattern found in detrended ENSO-residual SST. The research presented in Lyon and DeWitt (2012), furthermore, helped motivate the gradient analyses leading to this current
pub-lication. The research presented here, however, suggests that (i) most of the recent “decadal” variability in detrended west-ern Pacific SST arises due to anthropogenic warming, so that (ii) decadal variability of East African long rains can best be described by a combination of a recent secular decline and decadal variations. Furthermore, we suggest that (iii) an un-derstanding of the greater sensitivity of East African precipi-tation to WP versus Niño 4 warming may help support more effective precipitation forecasts.
1.3 Paper organization
This paper is organized as follows. Section 2 describes our data sets. Section 3.1 describes our two prediction targets: the first and second principal components (PC1 and PC2) of East African precipitation for the 1981–2013 time period, esti-mated using the new 0.05◦×0.05◦gridded Climate Hazards group Infrared Precipitation with Stations (CHIRPS) data (Funk et al., 2014). We first briefly describe the CHIRPS pre-cipitation data set; then we explore the pattern and time series associated with the first two principal components during the March–May season. Spatial correlations (Sect. 3.2) between these principal components and antecedent (January) SST show that the leading spatial pattern (PC1) exhibits Pacific SST gradients similar to the WPG (Hoell and Funk, 2013a) and correlation structures between East African precipitation and SSTs (Funk et al., 2013; Liebmann et al., 2014; Tier-ney et al., 2013). The second-mode SST correlation struc-ture (PC2), however, is similar to the patterns found in ear-lier studies (Funk et al., 2005, 2008) focused on the CIO. In Sect. 3.3 we show that the WPG and CIO indices can be useful large-scale climate indicators when used to pre-dict PC1 and PC2. We relate PC1 to the WPG, and PC2 to CIO SST. We then show that these simple indices provide a reasonable basis for forecasting some East African precipita-tion extremes. Secprecipita-tion 3.4 provides a case study forecasting the 2014 long rains. Section 3.5 provides a brief analysis of long–term changes in WPG SSTs in both observations and model simulations. Section 4 summarizes our results.
2 Data
The 1981–2013 CHIRPS data set (Funk et al., 2014) com-bines satellite cold cloud duration rainfall estimates with gauge observations and a high-resolution (0.05◦) precipita-tion climatology. Comparisons between the CHIRPS fields and two state-of-the-science data sets: the Global Precipi-tation Climatology Centre data set (Schneider et al., 2013) and the Global Precipitation Climatology Project (Adler et al., 2003) data sets, reveal a reasonable level of correspon-dence among all three data sources. We compare the major modes of variability (principal components) of the March– May CHIRPS with January SSTs from the ER3b (Smith et al., 2008).
The final section of the analysis presented here considers a longer time span (1920–2013) using the gridded Global Pre-cipitation Climatology Centre (GPCC) data set. The anal-ysis was not pushed further back in time because of con-cerns about the limited and poor quality East African sta-tion data (Liebmann et al., 2013). This final secsta-tion also uses an ensemble of 53 Phase 5 Coupled Model Intercomparison Project (CMIP5) simulations from 14 models (Taylor et al., 2011). In these runs, coupled atmosphere–ocean general cir-culation models are initialized, allowed to spin up for sev-eral hundred years, and then used to simulate climate from 1850 onward. The models are driven by observed changes in greenhouse gasses, solar insolation and aerosols. The models used are listed in Table 1. These CMIP5 simulations were ob-tained from the Royal Netherlands Meteorological Institute’s Climate Explorer.
3 Results
3.1 CHIRPS principal component patterns and time series
PCA provides a way of compactly summarizing the spa-tiotemporal variations in data sets. PCA produces matched sets of principal component time series and spatial patterns (loading maps, based on the covariance matrix). The first principal component time series and associated pattern de-scribes the largest possible amount of the variance by aggre-gating locations that tend to be positively or negatively cor-related with each other. At a given time step, multiplying the PC1 time series value by the associated first principal com-ponent loading map yields the partial contribution of that PC to total rainfall. This process can be repeated for the second component, which explains most of the remaining variance of the data, after the first principal component has been re-moved. We will predict the two leading March–May PC1 and PC2 time series using the January WPG and CIO SST indices and then use these two components to generate March–May rainfall prediction maps. The January SST data were cho-sen as a predictor because the East African climate experts typically gather in mid-February at the GHACOF to produce a regional forecast for East Africa. PCA provides an
alterna-Table 1. Coupled ocean–atmosphere models used in this study.
Modeling group
Commonwealth Scientific and Industrial Research Organization (CSIRO) and Bureau of Meteorology (BOM), Australia
Canadian Centre for Climate Modelling and Analysis
National Center for Atmospheric Research
Community Earth System Model Contributors
Centre National de Recherches Météorologiques/Centre Européen de Recherche et Formation Avancée en Calcul Scientifique
EC-EARTH consortium
The First Institute of Oceanography, SOA, China
NOAA Geophysical Fluid Dynamics Laboratory
NASA Goddard Institute for Space Studies
Met Office Hadley Centre
Institute for Numerical Mathematics
Institut Pierre-Simon Laplace
Atmosphere and Ocean Research Institute (The University of , Tokyo) National Institute for Environmental Studies, and Japan Agency for Marine-Earth Science and Technology
Max-Planck-Institut für Meteorologie (Max Planck Institute for Meteorology)
tive to the definition, analysis and prediction of homogeneous rainfall areas (cf. Nicholson 2014a). For most forecasting ap-plications, the analysis of homogeneous areas is preferable. We have used PCA values in this illustrative study because they provide, by definition, representative time series that de-scribe the highest possible precipitation variance. They there-fore provide insight into regional precipitation–SST relation-ships, and can help benchmark forecast relationships used in regional land surface models as in Shukla et al. (2014a, b).
Figure 1 shows the first and second principal compo-nent maps and time series for our extended East African re-gion. The principal components were calculated based on the 1981–2013 covariance matrix. PC1 and PC2 explained 26 and 12 %, respectively, of the total rainfall variance in the study region. Experiments with different spatial domains in-dicated very little (substantial) sensitivity to variations in the north–south (east–west) limit and size of domain, especially for PC1. This sensitivity and the temporal loading patterns of PC1 indicate that we are primarily focusing on the east-ern East Africa region, identified as a homogenous area by Nicholson (2014a) and Liebmann et al. (2014).
[image:4.612.306.546.83.363.2]Figure 1. (a) 33-year changes in standardized March–May precipitation associated with the trend in PC1. (b) same for PC2. (c) 33-year
changes in standardized March–May precipitation associated with a linear trend. (d) Standardized time series of PC1 (solid red line) and PC2 (dashed blue line). (e) Eigenvector loadings for PC1. (f) Same for PC2.
change in the standardized precipitation associated with the first and second mode. The linear trend in PC1 is significant (p=0.03), the trend in PC2 is not (p=0.11).
This can help us understand the contributions of changes in the first and second principal components to the total ob-served trends (shown in Fig. 1c). Standardized changes are shown to emphasize the emergent food security risks in the red areas of Fig. 1c. In these regions rainfall has declined by more than half a standard deviation, greatly increasing the frequency of below-normal crop and pasture conditions.
Figure 1a indicates substantial rainfall declines associated with PC1, extending from northern Tanzania through Yemen, with the strongest standardized declines being found just north of the Equator, but with large declines (more than half a standard deviation) occurring in a large part of the domain. Figure 1b was created in an identical fashion, using PC2. This pattern tends to emphasize off-equatorial regions of Tanzania, northern Ethiopia, Eritrea, and Djibouti, but PC2 does not appear to have contributed substantially to recent rainfall declines. Figure 1d shows the time series for these two principal components. Figure 1e and f show the rainfall loading patterns associated with PC1 and PC2. The first prin-cipal component identifies many intense drought years: 1984,
1992, 1999, 2000, 2004, 2008, 2009, and 2011. The negative PC2 values in 1988, 2003, 2008, 2009, and 2013 were as-sociated with dryness in Tanzania and Ethiopia, but not near the Equator. Both time series exhibit substantial interannual variations. PC1 indicates substantial declines between 1981 and 2013.
The total rainfall trend for this period is presented in Fig. 1c. This trend pattern suggests that the substantial rain-fall declines that have occurred over the last 33 years (1994– 2013) can be ascribed largely to the first leading mode. We next examine the relationships between the corresponding time series and antecedent January SST. The analysis of Jan-uary SST can inform regional food security outlooks, pro-viding sufficient lead time to shape contingency plans, guide resource distribution, and help preposition humanitarian as-sistance before long rainy season droughts begin.
3.2 Correlations with January SST
[image:5.612.131.468.67.375.2]re-Figure 2. (a) Correlations between March–May CHIRPS PC1 and January SSTs; (b) same for the CHIRPS PC2. Values have been screened
at a 10 % significance level. Boxes in (a) and (b) show the regions used to the define the WPG and CIO SST indices.
cent increase in the sensitivity of East African precipitation to Indo–Pacific SST forcing. This increase in sensitivity is likely related to the long-term WP warming trend (Williams and Funk, 2011; Hoell and Funk, 2013b), an increase in the Indian branch of the Walker circulation (Williams and Funk, 2011; Liebmann et al. 2014), and a stronger WPG (Hoell and Funk, 2013a). Changes in these climate conditions accompa-nied by a future transition to a warmer central Pacific Ocean (as predicted by climate change models) might weaken the boreal spring teleconnection pattern.
It should be noted that the strength of these SST corre-lations depend on the time period analyzed. As discussed in Funk et al. (2013) or Liebmann et al. (2014), the strong negative correlation structure shown in Fig. 2a has only manifested since the mid 1990s. Running correlations with Niño 3.4 SSTs indicate weak relationships before that pe-riod (Funk et al., 2013). Analyses of 1948–1987 climate data (Hastenrath et al., 2011), furthermore, indicate weak telecon-nections between Kenyan boreal spring rainfall and the at-mospheric circulation over the Indian Ocean. As the mean Walker circulation has intensified (L’Heureux et al., 2013), however, the East African drought impacts of La Niña-like SST patterns has intensified (Williams and Funk, 2011) due to the influence of a stronger WPG (Hoell and Funk, 2013a), resulting in the type of correlation structure shown in Fig. 2a. Atmospheric global circulation models (AGCMs) have also been used to confirm the plausibility of this correlation pat-tern (Hoell and Funk, 2013b; Liebmann et al., 2014; Lyon and DeWitt, 2012).
The correlations (Fig. 2a) between the March–May PC1 (solid red line in Fig. 1d) and the preceding January SST field indicate that a stronger than normal west-to-east warm-to-cool Pacific SST gradient over the tropical Pacific is asso-ciated with dry conditions over most of the Horn of Africa, consistent with earlier findings (Tierney et al., 2013; Lyon and DeWitt, 2012; Liebmann et al., 2013; Hoell et al., 2013; Hoell and Funk, 2013b; Funk et al., 2013). The blue and red boxes denote the Niño 4 and WP regions; the WPG in-dex is estimated as the SST difference between these regions following Hoell and Funk (2013b). The WPG is calculated
by subtracting WP SSTs from Niño 4 SSTs; this difference is typically negative. A more negative WPG value denotes a strengthening of the climatological equatorial Pacific SST gradient.
The correlation pattern associated with PC2 (Fig. 2b) iden-tifies warming in the Indian Ocean with drying in parts of the Horn of Africa, particularly Ethiopia and Tanzania. These re-sults are also consistent with prior research focusing on the causes of Ethiopian rainfall declines, which identified tele-connections to the Indian Ocean (Williams et al., 2011; Funk et al., 2005; Jury, 2010). While other regions in Fig. 2b ex-hibit significant correlations, we focus here on the CIO be-cause of prior literature and the plausible physical telecon-nection between this region and the adjacent Greater Horn of Africa. Nonetheless, warming in the central Pacific also ap-pears to be associated with East African drying (in contrast to the pattern associated with PC1).
3.3 Using January WPG and CIO indices to predict March–May CHIRPS PC1 and PC2
[image:6.612.101.495.71.189.2]mod-est teleconnection is quite similar to results obtained from ECHAM5 simulations (Liebmann et al., 2013).
For the PC2 time series we used a regression based on the full period of record (1981–2013), since the negative rela-tionship between SST in the CIO region (0–15◦S, 60–90◦E) and PC2 was found to be robust throughout the time pe-riod evaluated. The corresponding 1981–2013 regression ex-plained 33 % of the total variance of PC2. For every standard deviation increase in CIO SSTs, PC2 declined−0.6 standard deviations.
The two leading CHIRPS principal components during the period March–May over East Africa relate, respectively, to SST anomalies in the Pacific and Indian oceans (Fig. 2) during January. Figure 3a–c show scatterplots of the cross-validated 1994–2013 PC1, 1981–1993 PC1 and 1981-2013 PC2 estimates. The cross-validation was carried out using a “leave-one-out” algorithm. Each year’s data was withheld, the regression coefficients re-estimated and the regression es-timate for the withheld year compared to the corresponding observed data. The y axes depict the observed March–May principal components from the CHIRPS data. The time se-ries of these components are also plotted in Fig. 1d. The
x axes represent jack-knifed regression estimates of these PCs based on either the WPG or CIO indices calculated from January SST. Over the past 20 years, the combination of win-tertime La Niña conditions and warm western Pacific SSTs (large negative WPG) presage low PC1 values (Fig. 3a). The three most extreme dry (low PC1) seasons in this period (1999, 2000 and 2011) are captured well (dark black dia-monds). Over the 1981–1993 period, the PC1 WPG relation-ship was weak (Fig. 3b), consistent with the aforementioned reports of weak zonal connections in the Indo–Pacific region (Hastenrath et al., 2011). The skill of the CIO index, comes more from distinguishing between high PC2 values associ-ated with relatively cool Indian Ocean SSTs between 1981 and 1996 and low PC2 values related to the warm Indian Ocean conditions that have persisted since 1997. These time periods are denoted respectively with diamonds and triangles in Fig. 3c.
These simple WPG and CIO indices can thus be used to predict PC1 and PC2, which can then be multiplied against their loading maps and summed to produce hindcasts of East African March–May rainfall. The correlation between these forecasts and observed 1994–2013 CHIRPS rainfall is shown in Fig. 3d. The eastern Horn of Africa, southern Tanzania, Eritrea, Djibouti, and Yemen all exhibit positive correla-tions. One region of northern Tanzania is poorly represented, and exhibits negative correlations. While rainfall in northern Tanzania has been declining (Fig. 1c), these declines seem poorly related to WPG/PC1 or CIO/PC2 changes. Regional climate change simulations (Cook and Vizy, 2013) have sug-gested that this region may be more sensitive to changes in trans-Congo moisture transports, while drying in Kenya, southern Somalia and southern Ethiopia might be related to changes in the Somali jet.
Figure 3. (a) Scatterplot of 1994–2013 March–May PC1
observa-tions (yaxis) and cross-validated PC1 estimates based on January WPG SSTs (xaxis). (b) Same but for 1981–1993. (c) Scatterplot of 1981–2013 March–May PC2 observations (yaxis) and estimates based on January WPG SSTs (xaxis). The 1981–1996 and 1997– 2013 time periods are denoted respectively with diamonds and tri-angles. (d) 1993–2013 correlation between forecasts and observed rainfall.
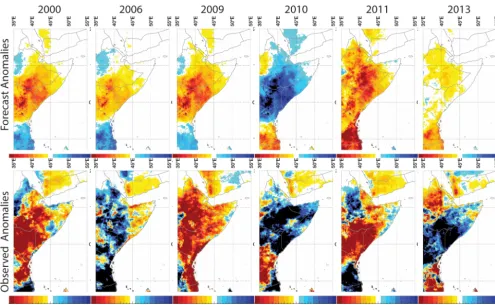
[image:7.612.310.546.65.368.2]Figure 4. Forecasts and observed March–May SPI values for 2000, 2006, 2009, 2010, 2011 and 2013.
We hypothesize that there may be a nonlinear East African precipitation response to WP and Niño 4 SST variations caused by the interaction of the long-term warming trend and ENSO. Over the past 20 years, during La Niña events, the ef-fects of the long-term WP warming trend and cold Niño 4 SST act to reinforce each other, making droughts more pre-dictable. During neutral or El Niño-like conditions, instead, the two effects cancel out and East African precipitation may be more influenced by less predictable Indian Ocean SST, variations in the Madden–Julian Oscillation (Pohl and Camberlin, 2006), or internal atmospheric dynamics. With-out the combined influences of warm WP and La Niña condi-tions, these natural weather variations may play a more dom-inant role in producing normal or above-normal East African precipitation.
3.4 A case study addressing the 2014 long rains Here we briefly describe how the WPG and CIO indices were used in February of 2014 to produce an operational forecast for FEWS NET. This case study provides an example of how these indices might be used in the context of a GHACOF forecast setting. Despite weak forecasts for the onset of El Niño conditions, the ocean in January of 2014 exhibited sub-stantial warm (cold) conditions in the WP (Niño 4) region, indicating a strong WPG (Fig. 5a). CIO conditions (Fig. 5a)
were close to neutral, or slightly warm. Given that the re-gression between 1994–2013 East African March–May stan-dardized precipitation index and the January WPG indicates reasonable levels of skill (r=0.57) and is able to identify the worst drought years (recall Sect. 3.3), this regression was used to produce a forecast for modestly below-normal rain-fall (X in Fig. 5b). This forecast and the assumption of Gaus-sianity was used to derive tercile-based probability forecasts, indicating normal to below-normal rains (Fig. 5c).
Figure 5. (a) January 2014 SST anomalies. (b) Scatterplot of observed and hindcast East African March–May SPI values. Bold diamonds
denote 2000, 2009 and 2011. The bold X marks the forecast for 2014 made in February of 2014. (c) 2014 forecast rainfall tercile probabilities.
(d) April–May 2014 CHIRPS rainfall ranks. (e) Time series of GPCC and CHIRPS April–May rainfall for Kenya (excluding the Nyanza and
Western provinces) and south-central and southeastern Ethiopia, as indicated by the inset map in (e).
less than 190 mm of rainfall, the 1930–1980 average. We therefore conclude that at least some of the most extreme dry seasons seem to be predictable and associated with strong WPG conditions.
3.5 Examining long time series of East African rainfall and SSTs
We briefly examine long time series of East African rain-fall and SSTs. Our objective is to place recent East African rainfall declines in a deeper historical context. We have av-eraged the GPCC interpolated gauge data set over our entire study region (25–55◦E, 13◦S–20◦N), converted the result-ing time series into an EA SPI time series (McKee et al., 1993), smoothed the results with 10-year running means, and plotted the results in Fig. 6a. Between 1920 and 1980, the GPCC time series exhibits interdecadal oscillations, indica-tive of the climate sensitivity of this semiarid region. After 1980, the GPCC begins a large decline to arrive at a very low decadal average SPI of−0.7. We have used a regression based on 1930–2012 January WP and Niño 4 SST data to create standardized estimates of the WPG time series. This gives us a way to quantify the relative influence of WP and Niño 4 SST changes. The results indicate an almost one-to-one correspondence between WP SST changes and the East African SPI time series: 1◦of WP warming is associated with about one standardized anomaly decrease in rainfall. The re-gression coefficient between the EA SPI and WP SST was −0.997. The sensitivity to Niño 4 SST changes is
substan-tially less and of the opposite sign; 1◦ of Niño 4 warming is associated with about a +0.4 standardized anomaly in-crease in rainfall. The regression coefficient between EA SPI and Niño 4 SST was+0.419. These results seem plausible given the very warm average SST found in the warm pool (∼29◦C). Relatively small increases in temperatures in the warm pool are associated with relatively large increases in moist entropy and precipitation (Folkins and Braun, 2003). These empirical results suggest that boreal spring EA pre-cipitation exhibits a greater sensitivity to WP warming.
[image:9.612.128.469.64.296.2]Figure 6. (a) Time series of smoothed standardized GPCC data for the study region (red solid line), and WPG-based estimates of GPCC SPI
(blue dashed line). (b) The western Pacific (red solid line) and Niño 4 (solid blue line) contributions to the EA SPI estimates shown in blue in (a). Dashed red and blue lines show the WP and Niño 4 contribution estimates based on the mean of a 53-member CMIP5 ensemble.
(c) Observed western Pacific SST anomalies (solid red line), CMIP5 western Pacific SST anomalies (dashed blue line), and linear fits (straight
red and blue lines). (d) Detrended western Pacific SST anomalies (solid red line) and detrended CMIP5 western Pacific SST anomalies (dashed blue line).
time series were produced by multiplying the WP and Niño 4 SST time series by the regression coefficients used in Fig. 6a (bWP= −0.997, bN4= +0.419). What this decomposition (Fig. 6b) suggests is that between the 1920s and 1980s, the modest drying effect of warming in the WP and the modest wetting effect of warming in the Niño 4 region more or less canceled each other out, resulting in little change in the re-gression estimates shown in Fig. 6a. This may have changed in the 1990s, as the WP warming accelerated and the high WP sensitivity led to rapid declines in the estimated WP-related EA SPI (Fig. 6b). The 1990–2014 SPI increases asso-ciated with Niño 4 warming (Fig. 6b), however, have not kept pace, both because of the lower Niño 4 sensitivity, and be-cause Niño 4 warming has stalled since the beginning of the post-1998 hiatus (England et al., 2014; Meehl et al., 2013). While both the WP and Niño 4 regions have warmed, produc-ing a dryproduc-ing (wettproduc-ing) effect through the negative (positive) influence of the WP (Niño 4) regions, the overall drying ef-fect of the WP warming (based on our regression) appears to have been greater.
We next examine the relationship between WP SST and the effects of radiative forcing, as represented by a CMIP5 ensemble. Figure 6c shows the smoothed observed WP SST
time series and the multimodel ensemble mean WP SST time series from the CMIP5 models listed in Table 1. The CMIP5 ensemble means were calculated by averaging across all available simulations. The smoothed time series track closely (r=0.89,p=0.01, based on 7 DOF). Note that there are “decadal” variations in the radiatively forced CMIP5 SSTs. These fluctuations are caused by the warming im-pacts of greenhouse gases, changes in solar insolation, and the cooling effects of aerosols and volcanic eruptions. Be-cause we have averaged across a large number of simula-tions, any internal ENSO or PDV signal has been greatly di-minished. The CMIP5 WP SST increases in the 1930s and 1940s, stabilizes in the 1950s, cools for a brief period in the 1960s, and increases at an accelerated rate since about 1980. These decadal fluctuations match reasonably well with changes seen in the observed SST, except for an observed SST increase in the early 1950s.
[image:10.612.129.467.67.347.2]“internal” variations associated with natural climate variabil-ity should be greatly diminished in the CMIP ensemble mean time series. Nonetheless, we see large swings in CMIP WP SST that are caused by changes in radiative forcing. Over-all, the detrended radiatively forced CMIP5 WP ensemble SST (dashed blue line, Fig. 6d) correspond closely (r=0.69,
p=0.04, based on 7 DOF) with the residuals from a linear fit to the observed data (solid red line, Fig. 6d). This correspon-dence suggests that much of the observed decadal and longer variation around a linear fit to the WP SST data is due to external radiative forcing, especially over the past 30 years. New research has highlighted the important climate impacts associated with the first principal component of detrended SST (Lyon et al., 2013); Fig. 6d suggests that these detrended SSTs are likely to have substantial decadal variations influ-enced by changes in greenhouse gasses, aerosols and insola-tion. Thus, our results suggest that Western Pacific PDV is largely driven by changes in radiative forcing.
4 Summary
Building on recent diagnostic studies, this paper has explored the utility of two simple SST indices related to the first two principal components of East African spring rainfall. Inter-estingly, the two principal component modes were found to relate to the WPG and CIO, as identified in prior FEWS NET research focusing on warm pool (Hoell and Funk, 2013a, b; Liebmann et al., 2014; Williams and Funk, 2011) and cen-tral Indian Ocean (Funk et al., 2005, 2008) warming. In this study, warming in the WP and cooling in the Niño 4 re-gion was related to rainfall deficits across much of the east-ern Horn of Africa (lower PC1 values; Fig. 1d). Warming in the CIO was related to declines in Tanzania and the north-eastern Horn (lower PC2 values; Fig. 1d). Thus, warming in both the western Pacific and Indian Ocean has likely con-tributed to declines in PC1 and PC2. These SST changes, oc-curring since the mid-1980s, can be attributed to increases in anthropogenic forcing; the CMIP5 ensemble examined here produced an accurate forecast (Fig. 6c) of decadal WP SST variations (r=0.89), and WPG-based regression estimates link this warming (Fig. 6b) with substantial EA precipita-tion declines. Even the “decadal” WP variaprecipita-tions, denoted as deviations from a linear trend, are explained by the re-cent acceleration of anthropogenic warming (Fig. 6d). While PDV certainly influences Niño 4 SSTs, contributing to a hia-tus (England et al., 2014) in the Niño 4 contribution to EA rainfall as shown in Fig. 6b, these influences do not appear to dominate the recent drying tendencies, which appear to be mostly explained by the influence of the western Pacific (Hoell and Funk, 2013b) consistent with the anticorrelation between records of East African precipitation and western Pacific SST (Tierney et al., 2013). An important take-home message of the work presented here is that the high sensitiv-ity of East Africa to WP warming presents both a risk and an
opportunity. As the warm WP continues to warm we may see more frequent strong gradient events, similar to the SST con-ditions during January 2014 (Fig. 5a). Spotting these events, however, requires attention since they are typically associ-ated with relatively small SST anomalies, given that the SST variance in the western Pacific is quite low.
Facing the 21st century, we can be fairly sure that the combination of warming air temperatures, growing popu-lation, and increasing demands for food will create an en-hanced sensitivity to hydrologic extremes in East Africa. At the same time, the large-scale climate, both in observations and in CMIP5 models, seems to indicate both a strengthen-ing of the ENSO signal and the ENSO-residual Walker cir-culation (Sandeep et al., 2014). These tendencies, like the WP and Niño 4 time series shown in Fig. 6b, indicate warm-ing across the Pacific Basin. This warmwarm-ing, however, will likely appear sporadically in space and time, likely creating more intense positive or negative SST gradients. Taking ad-vantage of the predictability created by these gradients will help us adapt to climate change and our increasing demand for water. While coupled ocean–atmosphere general circula-tion forecast models provide a valuable resource, we should not expect these systems to always reproduce all the details of climate teleconnections or climate change correctly. The current generation of models struggle to accurately recreate seasonal rainfall variations over East Africa’s complex ter-rain (Mwangi et al., 2014). The simple observationally based SST indices used here provide a way of partially overcoming model limitations. More complex statistical models, tailored to East Africa’s many diverse climate regions, hybrid statisti-cally coupled model predictions (Shukla et al., 2014a, b) and mesoscale model simulations might all provide potentially better ways to build on the predictive relationships explored here.
It should be stressed, however, that statistical relation-ships can be nonstationary in nature and should be monitored closely. For example, running correlations with March–May Niño 3.4 SSTs (Funk et al., 2013) show an emerging nega-tive relationship between East African rainfall and Niño 3.4 SST. This teleconnection should be routinely monitored, if statistical models such as those proposed here are to be used for hydrologic early warning. Conditions that might indicate a weakening of the WPG teleconnection would include cli-mate shifts indicative of a weaker Walker circulation: re-duced warm pool precipitation, weaker upper-level easterly flows over the Indian Ocean, and weaker easterly trade winds over the central equatorial Pacific Ocean. If the central Pa-cific suddenly warms dramatically, WPG-induced droughts might become much less frequent.
se-curity outlooks and GHACOF projections, as illustrated in Sect. 3.4. The modest levels of skill of these forecasts far exceeds the performance of current-generation coupled fore-cast systems, which show no appreciable skill for the long rains (Mwangi et al., 2014). Coupled models do, however, make skillful forecasts over the Indian and Pacific oceans, and these forecasts can be combined with a statistically con-structed analog (CA) formulation to make skillful predictions of East African rainfall (Shukla et al., 2014a).
Once the rainy season begins, land surface conditions become an additional source of information – predictabil-ity comes from both the state of the large-scale climate and the local antecedent soil moisture conditions (Shukla et al., 2013). Land surface models (LSMs) can add sub-stantial increases in drought prediction skill by incorporat-ing the knowledge of initial hydrologic conditions (derived by forcing the models with observations of rainfall, radia-tion and air temperature through the time of forecast initial-ization) in the prediction (Shukla et al., 2013). New hydro-logic forecast systems that blend these observations with cli-mate predictions (Sheffield et al., 2013; Shukla et al., 2014b) hold forth exciting new prospects for better early warning. Shukla et al. (2014b) describe a hybrid statistically coupled model forecast system that uses coupled model Indo–Pacific SST and precipitation forecasts to assign probabilities to past seasons. WPG-like metrics are used to quantify the simi-larity between current and past climate conditions. These probabilities are then used to sample (bootstrap) the histor-ical LSM forcing archive, preferentially more often select-ing years considered similar to the current season. This type of system can incorporate both the observed soil moisture condition and seasonal forecast information, leading to more skillful midseason predictions. While it seems likely, at least under current negative PDV conditions, that East Africa will continue to face more frequent droughts, rapid advances in prediction systems may help us to mitigate their impacts.
Acknowledgements. This research was supported by the USAID Famine Early Warning Systems Network (FEWS NET), NASA SERVIR, the NASA NNH12ZDA001N IDS project Seasonal Prediction of Hydro-Climatic Extremes in the Greater Horn of Africa Under Evolving Climate Conditions and NOAA Technical Transitions grant NA11OAR4310151. We would like to thank Libby White for her thoughtful comments.
Edited by: M. Werner
References
Adler, R. F., Huffman, G. J., Chang, A., Ferraro, R., Xie, P., Janowiak, J., Rudolf, B., Schneider, U., Curtis, S., Bolvin, D., Gruber, A., Susskind, J., and Arkin, P.: The version 2 Global Precipitation Climatology Project (GPCP) monthly precipitation analysis (1979–present), J. Hydrometeorol., 4, 1147–1167, 2003. Cook, K. H. and Vizy, E. K.: Projected Changes in East African
Rainy Seasons, J. Climate, 26, 5931–5948, 2013.
England, M. H., McGregor, S., Spence, P., Meehl, G. A., Timmer-mann, A., Cai, W., Gupta, A. S., McPhaden, M. J., Purich, A., and Santoso, A.: Recent intensification of wind-driven circula-tion in the Pacific and the ongoing warming hiatus, Nat. Clim. Change, 4, 222–227, 2014.
Folkins, I. and Braun, C.: Tropical rainfall and boundary layer moist entropy, J. Climate, 16, 1807–1820, 2003.
Funk, C.: Exceptional warming in the Western Pacific-Indian Ocean Warm Pool has contributed to more frequent droughts in Eastern Africa, B. Am. Meteorol. Soc., 7, 1049–1051, 2012.
Funk, C., Asfaw, A., Steffen, P., Senay, G. B., Rowland, J., and Verdin, J. P.: Estimating Meher crop production using rainfall in the ’Long Cycle’ region of Ethiopia, FEWS NET Rpecial Report, FEWS, Washington, D.C., 2003.
Funk, C., Senay, G., Asfaw, A., Verdin, J., Rowland, J., Michaelson, J., Eilerts, G., Korecha, D., and Choularton, R.: Recent drought tendencies in Ethiopia and equatorial-subtropical eastern Africa, US Agency for International Development, Washington, D.C., 2005.
Funk, C., Dettinger, M. D., Michaelsen, J. C., Verdin, J. P., Brown, M. E., Barlow, M., and Hoell, A.: Warming of the Indian Ocean threatens eastern and southern African food security but could be mitigated by agricultural development, P. Natl. Acad. Sci. USA, 105, 11081–11086, 2008.
Funk, C., Michaelsen, J., and Marshall, M.: Mapping recent decadal climate variations in precipitation and temperature across Eastern Africa and the Sahel, in: Remote Sensing of Drought: Innovative Monitoring Approaches, edited by: Wardlow, B., Anderson, M., and Verdin, J., CRC Press, Boca Raton, Florida, USA, 25 pp., 2012.
Funk, C., Husak, G., Michaelsen, J., Shukla, S., Hoell, A., Lyon, B., Hoerling, M. P., Liebmann, B., Zhang, T., Verdin, J., Galu, G., Eilerts, G., and Rowland, J.: Attribution of 2012 and 2003– 12 rainfall deficits in eastern Kenya and southern Somalia, B. Am. Meteorol. Soc., 94, 45–48, 2013.
Funk, C., Peterson, P., Landsfeld, M., Pedreros, D., Verdin, J., Row-land, J., Romero, B., Husak, G., Michaelsen, J., and Verdin, A.: A Quasi-global Precipitation Time Series for Drought Monitoring, USGS, EROS Data Center, Sioux Falls, SD, 2014.
Gill, A. E.: Some simple solutions for heat-induced tropical circu-lation, Q. J. Roy. Meteorol. Soc., 106, 447–462, 1980.
Hastenrath, S., Polzin, D., and Mutai, C.: Circulation mechanisms of Kenya rainfall anomalies, J. Climate, 24, 404–412, 2011. Hoell, A. and Funk, C.: The ENSO-Related West Pacific Sea
Sur-face Temperature Gradient, J. Climate, 26, 9545–9562, 2013a. Hoell, A. and Funk, C.: Indo-Pacific sea surface temperature
Hoell, A., Funk, C., and Barlow, M.: The regional forcing of North-ern hemisphere drought during recent warm tropical west Pa-cific Ocean La Niña events, Clim. Dynam., 42, 3289–3311, doi:10.1007/s00382-013-1799-4, 2013.
Indeje, M., Semazzi, F. H., and Ogallo, L. J.: ENSO signals in East African rainfall seasons, Int. J. Climatol., 20, 19–46, 2000. Jury, M. R.: Ethiopian decadal climate variability, Theor. Appl.
Cli-matol., 101, 29–40, 2010.
Jury, M. R. and Funk, C.: Climatic trends over Ethiopia: re-gional signals and drivers, Int. J. Climatol., 33, 1924–1935, doi:10.1002/joc.3560, 2013.
L’Heureux, M. L., Lee, S., and Lyon, B.: Recent multidecadal strengthening of the Walker circulation across the tropical Pa-cific, Nat. Clim. Change, 3, 571–576, doi:10.1038/nclimate1840, 2013.
Liebmann, B., Hoerling, M. P., Funk, C., Bladé, I., Dole, R. M., Al-lured, D., Pegion, P., and Eischeid, J. K.: Understanding Eastern Horn of Africa Rainfall Variability and Change, J. Climate, in review, 2013.
Liebmann, B., Hoerling, M. P., Funk, C., Bladé, I., Dole, R. M., Allured, D., Quan, X., Pegion, P., and Eischeid, J. K.: Un-derstanding Recent Eastern Horn of Africa Rainfall Variability and Change, J. Climate, 27, 8630–8645, doi:10.1175/JCLI-D-13-00714.1, 2014.
Lindzen, R. S. and Nigam, S.: On the role of sea surface temper-ature gradients in forcing Low-Level winds and convergence in the tropics, J. Atmos. Sci., 44, 2418–2436, 1987.
Lyon, B. and DeWitt, D. G.: A recent and abrupt decline in the East African long rains, Geophys. Res. Lett., 39, L02702, doi:10.1029/2011gl050337, 2012.
Lyon, B., Barnston, A. G., and DeWitt, D. G.: Tropical pacific forc-ing of a 1998–1999 climate shift: observational analysis and cli-mate model results for the boreal spring season, Clim. Dynam., 43, 893–909, 2013.
McKee, T. B., Doesken, N. J., and Kleist, J.: The relationship of drought frequency and duration to time scales, Proceedings of the 8th Conference on Applied Climatology, Anaheim, CA, 179– 183, 1993.
Meehl, G. A., Hu, A., Arblaster, J. M., Fasullo, J., and Trenberth, K. E.: Externally Forced and Internally Generated Decadal Climate Variability Associated with the Interdecadal Pacific Oscillation, J. Climate, 26, 7298–7310, 2013.
Mwangi, E., Wetterhall, F., Dutra, E., Di Giuseppe, F., and Pap-penberger, F.: Forecasting droughts in East Africa, Hydrol. Earth Syst. Sci., 18, 611–620, doi:10.5194/hess-18-611-2014, 2014. Nicholson, S. E.: The Predictability of Rainfall over the Greater
Horn of Africa, Part I: Prediction of Seasonal Rainfall, J. Hydrometeorol., 15, 1011–1027, doi:10.1175/JHM-D-13-062.1, 2014a.
Nicholson, S. E.: A detailed look at the recent drought situation in the Greater Horn of Africa, J. Arid Environ., 103, 71–79, 2014b. Nicholson, S. E. and Kim, J.: The relationship of the El Nino-Southern oscillation to African rainfall, Int. J. Climatol., 17, 117– 135, 1997.
Nicholson, S. E. and Selato, J. C.: The influence of La Nina on African rainfall, Int. J. Climatol., 20, 1761–1776, 2000. Ogallo, L. J.: Relationships between seasonal rainfall in East
Africa and the Southern Oscillation, Int. J. Climatol., 8, 31-43, doi:10.1002/joc.3370080104, 1988.
Omondi, P. A. O., Awange, J. L., Forootan, E., Ogallo, L. A., Barak-iza, R., Girmaw, G. B., Fesseha, I., Kululetera, V., Kilembe, C., and Mbati, M. M.: Changes in temperature and precipitation ex-tremes over the Greater Horn of Africa region from 1961 to 2010, Int. J. Climatol., 34, 1262–1277, 2013.
Pohl, B. and Camberlin, P.: Influence of the Madden–Julian Oscil-lation on East African rainfall, I: Intraseasonal variability and re-gional dependency, Q. J. Roy. Meteorol. Soc., 132, 2521–2539, 2006.
Pricope, N. G., Husak, G., Lopez-Carr, D., Funk, C., and Michaelsen, J.: The climate-population nexus in the East African Horn: Emerging degradation trends in rangeland and pastoral livelihood zones, Global Environ. Change, 23, 1525–1541, 2013. Saji, N. H., Goswami, B. N., Vinayachandran, P. N., and Yamagata, T.: A dipole mode in the tropical Indian Ocean, Nature, 401, 360– 363, 1999.
Sandeep, S., Stordal, F., Sardeshmukh, P. D., and Compo, G. P.: Pacific Walker Circulation variability in coupled and uncoupled climate models, Clim. Dynam., 43, 103–117, 2014.
Schneider, U., Becker, A., Finger, P., Meyer-Christoffer, A., Ziese, M., and Rudolf, B.: GPCC’s new land surface precipitation cli-matology based on quality-controlled in situ data and its role in quantifying the global water cycle, Theor. Appl. Climatol., 115, 15–40, doi:10.1007/s00704-013-0860-x, 2013.
Sheffield, J., Wood, E. F., Chaney, N., Guan, K., Sadri, S., Yuan, X., Olang, L., Amani, A., Ali, A., and Demuth, S.: A Drought Moni-toring and Forecasting System for Sub-Sahara African Water Re-sources and Food Security, B. Am. Meteorol. Soc., 95, 861–882, doi:10.1175/BAMS-D-12-00124.1, 2013.
Shukla, S., Sheffield, J., Wood, E. F., and Lettenmaier, D. P.: On the sources of global land surface hydrologic predictability, Hy-drol. Earth Syst. Sci., 17, 2781–2796, doi:10.5194/hess-17-2781-2013, 2013.
Shukla, S., Funk, C., and Hoell, A.: Using constructed analogs to improve the skill of March-April-May precipitation fore-casts in equatorial East Africa, Environ. Res. Lett., 9, 094009, doi:10.1088/1748-9326/9/9/094009, 2014a.
Shukla, S., McNally, A., Husak, G., and Funk, C.: A sea-sonal agricultural drought forecast system for food-insecure re-gions of East Africa, Hydrol. Earth Syst. Sci., 18, 3907–3921, doi:10.5194/hess-18-3907-2014, 2014b.
Smith, T. M., Reynolds, R. W., Peterson, T. C., and Lawrimore, J.: Improvements to NOAA’s Historical Merged Land–Ocean Sur-face Temperature Analysis (1880–2006), J. Climate, 21, 2283– 2296, doi:10.1175/2007jcli2100.1, 2008.
Taylor, K. E., Stouffer, R. J., and Meehl, G. A.: An Overview of CMIP5 and the Experiment Design, B. Am. Meteorol. Soc., 93, 485–498, doi:10.1175/bams-d-11-00094.1, 2011.
Tierney, J., Smerdon, J., Anchukaitis, K., and Seager, R.: Multi-decadal variability in East African hydroclimate controlled by the Indian Ocean Peer reviewed article, Nature, 493, 389–392, 2013.
Verdin, J., Funk, C., Senay, G., and Choularton, R.: Climate science and famine early warning, Philos. T. Roy. Soc. B, 360, 2155– 2168, 2005.
Viste, E., Korecha, D., and Sorteberg, A.: Recent drought and pre-cipitation tendencies in Ethiopia, Theor. Appl. Climatol., 112, 535–551, doi:10.1007/s00704-012-0746-3, 2012.
Williams, P. and Funk, C.: A westward extension of the warm pool leads to a westward extension of the Walker circula-tion, drying eastern Africa, Clim. Dynam., 37, 2417–2435, doi:10.1007/s00382-010-0984-y, 2011.