https://doi.org/10.5194/hess-21-5953-2017 © Author(s) 2017. This work is distributed under the Creative Commons Attribution 4.0 License.
A multi-tracer approach to constraining artesian groundwater
discharge into an alluvial aquifer
Charlotte P. Iverach1,2,3, Dioni I. Cendón1,2,3, Karina T. Meredith3, Klaus M. Wilcken3, Stuart I. Hankin3, Martin S. Andersen1,4, and Bryce F. J. Kelly1,2
1Connected Waters Initiative Research Centre, UNSW Sydney, Sydney, NSW 2052, Australia
2School of Biological, Earth and Environmental Sciences, UNSW Sydney, Sydney, NSW 2052, Australia 3Australian Nuclear Science and Technology Organisation, New Illawarra Rd, Lucas Heights,
NSW 2234, Australia
4School of Civil and Environmental Engineering, UNSW Sydney, Sydney, NSW 2052, Australia
Correspondence to:Bryce F. J. Kelly (bryce.kelly@unsw.edu.au) Received: 8 June 2017 – Discussion started: 21 June 2017
Revised: 22 October 2017 – Accepted: 23 October 2017 – Published: 28 November 2017
Abstract. Understanding pathways of recharge to alluvial aquifers is important for maintaining sustainable access to groundwater resources. Water balance modelling is often used to proportion recharge components and guide sustain-able groundwater allocations. However, it is not common practice to use hydrochemical evidence to inform and con-strain these models. Here we compare geochemical versus water balance model estimates of artesian discharge into an alluvial aquifer, and demonstrate why multi-tracer geochem-ical analyses should be used as a critgeochem-ical component of water budget assessments. We selected a site in Australia where the Great Artesian Basin (GAB), the largest artesian basin in the world, discharges into the Lower Namoi Alluvium (LNA), an extensively modelled aquifer, to convey the util-ity of our approach. Water stable isotopes (δ18O and δ2H) and the concentrations of Na+and HCO−3 suggest a contin-uum of mixing in the alluvial aquifer between the GAB (arte-sian component) and surface recharge, whilst isotopic tracers (3H,14C, and36Cl) indicate that the alluvial groundwater is a mixture of groundwaters with residence times of < 70 years and groundwater that is potentially hundreds of thousands of years old, which is consistent with that of the GAB. In ad-dition, Cl−concentrations provide a means to calculate a per-centage estimate of the artesian contribution to the alluvial groundwater. In some locations, an artesian contribution of up to 70 % is evident from the geochemical analyses, a find-ing that contrasts with previous regional-scale water balance modelling estimates that attributed 22 % of all inflow for the
corresponding zone within the LNA to GAB discharge. Our results show that hydrochemical investigations need to be un-dertaken as part of developing the conceptual framework of a catchment water balance model, as they can improve our un-derstanding of recharge pathways and better constrain arte-sian discharge to an alluvial aquifer.
1 Introduction
to accurately proportion contributions from various sources to an alluvial aquifer and to guide water allocations.
Water balance modelling of alluvial aquifers is commonly used to quantify and proportion recharge inputs from river leakage, floodwaters, areal (diffuse recharge), and discharge from artesian sources (Anderson and Woessner, 1992; Mid-dlemis et al., 2000; Zhang et al., 2002; Dawes et al., 2004; Barnett et al., 2012; Giambastiani et al., 2012; Hocking and Kelly, 2016). Historically, hydrochemical analyses are not often used to constrain catchment-scale water balance mod-elling (Reilly and Harbaugh, 2004; Barnett et al., 2012), de-spite Scanlon et al. (2002) highlighting the need to use mul-tiple techniques (including hydrochemical insights) to in-crease the reliability of recharge and discharge estimates. Geochemical data can improve our understanding of ground-water mixing processes because of the potential to trace pathways of groundwater movement and water–rock interac-tions, whilst also providing insights into the impacts of past groundwater extractions (Edmunds, 2009; Martinez et al., 2017). Therefore, the integration of geochemical evidence to constrain aquifer water balance models provides a more rig-orous approach for proportioning input sources for ground-water that has mixed origins (Raiber et al., 2015; Currell et al., 2017).
Radioactive isotopic tracers that provide insights into groundwater residence times can constrain mechanisms of recharge and discharge, and detect groundwater mixing. Isotopes of dissolved species can be useful for elucidat-ing groundwater mixelucidat-ing provided the different sources of groundwater have distinctly different and consistent isotopic signatures. However, each tracer has a different half-life and both physical and chemical processes and calculation as-sumptions can affect the interpretation of groundwater res-idence times (Jasechko, 2016). Therefore, multiple tracers are useful for covering the relevant timescales and uncer-tainties associated with the large range of groundwater res-idence times. Tritium (3H) is an excellent indicator of mod-ern recharge inputs in shallow groundwater (Robertson and Cherry, 1989; Chen et al., 2006; Duvert et al., 2016), and provides valuable information on processes active in the past∼70 years. Carbon-14 (14C) is used to understand pro-cesses active from modern to∼30 ka (Clark and Fritz, 1997; Cartwright et al., 2010; Cendón et al., 2014) and chlorine-36 (36Cl), whilst applicable in modern groundwater (Tosaki et al., 2007), is usually reserved for the identification of much older groundwater (100 ka to 1 Ma). One of the challenges of using 36Cl is that, in certain cases, nucleogenic production of 36Cl can be significant and/or varying Cl concentrations can complicate groundwater residence time interpretations. Additionally, the interpretation of36Cl can be affected by the input function, as36Cl values from rainfall vary temporally. This means that the input function for rainfall from any time in the past may be different from current conditions (Phillips, 2000). However, in regions with low and fairly consistent Cl concentrations (such as in our study area), 36Cl values can
provide solid indications of old groundwater residence times (Mahara et al., 2007).
These isotopes can also be used for tracer mixing calcu-lations independent of residence time estimations (Bentley et al., 1986; Andrews and Fontes, 1993; Love et al., 2000; Moya et al., 2016). Therefore, the combination of3H,14C, and36Cl dating techniques can provide hydrochemical pro-cess insights that cannot be captured by using only one iso-tope.
Identification of recharge and discharge pathways (partic-ularly from underlying artesian contributions), and propor-tioning their relative contributions in a groundwater sample can be better constrained by combining traditional geochem-ical data with multiple dating techniques and other hydro-logic analyses (Amiri et al., 2016; Rawling and Newton, 2016; Schilling et al., 2017). This is because groundwater geochemical data give insights into long-term patterns of mixing and groundwater flow, whereas other hydrologic data (such as hydraulic head differences) provide insights into seasonal pumping impacts, and current local and catchment-scale groundwater flow paths.
Here, we present for the first time a multi-tracer approach to constraining artesian discharge from the Great Artesian Basin (GAB) into the Lower Namoi Alluvium (LNA), north-west New South Wales (NSW), Australia (Fig. 1). We use water stable isotopes and major ion data to assess the major recharge and discharge pathways and occurrences of ground-water mixing in the LNA. We also use3H, 14C, and 36Cl to show that artesian discharge from the underlying GAB to the LNA is locally much higher than is currently estimated from water balance models used to guide groundwater al-locations in the region (Lower Namoi Groundwater, 2008). Our results highlight the need to consider a multi-tracer geo-chemical approach when assessing artesian contributions to alluvial aquifers and constraining water balance models of alluvial systems globally.
2 Study area
ing plan in 2006, which systematically reduced groundwa-ter allocations to the irrigation sector over a 10-year period. The present allocation is 86×106m3year−1(Lower Namoi Groundwater, 2008).
2.1 Hydrogeological setting
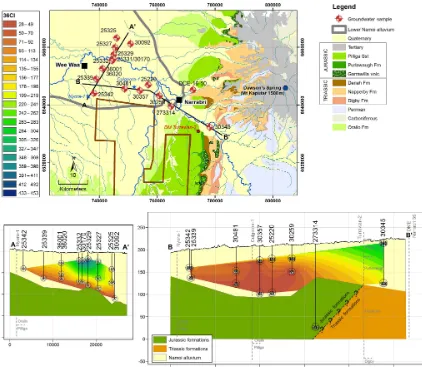
The Lower Namoi River catchment lies within the Murray– Darling Basin, overlying the Coonamble Embayment, which is in the south-east portion of the GAB (Radke et al., 2000). The southernmost portion of the LNA is underlain by Trias-sic formations, while north-west of monitoring bore 30345 the LNA is underlain by Jurassic formations (Fig. 2). Within the region of study, the oldest outcropping bedrock formation is the Early Triassic Digby Formation (lithic and quartz con-glomerates, sandstones, and minor finer grained sediments; Tadros, 1993). The Digby Formation outcrops in the south-east of the area and the Namoi River abuts the formation just south of B’ in Fig. 2. The Digby Formation is overlain by the Triassic Napperby Formation (thinly bedded claystone, silt-stones, and sandstone). This formation occurs at a depth of 106 m, just below the base of monitoring bore 30345 (NSW Pinneena Groundwater Database, driller logs). In outcrops to the east of the study area, the Napperby Formation is overlain by the Late Triassic Deriah Formation (green lithic sandstone rich in volcanic fragments and mud clasts; Tadros, 1993). The boundary between the Triassic and Jurassic lies west of monitoring bore 30345. The Jurassic formations important to this study are the Purlawaugh Formation (carbonaceous claystone, siltstone, sandstone and subordinate coal), Pilliga Sandstone (medium to coarse quartzose sandstone) and the Orallo Formation (clayey to quartzose sandstone, subordi-nate siltstone and conglomerate; Tadros, 1993). The Pilliga Sandstone forms the bedrock below monitoring bores 25325 to 25342, and in the Namoi region is the primary aquifer of the GAB.
From the Late Cretaceous to the mid-Miocene, a paleo-valley was carved through the basement rocks (Kelly et al., 2014). Then from the mid-Miocene until present, the paleo-valley was filled with reworked alluvial sediments. Ground-water abstraction in the study area is mostly from these alluvial sediments. Fluvial and aeolian interbedded clays, silts, sands, and gravels form the up to ∼140 m thick al-luvial sequence of the Lower Namoi Catchment (Williams et al., 1989). Traditionally, three main non-formally defined aquifers/formations have been used to describe the LNA. The semi-confined Cubbaroo Formation overlies the bedrock in the northern paleochannel (which passes beneath monitoring bores 25325 and 30092). This formation is up to 60 m thick. The Cubbaroo Formation is overlain by the semi-confined Gunnedah Formation, which is up to 80 m thick, and is con-formably overlain by the unconfined Narrabri Formation, which is 10 to 40 m thick (Williams et al., 1989). How-ever, recent studies in the Namoi Catchment suggest that the rigid subdivision in to the Narrabri, Gunnedah, and
Cubba-roo formations cannot easily explain the continuum in chem-ical evolution observed (discussed further below) and that the valley filling sequence is better characterised as a distributive fluvial system (Kelly et al., 2014; Acworth et al., 2015).
Groundwater drains from the Upper Namoi into the LNA via a bedrock constriction north of Narrabri and generally flows from east to west within the LNA (Barrett, 2012). Hy-draulic conductivity in the alluvial aquifer is highly variable (0.008–31 m day−1) due to the presence of variable sand and clay (Golder Associates, 2010). However, hydraulic conduc-tivity generally increases with depth.
2.2 Current understanding of recharge and discharge processes in the Lower Namoi Alluvium
There have been numerous catchment water balance models and hydrochemical investigations in the study area because of the local and national economic importance of the LNA. However, the hydrochemistry of the groundwater in the re-gion has not been used in conjunction with water balance modelling prior to this study (Merrick, 2000; CSIRO, 2007; Kelly et al., 2007).
2.2.1 Water balance modelling of recharge
Figure 2.A geological map of the study area and two cross sections through the study area, showing the location and depth of the samples in the alluvium and their proximity to formations of the GAB. Contacts obtained from gas wells Nyora-1, Culgoora-1, and Turrawan-2, coinciding with our cross sections are added. Their locations are displayed on the map. The general direction of groundwater flow is from SE to NW, aligning with the B–B’ line on the map. The36Cl data interpolated using the “natural neighbours” algorithm is shown in each cross section.
2.2.2 Hydrochemical estimates of recharge
The first isotopic investigation in the area was conducted from 1968 to 1975 and partially published by Calf (1978). The author used14C and3H to assess recharge pathways to the LNA and found evidence for river recharge in the upper aquifer, and that modern groundwater penetrated the deeper parts of the LNA. Calf (1978) also found evidence for “leak-age” of groundwater from the GAB up into the deeper LNA; however, volumetric estimates were not provided.
McLean (2003) conducted an extensive hydrochemical and isotopic characterisation of both the GAB groundwater and the alluvial groundwater in 1999–2000. This research concluded that mixing of groundwater from the GAB into the lower and middle parts of the LNA is an important pro-cess especially in the south of the catchment. This study also
did not quantify the amount of mixing occurring between the two groundwater sources.
3 Materials and methods 3.1 Groundwater collection
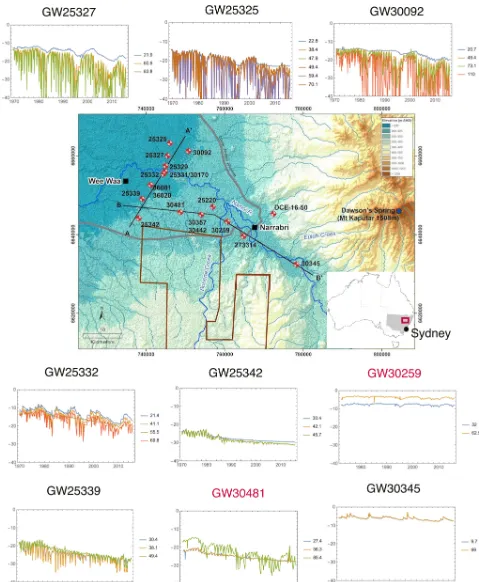
This study comprised two field campaigns, the first one from 28 January to 8 February 2016 (summer) when the aquifer was stressed by pumping for irrigation, and the second from 21 June to 30 June 2016 (winter) in the absence of abstraction for irrigation.
In summer, 28 groundwater samples were collected from NSW Department of Primary Industries Water (DPI Water) monitoring bores and a surface water sample from the Namoi River. In winter, 16 groundwater samples were collected from NSW DPI Water monitoring bores and surface water samples from the Namoi River and two upstream tributaries (see Supplement Table S2 for locations). The bores were screened at varying intervals (average length of screened in-terval: 5.6 m, see Table S2 for individual bores), intersect-ing the shallow, middle, and deep alluvium. Most bores were sampled with either a Grundfos (MP1 sampling pump) or Bennett compressed air piston pump, with the pump placed ∼1 m above the screen when using the Grundfos pump. Drop-tube extensions were used with the Bennett pump to place the pump intake just above the screen. Some deep mon-itoring bores were sampled with a portable bladder pump us-ing low-flow methods (Puls and Barcelona, 1996). In these bores the pump was placed approximately 10 m below stand-ing water level, with a drop tube cut to place the pump in-take within the screen. For shallower bores (less than 50 m), a 12 V battery operated pump was used with the pump intake placed∼1 m above the screen. For all sample sites, physico-chemical parameters (pH, DO, EC) were monitored and sam-ples collected once three well volumes had been pumped and/or the physico-chemical parameters stabilised. This was generally achieved within 1 to 3 h after onset of pumping. Sample collection involved an in-line, 0.45 µm, high-volume filter connected to a high-density polyethylene (HDPE) tube. Total alkalinity concentrations (field alkalinity) were deter-mined in the field by acid titration using a HACH digital titrator and external pH meter control. The Fe2+ and HS− concentrations were determined using a portable colorimeter (HACH DR/890).
Samples for anion and water stable isotope (δ2H andδ18O) analyses were collected in 60 and 30 mL HDPE bottles re-spectively with no further treatment. Samples for cation anal-ysis were collected in 60 mL HDPE bottles and acidified with ultrapure nitric acid. Samples for14C and3H were collected in 1 L narrow-mouth HDPE bottles and 2 L HDPE bottles respectively, and were sealed with tape to avoid potential at-mospheric exchange during storage. Samples for36Cl were collected in 1 L narrow-mouth HDPE bottles with no further treatment. Major ion and 14C samples were refrigerated at 4◦C until analysed.
We were not able to access any previously sampled GAB bores within the study area. Thus, to better constrain GAB
groundwater characteristics, we used geochemical data from known GAB bores collected by Radke et al. (2000) and McLean (2003). These data were collected to the north-west of our study area and are used as a range (depending on avail-ability of the original reported data) for the GAB endmember in our discussions (Table S1).
To help in the description of results, we use shallow (< 30 m), intermediate (30–80 m), and deep (> 80 m) as a rough guide to the origin of the groundwater sample. The chosen depth categories are based on clusters and trends in the14C analyses.
3.2 Geochemical analyses
Groundwater samples from both campaigns were analysed at ANSTO by inductively coupled plasma atomic emission spectroscopy (ICP-AES) for cations and ion chromatography (IC) for anions. Samples forδ2H andδ18O were analysed using cavity ring-down spectroscopy (CRDS) on a Picarro L2130-ianalyser. These values are reported as per mille de-viations from the international standard V-SMOW (Vienna Standard Mean Ocean Water) and results have a precision of ±1 ‰ forδ2H and±0.15 ‰ forδ18O.
The14C samples were processed and analysed at ANSTO using methods described in Cendón et al. (2014). The14C activities were measured by accelerator mass spectrometry (AMS) using the ANSTO 2MV tandetron accelerator, STAR (Fink et al., 2004). The14C results were reported as percent modern carbon (pmc) following groundwater14C reporting criteria (Mook and van der Plicht, 1999; Plummer and Glynn, 2013) with an average 1σerror of 0.21 pmc.
The3H samples were analysed at ANSTO. Water samples were distilled and electrolytically enriched prior to analysis by liquid scintillation. The3H concentrations were expressed in tritium units (TU) with a combined standard uncertainty of ±0.03 TU and quantification limit of 0.04 TU. Tritium was measured by counting beta decay in a liquid scintillation counter (LSC). A 10 mL sample aliquot was mixed with the scintillation cocktail that releases a photon when struck by a beta particle. Photomultiplier tubes in the counter convert the photons to electrical pulses that are counted over 51 cy-cles for 20 min.
The 36Cl/Cl and 36Cl/37Cl ratios were measured by AMS using the ANSTO 6MV SIRIUS Tandem Acceler-ator (Wilcken et al., 2017). Samples were processed in batches of 10, with each batch containing 1 chemistry blank. The amount of sample used was selected to yield ∼5 mg of Cl for analysis without carrier addition. Chloride was re-covered from the sample solutions by precipitation of AgCl from hot solution (Stone et al., 1996). This AgCl was re-dissolved in aqueous NH3(20–22 wt %, IQ grade, Seastar) to
remove sulfur compounds of Ag. Owing to isobaric interfer-ence of36S with36Cl in the AMS measurements, a saturated Ba(NO3)2solution (99.999 % trace metal basis) was used to
BaSO4 to settle from a cold solution (4◦C) in the dark
be-fore removal of the supernatant by pipetting and filtration (0.22 Millex GS). Pure AgCl was re-precipitated by acid-ifying the Ag (NH3)2-Cl solution with 5M nitric acid (IQ
Seastar, sub-boiled). Finally, AgCl was recovered, washed twice, and dried. It was then pressed into high-purity AgBr (99 % trace metal basis, Aldrich) in 6 mm diameter Cu tar-get holders. AgBr has a much lower sulfur content than Cu. The stable Cl isotopes 35Cl and 37Cl were measured with Faraday cups, and 36Cl events were counted with a multi-anode gas ionisation chamber. Gas (Ar) stripping (for good brightness/low-ion straggling) the ions to 5+ charge state in the accelerator terminal suffices for effective 36S inter-ference separation in the ionisation chamber combined with sample-efficient and rapid analysis. Purdue PRIMELab Z93-0005 (nominally 1.20×10⁻¹² 36Cl/Cl) was used for nor-malisation with a secondary standard (nominally 5.0×10⁻¹³
36Cl/Cl; Sharma et al., 1990) used for monitoring.
Back-ground subtraction was done with a linear dependence be-tween36Cl rate and interfering36S rate. This dependency is established by combining all the blank and test sample mea-surements and applied to the unknown samples during of-fline data analysis. This correction factor was typically less than analytical uncertainty of 3–4 % bar one sample that had a correction factor of 12 % with an analytical uncertainty of 6 %.
3.3 Geochemical calculations
Calculations necessary to assess electrical neutrality, dis-solved element speciation, and saturation indices for com-mon mineral phases were undertaken using the PHREEQC Interactive program (3.3.8; Parkhurst and Appelo, 1999) and the incorporated WATEQ4F thermodynamic database (Ball and Nordstrom, 1991). The cation and anion analyses were assessed for accuracy by evaluating the charge balance er-ror percentage (CBE %). All samples fell within the accept-able±5 % range, except for samples 25327-1 (−7.8 %) and 36001-1 (−5.8 %). The inverse geochemical modelling code NEPATH XL (Plummer et al., 1994; Parkhurst and Charlton, 2008) has been used to calculate the mixing ratio between two endmembers, using their Cl concentrations. The choice of endmembers will influence calculated proportions; how-ever, endmembers were selected to provide conservative ap-proximations.
Despite limitations,36Cl residence times for selected low
36Cl/Cl samples were calculated from the equations of
Bentley et al. (1986). This allows a direct comparison, un-der similar assumptions, with other estimates obtained from GAB groundwater elsewhere (Bentley et al., 1986; Radke et al., 2000; Love et al., 2000; Moya et al., 2016) and within the Coonamble Embayment (Radke et al., 2000; Mahara et al., 2007). These calculations assume a piston flow setting with no other sources or sinks besides recharge and natural
decay (Eq. 1):
t= −1
λ36
lnR−Rse
R0−Rse
, (1)
whereR is36Cl/Cl ratio measured in the sample,R0is the
initial36Cl/Cl ratio (meteoric water),Rseis the36Cl/Cl
ra-tio under secular equilibrium (in this case the36Cl/Cl ratio from the Pilliga Sandstone), and λ36 is the decay constant
(2.303×10⁻⁶). We used aR0value of 160 (×10−15), which
was an average of 10 samples compiled from studies in the Coonamble Embayment and reported in Radke et al. (2000). ForRse a value of 5.7 (×10−15)was used, which is
appro-priate for aquifers dominated by sandstone (this secular equi-librium value can vary according to the dominant lithology). ThisRsevalue has been applied to36Cl/Cl calculations
else-where in the GAB (Moya et al., 2016) and is similar to that calculated from drill-core samples recovered in the GAB by Mahara et al. (2009).
4 Results
4.1 Major ion chemistry
The groundwater of the alluvial aquifer is predomi-nantly Na-HCO3-type water, with concentrations ranging
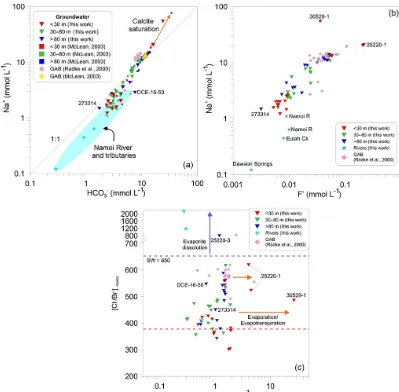
from 0.12 to 54.6 mmol L−1 (average: 6.85 mmol L−1; SD: 8.7 mmol L−1) for Na+and 0.29 to 24.0 mmol L−1(average: 6.43 mmol L−1; SD: 4.8 mmol L−1) for HCO−3 (Table S2). Generally, the highest concentrations of Na+and HCO−3 oc-cur in the deeper groundwater and decrease up the vertical groundwater profile (Fig. 3a). The concentration of these two ions in the groundwater of the LNA is higher than expected from local rainfall sources and other shallow groundwater al-luvial systems in eastern Australia (Martinez et al., 2017). In GAB groundwater, the Na:HCO3 molar ratio is generally
1:1 and the two ions are generally present in higher con-centrations than in our alluvial samples (Radke et al., 2000; McLean, 2003), which is evident in the position of the re-gional GAB samples in Fig. 3a.
Additional ions used in this study are F− and Cl− as well as the Cl/Br ratio. The concentration of F− in the groundwater ranges from 0.002 to 0.215 mmol L−1(average: 0.028 mmol L−1; SD: 0.04 mmol L−1). Fluoride concentra-tions generally increase with depth and accumulate in solu-tion as all groundwater samples are below saturasolu-tion with respect to fluorite (Fig. 3b). Concentrations of Cl−in the
slightly lower than ratios observed in other GAB samples for Australian locations (Herczeg et al., 1991; Cendón et al., 2010; Cartwright et al., 2010). Additionally, the Cl/Br ratios in shallow samples connected to the river are consistent with expected ratios in rainfall (Short et al., 2017). The regional GAB samples (Radke et al., 2000) show a Cl/Br ratio more similar to seawater, with our samples from the LNA lying on a mixing trend between the two endmembers (Fig. 3c).
We identified one major outlier in the hydrochemical results, which was sample 273314. This sample is from 207 m b.g.s. and the bore screen is classified as being in the GAB. However, the geochemical parameters for this deep GAB sample have a signature more similar to river water than what would be expected in the GAB 207 m b.g.s. The concentration of Na+, HCO−3, and Cl−, F− as well as the Cl/Br ratio in this sample plot closer to the river and shallow groundwater than the deeper groundwater system (Fig. 3). Potential reasons for this are explored in detail below.
4.2 Stable water isotopes (δ2H andδ18O)
The stable water isotopic values for this study range from −0.76 to 8.4 ‰ for δ18O and −7.5 to −54.9 ‰ for δ2H. Most groundwater samples cluster together at around−6 and −40 ‰ (δ18O andδ2H) and lie on the global meteoric water line (GMWL), to the right of the nearest available local mete-oric water lines (LMWL; Macquarie Marshes and Gunnedah; Fig. 4; Table S3). A group of mostly shallow samples col-lected from piezometers close to river channels define a trend to the right of the GMWL with a slope of 5.96, which is con-sistent with evaporation (Cendón et al., 2014). Our results are similar, including the shallow groundwater evaporative trend, to those recorded by McLean (2003). Water stable isotopic compositions for regional GAB samples range from−6.58 to −6.24 ‰ forδ18O and−43.1 to−38.8 ‰ forδ2H (McLean, 2003; Fig. 4).
4.3 Isotopic tracers (3H,14C, and36Cl)
Tritium activities vary throughout the study area, ranging from below the quantification limit (< 0.04 TU) to 2.36 TU (average: 0.42 TU). Tritium activities generally decrease with depth and distance from the river channel (Fig. 5; all data in Table S3). The highest 3H activities of 2.31 and 2.36 TU are from a sample 40 m from the river and the Namoi River itself respectively. These are very similar to modern rainfall in Australia (∼2–3 TU, Tadros et al., 2014), which suggests modern recharge near the river channels. However,
3H > 0.04 TU was measured at depth (down to 207 m b.g.s.).
The 3H activities we measured at depth are significant for Australian groundwater, as the peak of the bomb pulse in Australia was only around 60 TU compared to locations in the Northern Hemisphere. This is primarily because most thermonuclear testing was undertaken in the Northern Hemi-sphere far from Australia and mixing is limited between the
atmospheric convection cells in the Northern and Southern hemispheres. Therefore,3H in Australian rainfall has been at natural background concentrations for some time (Tadros et al., 2014).
The 14C content in the groundwater ranged from 0.2 to 107.6 pmc (average: 54.0 pmc). Generally, groundwater sam-ples shallower than 30 m had a high14C content (> 90 pmc), which decreased with depth. There were nine samples with a 14C content below 1 pmc, indicating old groundwater (> 30 ka), with total depths ranging from 35 to 207 m b.g.s.
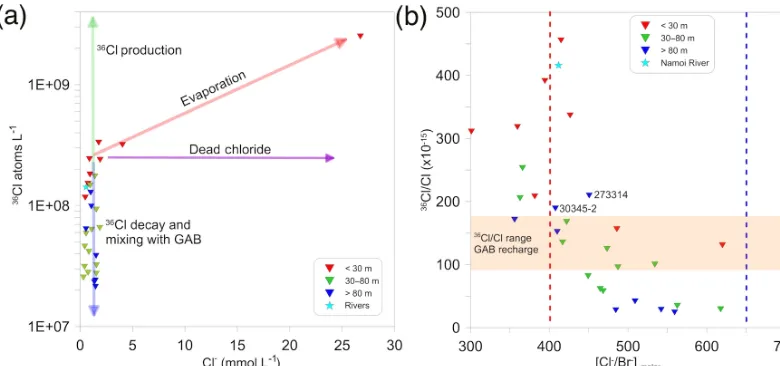
Our 36Cl results for the alluvial groundwater ranged from 24.06 (×10−15)to 455.35 (×10−15) (average: 169.4 (×10−15)(shown in the interpolation in Fig. 2). It has been found that groundwater in the GAB recharge zone closest to the study area has a 36Cl/Cl ratio up to ∼200 (×10−15)
(Radke et al., 2000) with recharge values applied in calcula-tions elsewhere in the GAB of 110 (×10−15)(Moya et al., 2016). Water from the Namoi River has a36Cl/Cl ratio of ∼420 (×10−15)(Table S4).
5 Discussion
5.1 Identification of recharge and mixing between the GAB and the LNA
Theδ18O andδ2H isotopic compositions suggest two mech-anisms of recharge to the alluvium: artesian discharge and surface water infiltration. The regional GAB samples plot within the alluvial groundwater sample range, suggesting a GAB component in the alluvium. The evaporation line in Fig. 4 indicates recharge to the alluvium via surface water infiltration. It also shows a good connection between surface water that has undergone evaporation prior to recharge.
Additional evidence for these two mechanisms of recharge is the composition of Na+and HCO−3 in the LNA. Figure 3a shows a mixing line that the alluvial samples follow, plotting between the endmembers of the GAB and the Namoi River, suggesting an increasing GAB contribution to the alluvial groundwater with depth. This also implies that a continuum of mixing exists between the shallow and deep groundwater within the LNA. The shallow samples (25220-1 and 30259-1) that are more Na+ enriched compared to samples from the GAB have undergone separate evapotranspiration pro-cesses and hence have a concurrent increase in Cl−. Assum-ing that Cl−is behaving conservatively (Appelo and Postma, 2005) we surmise that increases in dissolved major ion con-centrations concomitant with increases in Cl−in the shallow
Figure 3. (a)Na+vs. HCO−3 showing the mixing trend that the alluvial samples form between the Namoi River and samples from the GAB (Radke et al., 2000; McLean, 2003). The orange calcite saturation line indicates samples that are more enriched due to separate evapotranspiration and calcite precipitation. The shaded blue ellipse represents all river chemistry data available for the Namoi River and tributaries (this work,n=4; McLean, 2003,n=4; Mawhinney, 2011,n=79).(b)Na+vs. F−and(c)Cl−/Br−vs. Cl−, highlighting the mixing trend between the surface recharge and the GAB that we observe in other geochemical indicators. The red dotted line represents the Cl−/Br−ratio for rainfall and the blue dotted line is the seawater ratio.
tributaries and regional samples from the GAB (Radke et al., 2000), in a similar way to the Na-HCO3 trend that we
ob-serve in Fig. 3a. The Cl/Br ratios in the groundwater also support the mixing interpretation provided by the Na+and HCO−3 concentrations, contrary to the possibility of water– rock interactions along the alluvium flow path (Fig. 3c). Fur-thermore, the relationship between 36Cl and Na+ provides additional evidence of mixing in the groundwater (Supple-ment Fig. S1).
Figure 3 also highlights the deep outlying sample (273314), which was 207 m b.g.s. in total depth, yet plots with the shallow alluvial and river samples. Figure 2 shows that this sample is situated just above the Napperby
Forma-tion. We hypothesise that this sample originated from surface recharge from the Namoi River (which is in contact with the underlying Digby Formation to the south of the study area), with negligible input from the more Na-HCO3-rich
[image:9.612.99.498.65.457.2]Figure 4.Water stable isotopes in the LNA, showing the two sepa-rate mechanisms of recharge; surface water recharge plotting along an evaporation trend line and potential inflow from the GAB clus-tered with regional samples from the GAB (McLean, 2003).
Mixing between groundwaters of varying residence times
Major ion and water stable isotope data suggest two primary mechanisms of recharge to the LNA and show that mixing is occurring within the alluvium. 3H activity and14C con-tent in the alluvial groundwater quantify the pocon-tential res-idence times of the groundwater sources that are mixing within the alluvium. Tritium activities > 0.04 TU at depth (down to 207 m b.g.s.) indicate the extent of recharge from episodic flooding. Measuring 3H > 0.04 TU at these depths also shows that surface recharge reaches the deeper LNA rel-atively quickly (< 70 years). Tritium data from the 1970s col-lected from bores that were included in our sampling cam-paign (25329 and 25332; Calf, 1978) suggest that 3H was already present in the deeper parts of the alluvial aquifer (> 70 m b.g.s.) prior to a major flood in 1971, with activities ranging from 7.9 to 11.2 TU. This indicates good connectiv-ity to and recharge from the surface. Additionally, measure-ments of 3H in these bores post-flooding (16.6 to 20.7 TU) indicate that substantial recharge from the surface took place during this flood.
This highlights the importance of surface water recharge to the LNA. The activities of3H > 0.04 TU throughout the ver-tical profile of the LNA (Fig. 5) are inconsistent with the low
14C contents in the groundwater. The presence of measurable 3H but negligible14C (close to 0 pmc) suggests that mixing is
[image:10.612.319.537.66.280.2]occurring between groundwater that is associated with mod-ern recharge processes in the alluvium and groundwater that,
Figure 5.Plot of depth vs.3H, highlighting the3H activity through-out the vertical groundwater profile. Samples that fall within the pink zone on the left are below the quantification limit (< 0.04 TU). These data are not included in our interpretation of how3H changes with depth. They are presented to convey the relative proportions of interpretable versus non-interpretable data.
as indicated by the14C content, is presumably much older. This older groundwater may be derived from artesian inflow. Figure 6 shows3H activities > 0.04 TU in samples with14C content of almost 0 pmc, suggesting that groundwater with very low14C content is mixing with groundwater with high
3H activity. Even though there is evidence of 14C dilution
in localised areas, we also observe mixing between ground-waters of widely different14C and 3H values in the gradi-ent of the samples in Fig. 6 (emphasised with a dotted blue line). This gradient would be steeper if there were mixing be-tween groundwaters closer in residence times (Cartwright et al., 2013).
5.2 Extent of interaction between the GAB and the LNA
The3H and14C values show that there is mixing between groundwater of varying residence times; however, they pro-vide little constraint on the groundwaters with a14C content of close to 0 pmc (i.e. > 30 ka). This is where36Cl dating can be a useful tracer because it can be used to identify the pres-ence of groundwaters that are much older than the range pro-vided by14C.
Figure 6.3H (TU) vs.14C (pmc). This shows the mixing between groundwater with quantifiable3H activity (as indicated by the red band) and groundwater with very low14C content (as indicated by the dotted blue line).
(Fig. 2). Figure 7 shows the 36Cl/Cl value range of GAB recharge, highlighting the alluvial samples with values lower than this GAB recharge value. Calculations suggest that these particular groundwater samples are potentially hundreds of thousands of years old, which is consistent with groundwater from the GAB. This implies that these alluvial ters are influenced by artesian inflow of very old groundwa-ter. This is evident in the natural neighbour interpolation in Fig. 2.
The apparent degree of36Cl decay observed in the alluvial groundwater samples is too large to be explained simply by radioactive decay as indicated by the measurable 14C con-tent in the same samples (Phillips, 2000). This means that the time needed for the 36Cl to decay as much as observed would be well outside the range of14C dating (> 30 ka) and therefore all groundwater samples would be expected to have a14C content of 0 pmc, which is not observed. Furthermore, the decrease in 36Cl is unlikely to result from dilution by
36Cl-depleted sources such as evaporites, as the Cl−
concen-trations are similar in most samples (Fig. 8a and b). There-fore, mixing between groundwaters of different residence times is the most likely explanation for the observed 36Cl signatures.
[image:11.612.60.278.67.269.2]Our groundwater samples from the deep alluvium display lower36Cl/Cl ratios (down to 24 (×10−15))than those mea-sured in the GAB recharge zone. This indicates that there is very old groundwater in the deeper LNA (conceivably older than that of the GAB recharge zone), and that the mixing observed in our geochemical data could be taking place between groundwater with a residence time of less than 70 years (assumed using3H) and groundwater with low36Cl
Figure 7.36Cl/Cl (×10−15)vs.14C (pmc). The colour gradient represents the mixing between the two major sources: surface water recharge (blue is modern) and the GAB (brown is old). The shaded yellow ellipse encompasses the two outliers where the geochemistry is being influenced by proximity to the Napperby Formation. The shaded pink ellipse is sample 25327-3, located in the irrigation area.
Figure 8. (a)36Cl vs. Cl−concentration. The36Cl production arrow represents potential in situ36Cl production from the high U and Th content in the host rocks.(b)36Cl/Cl ratio (×10−15)vs. Cl−/Br−. The dotted blue line represents the Cl−/Br−ratio in seawater and the dotted red line represents the expected Cl−/Br−ratio for rainfall at Narrabri based on distance from the coast (Short et al., 2017).
The Cl mixing results provide an approximate mixing threshold with shallower samples generally containing a higher proportion of alluvial groundwater, which diminishes with depth. These mixing proportions show that some deeper samples in the LNA contain up to 70 % GAB groundwa-ter. Figure 9 presents approximate contours for artesian dis-charge proportions into the LNA based on the Cl mixing ap-proach. The dotted lines indicate areas where there is just one sample to inform the interpretation, whereas the solid lines connect multiple samples that all displayed similar contribu-tions from the GAB.
Artesian input can be inferred from nested piezometers at locations 30481 and 30259 (Fig. 1). At these locations, the monitoring bore slotted in the lower portion of the LNA has a head higher than the monitoring bore slotted in the shallow portion of the LNA, indicative of upward flow. At all other lo-cations artesian contributions cannot be discerned from head data. Comparing Fig. 9 to Fig. 1, we show that groundwa-ter geochemistry can provide a more accurate evaluation of GAB contribution to the LNA. This is because the geochem-ical data can elucidate groundwater mixing processes and provide longer-term insights compared to the hydraulic head data. Multiple geochemical tracers reveal that boreholes in the north and west of the study area may be experiencing much more GAB inflow than has been inferred in catchment water balance models (Merrick, 2000; Kelly et al., 2007; CSIRO, 2007). This is most evident at sample 25342. It is not immediately apparent from the vertical heads in the hydro-graph set at sample 25342 that there is any GAB inflow, yet based on the geochemical tracers this location is 100 % GAB groundwater. The water balance model described in Merrick (2000) has GAB groundwater contributing 22 % of all inflow into the LNA between Narrabri and Wee Waa (Fig. 1). From the geochemistry alone it is not possible to make an estimate
that can be directly compared to that artesian discharge esti-mate. However, it is apparent from the mixing results shown in Fig. 9 that a large portion of the study area has an arte-sian input to the LNA that is likely to be greater than 22 %. The above observations highlight why geochemical insights should ideally be used as one of the constraining data sets when doing water balance models in regions where there is both artesian discharge and surface water recharge to the al-luvial aquifer.
5.3 Temporal changes in the interaction between the LNA and the GAB
[image:12.612.103.493.67.250.2]Figure 9.Approximate percentages of GAB contribution to the LNA, calculated from multiple geochemical tracers and major ion data.
Table 1.Changes in14C content (pmc) in select boreholes in the study area between 1978 and 2016 (see Figs. 1 and 8 for the locations of the bores). The five bores in bold text highlight where we observe changes in the14C content from 1978 to this study. Where available, the season and/or year of sampling is included. ND: no data.
Bore Depth interval Calf McLean ANSTO data This study This study (m b.g.s.) (1978) (2003) (summer 2010) (summer 2016) (winter 2016)
25220/1 24.4–30.5 28.15 ND ND 69.66 69.94
25220/3 97.5–109.7 0.99 ND 0.13 0.17 0.22
25325/2 36.9–38.4 83.63 ND 85.77 86.25 ND
25325/6 67.1–70.1 65.31 ND 66.57 90.37 ND
25332/1 17.7–21 103.61 ND ND 102.48 ND 25332/2 38.1–41.1 99.19 ND 104.78 ND ND 25332/3 50.9–55.5 94.70 ND ND ND ND
25332/4 66.8–69.8 49.33 ND 84.12 73.57 ND
25327/1 18.9–21.9 123.36 101.3 (s) ND 103.43 102.74 25327/2 57.9–60.9 84.16 93.78 (s) ND 92.05 90.56
25327/3 80.8–83.8 8.48 8.63 (s) ND 25.79 56.08
30092/1 17.7–20.7 ND 90.51 (w) ND ND ND
30092/2 48.2–49.4 ND 80.06 (w) 72.31 ND 66.92
30092/4 108.2–110 ND 0.19 (w) 0.24 0.3 0.21
Most of the samples displayed relatively consistent 14C values across the years where data were available. However, we observed large changes in14C content in five monitoring bores; four showed an increase and one showed a decrease (bold text in Table 1). This suggests that the varying
[image:13.612.108.488.420.633.2]past data is useful as a preliminary indicator for the current state of the system. However, consistent data collection and incorporation of other factors that may affect groundwater mixing (such as rate of groundwater extraction and amount of surface infiltration) are necessary to make inferences about temporal changes in the interaction between the LNA and the GAB.
6 Conclusion
We have used multiple geochemical tracers to show that arte-sian discharge to a shallow alluvial aquifer is higher than pre-viously derived from water balance models in the literature (Merrick, 2000; CSIRO, 2007; Kelly et al., 2007). We have also provided a percentage estimate of GAB groundwater in each sample collected in the LNA using the concentration of Cl in the groundwater, showing that in some locations the “al-luvial” sample is comprised of up to 70 % GAB groundwater. Our findings are important when considering the global im-portance of groundwater and the sustainable use of connected alluvial and artesian systems, globally.
Isotopic tracers (3H,14C, and36Cl) indicate that there is substantial mixing between two groundwater endmembers of very different residence times (< 70 years and very old groundwater consistent with the GAB). This suggests inter-action between modern surface recharge through the shal-low LNA and variable artesian infshal-low at depth, dependent on where the sample is located in the system. We have also used past14C data (1978, 2003, 2010), along with data from this study to show that these data can be used as a preliminary indicator of how the extent of interaction between the GAB and the LNA has changed over time. Yet, how these trends change geographically throughout the system and how they will behave in the future are difficult to constrain without continuous monitoring.
In the interval of the Lower Namoi studied discharge from the GAB into the LNA was previously considered to con-tribute approximately less than 22 % of the input water to the LNA (Merrick, 2000; CSIRO, 2007; Kelly et al., 2007). However, the geochemical data reported above clearly indi-cate that GAB discharge is occurring in locations where in-flow is not apparent from the nested hydrograph data. This highlights the need to apply multiple groundwater investiga-tion techniques (including flow modelling, hydrograph anal-ysis, geophysics, and geochemistry) when inferring artesian discharge to an alluvial aquifer. This research has demon-strated that a multi-tracer geochemical approach is required to better determine artesian contributions to the alluvial aquifer and must be considered in constraining future models of the study system and elsewhere.
Data availability. All data are provided in either the text itself or the Supplement.
The Supplement related to this article is available online at https://doi.org/10.5194/hess-21-5953-2017-supplement.
Author contributions. Experimental conceptualisation and design was carried out by DIC and BFJK. Fieldwork was conducted by CPI, DIC, SIH, and BFJK. Additional data was contributed by KTM. Geochemical analyses were conducted by CPI, DIC, and KMW. The manuscript was written by CPI with input from all au-thors.
Competing interests. The authors declare that they have no conflict of interest.
Acknowledgements. This research was funded by the Cotton Re-search and Development Corporation (CRDC). Charlotte Iverach was supported by scholarships from the Australian Government, ANSTO, and CRDC. ANSTO support and analytical staff are thanked for their continuous efforts (Chris Dimovski, Henri Wong, Robert Chisari, Vladimir Levchenko, Krista Simon, Alan Williams, Simon Varley). The authors also thank Lisa Williams for editing and proofreading the manuscript. In addition, many thanks to the associate editor (Markus Hrachowitz) and the three reviewers, who provided constructive feedback and raised the overall quality of the manuscript.
Edited by: Markus Hrachowitz Reviewed by: three anonymous referees
References
Acworth, R. I., Timms, W. A., Kelly, B. F. J., McGeeney, D. E., Ralph, T. J., Larkin, Z. T., and Rau, G. C.: Late Cenozoic pale-ovalley fill sequence from the Southern Liverpool Plains, New South Wales – implications for groundwater resource evaluation, Aus. J. Earth. Sci., 62, 657–680, 2015.
Airey, P. L., Calf, G. E., Campbell, B. L., Hartley, P. E., Roman, D., and Habermehl, M. A.: Aspects of the isotope hydrology of the Great Artesian Basin, Australia, International Symposium on Isotope Hydrology, Germany, 1978.
Amiri, V., Nakhaei, M., Lak, R., and Kholghi, M.: Geophysical, iso-topic, and hydrogeochemical tools to identify potential impacts on coastal groundwater resources from Urmia hypersaline Lake, NW Iran, Environ. Sci. Poll. Res., 23, 16738–16760, 2016. Anderson, M. P. and Woessner, W. W.: Applied Groundwater
Mod-elling: Simulation of Flow and Advective Transport, Academic Press, ISBN-10: 0-12-059485-4, London, 1992.
Andrews, J. N. and Fontes, J.-C.: Comment on “Chlorine 36 dating of very old groundwater, 3, Further results on the Great Artesian Basin, Australia” by T. Torgersen et al., Water Resour. Res., 296, 1871–1874, 1993.
Ball, J. W. and Nordstrom, D. K.: User’s manual for WATEQ4F, with revised thermodynamic data base and text cases for calcu-lating speciation of major, trace, and redox elements in natural waters, USGS Numbered Series Report, 91–183, 1991. Barrett, C.: Upper Namoi groundwater source – status report 2011,
NSW Department of Primary Industries, Office of Water, Syd-ney, 2012.
Barnett, B., Townley, L. R., Post, V., Evans, R. E., Hunt, R. J., Peeters, L., Richardson, S., Werner, A. D., Knapton, A., and Boronkay, A.: Australian groundwater modelling guidelines, Waterlines report, National Water Commission, Canberra, 2012. Bentley, H. W., Phillips, F. M., Davis, S. N., Habermehl, M. A., Airey, P. L., Calf, G. E., Elmore, D., Gove, H. E., and Torgersen, T.: Chlorine 36 dating of very old groundwater. 1. The Great Artesian Basin, Australia, Water Resour. Res. 22, 1991–2001, 1986.
Beven, K.: Environmental Modelling: An Uncertain Future?, Routledge, ISBN-13: 978-0415457590, ISBN-10: 0415457599, Oxon, 2009.
Calf, G. E.: An investigation of recharge to the Namoi Valley aquifers using environmental isotopes, Aust. J. Soil Res., 16, 197–207, 1978.
Cartwright, I., Weaver, T., Cendón, D. I., and Swane, I.: Environ-mental isotopes as indicators of inter-aquifer mixing, Wimmera region, Murray Basin, Southeast Australia, Chem. Geol., 277, 214–226, 2010.
Cartwright, I., Fifield, L. K., and Morgenstern, U.: Using3H and
14C to constrain the degree of closed-system dissolution of
cal-cite in groundwater, Appl. Geochem., 32, 118–128, 2013. Cendón, D. I., Larsen, J. R., Jones, B. G., Nanson, G. C.,
Rickle-man, D., Hankin, S. I., Pyeyo, J. J., and Maroulis, J.: Freshwa-ter recharge into a shallow saline groundwaFreshwa-ter system, Cooper Creek floodplain, Queensland, Australia, J. Hydrol., 392, 150– 163, 2010.
Cendón, D. I., Hankin, S. I., Williams, J. P., van der Ley, M., Pe-terson, M., Hughes, C. E., Meredith, K., Graham, I. T., Hollins, S. E., Levchenko, V., and Chisan, R.: Groundwater residence time in a dissected and weathered sandstone plateau: Kulnura-Mangrove Mountain aquifer, NSW, Australia, Aus. J. Earth Sci., 61, 475–499, 2014.
Chen, Z., Nie, Z., Zhang, G., Wan, L., and Shen, J.: Environmental isotopic study on the recharge and residence time of groundwater in the Heihe River Basin, northwestern China, Hydrogeol. J., 14, 1635–1651, 2006.
Clark, I. D. and Fritz, P. (Eds.): Age Dating Old Groundwater, En-vironmental Isotopes in Hydrogeology, CRC Press, USA, 1997. Costelloe, J. F., Irvine, E. C., Weestern, A. W., and Tyler, M.:
Iden-tifying fluvial recharge and artesian upwards leakage contribu-tions to arid zone shallow, unconfined groundwater, Chem. Geol., 326–327, 189–200, 2012.
CSIRO: Water availability in the Namoi, A report to the Australian Government from the CSIRO Murray-Darling Basin Sustainable Yields Project, CSIRO, Australia, 154 pp., 2007.
Currell, M. J., Werner, A. D., McGrath, C., Webb, J. A., and Berk-man, M.: Problems with the application of hydrogeological sci-ence to regulation of Australian mining projects: Carmichael Mine and Doongmabulla Springs, J. Hydrol., 548, 674–682, 2017.
Dawes, W. R., Gilfedder, M., Walker, G. R., and Evans, W. R.: Bio-physical modelling of catchment-scale surface water and ground-water response to land-use change, Math. Comp. Sim., 64, 3–12, 2004.
DPI Water: (Department of Primary Industries (DPI) Wa-ter): NSW Government, Namoi Alluvium Water Re-source Plan (GW14), Status and Issues Paper, available at: http://www.water.nsw.gov.au/__data/assets/pdf_file/0020/ 701732/Status-and-Issues-Paper-Namoi-GW-WRP.pdf, last access: 6 June 2017.
Duvert, C., Stewart, M. K., Cendón, D. I., and Raiber, M.: Time series of tritium, stable isotopes and chloride reveal short-term variations in groundwater contribution to a stream, Hydrol. Earth Syst. Sci., 20, 257–277, https://doi.org/10.5194/hess-20-257-2016, 2016.
Edmunds, W. M.: Geochemistry’s vital contribution to solving wa-ter resource problems, Appl. Geochem., 24, 1058–1073, 2009. Fink, D., Hotchkis, M., Hua, Q., Jacobsen, G., Smith, A. M., Zoppi,
U., Child, D., Mifsud, C., van der Gaast, H., Williams, A., and Williams, M.: The ANTARES AMS facility at ANSTO, Nucl. Instrum. Meth. B, 223–224, 109–115, 2004.
Gardner, W. P., Harrington, G. A., and Smerdon, B. D.: Using ex-cess4He to quantify variability in aquitard leakage, J. Hydrol., 468–469, 63–75, 2012.
Giambastiani, B. M. S., McCallum, A. M., Andersen, M. S., Kelly, B. F. J., and Acworth, R. I.: Understanding groundwater pro-cesses by representing aquifer heterogeneity in the Maules Creek Catchment, Namoi Valley (New South Wales, Australia), Hydro-geol. J., 20, 1027–1044, 2012.
Golder Associates Santos Gunnedah Basin CSG Project: Ground-water impact study – Kahlua pilot test, Report No. 107626100-005-Rev1, Golder Associates, Australia, 2010.
Herczeg, A. L., Torgersen, T., Chivas, A. R., and Havermehl, M. A.: Geochemistry of ground waters from the Great Artesian Basin, Australia, J. Hydrol., 126, 225–245, 1991.
Hocking, M. and Kelly, B. F. J.: Groundwater recharge and time lag measurement through Vertosols using impulse response func-tions, J. Hydrol., 535, 22–35, 2016.
Jasechko, S.: Partitioning young and old groundwater with geo-chemical tracers, Chem. Geol., 427, 35–42, 2016.
Kelly, B. F. J., Merrick, N., Dent, B., Milne-Home, W., and Yates, D.: Groundwater Knowledge and Gaps in the Namoi Catchment Management Area, Cotton Catchment Communities CRC, Uni-versity of Technology, Sydney – National Centre for Groundwa-ter Management Report, NCGM 2007/1, 70 pp., 2007.
Kelly, B. F. J., Timms, W., Ralph, T. J., Giambastiani, B. M. S., Communian, A., McCallum, A. M., Andersen, M. S., Blakers, R. S., Acworth, R. I., and Baker, A.: A reassessment of the Lower Namoi Catchment aquifer architecture and hydraulic connectiv-ity with reference to climate drivers, Aus. J. Earth Sci., 61, 501– 511, 2014.
Lower Namoi Groundwater: NSW Government Depart-ment of Water and Energy, DWE_08_011, available at: http://www.water.nsw.gov.au/water-management/water-sharing/ plans_commenced/water-source/upper-lower-namoi-gw (last access: 20 September 2017), 2008.
dat-ing of old groundwater, southwestern Great Artesian Basin, Aus-tralia, Water Resour. Res., 36, 1561–1574, 2000.
Mahara, Y., Habermehl, M. A., Miyakawa, K., Shimada, J., and Mizuochi, Y.: Can the 4He clock be calibrated by 36Cl for groundwater dating?, Nucl. Instrum. Meth. B, 259, 536–546, 2007.
Mahara, Y., Habermahl, M. A., Hasegawa, T., Nakata, K., Ransley, T. R., Hatano, T., Mizuochi, Y., Kobayashi, H., Nimomiya, A., Senior, B. R., Yasuda, H., and Obta, T.: Groundwater dating by estimation of groundwater flow velocity and dissolved 4He ac-cumulation rate calibrated by 36Cl in the Great Artesian Basin, Australia, Earth Planet. Sci. Lett., 287, 43–56, 2009.
Martinez, J. L., Raiber, M., and Cendón, D. I.: Using 3D geolog-ical modelling and geochemgeolog-ical mixing models to characterise alluvial aquifer recharge sources in the upper Condamine River catchment, Queensland, Australia, Sci. Tot. Environ., 574, 1–18, 2017.
Mawhinney, W.: Namoi Water Quality Project 2002–2007 – Fi-nal report, NSW Office of Water, Sydney, 39 pp., avail-able at: http://pandora.nla.gov.au/pan/126486/20110413-1101/ namoiwater.pdf (last access: 20 September 2017), 2011. McLean, W. A.: Hydrogeochemical evolution and variability in a
stressed alluvial aquifer system: Lower Namoi River catchment, NSW, PhD thesis, University of New South Wales, Sydney (un-published), 2003.
Merrick, N. P.: Optimisation Techniques for Groundwater Manage-ment, PhD Thesis, University of Technology, Sydney (unpub-lished), 551 pp., 2000.
Middlemis, H., Merrick, N. P., and Ross, J. B.: Groundwater Flow Modelling Guideline, Aquaterra Consulting Pty Ltd, Consul-tancy Report, Perth, November 2000.
Mook, W. G. and van der Plicht, J.: Reporting 14C activities and concentrations, Radiocarbon, 41, 227–239, 1999.
Moya, C. E., Raiber, M., Taulis, M., and Cox, M. E.: Using environ-mental isotopes and dissolved methane concentrations to con-strain hydrochemical processes and inter-aquifer mixing in the Galilee and Eromanga Basins, Great Artesian Basin, Australia, J. Hydrol., 539, 304–318, 2016.
NSW Pinneena Groundwater Database: NSW Government DPI Wa-ter, available at: http://allwaterdata.water.nsw.gov.au/water.stm, last access: 19 May 2017.
Parkhurst, D. and Appelo, C.: User’s guide to PHREEQC – a com-puter program for speciation, batch-reaction, one dimensional transport, and inverse geochemical calculations, USGS Water Resources Investigations Report, No. 994259, 1999.
Parkhurst, D. L. and Charlton, S. R.: NetpathXL – An Excel inter-face to the program NETPATH, USGS Techniques and Methods, 6-A26, 2008.
Phillips, F. M.: Chlorine-36, in: Environmental Tracers in Subsur-face Hydrology, edited by: Cook, P. and Herczeg, A. L., 299–348, 2000.
Plummer, L. N. and Glynn, P. D.: Radiocarbon dating in water systems, in: Isotope methods for dating old ground-water, Vienna, International Atomic Energy Agency, 33–89, STI/PUB/1587, 2013.
Powell, J. and Scott, F.: A representative irrigation farming system in the Lower Namoi Valley of NSW: an economic analysis, Eco-nomic Research Report No. 46, Industry and Investment NSW, 63 pp., 2011.
Puls, R. W. and Barcelona, M. J.: Low-flow (minimal drawdown) groundwater sampling procedures, EPA/540/S-95/504, 10 pp., 1996.
Radke, B., Ferguson, J., Cresswell, R. G., Ransley, T. R., and Haber-mehl, M. A.: Hydrochemistry ad implied hydrodynamics of the Cadna-owie-Hooray Aquifer Great Artesian Basin, Bureau of Rural Sciences, Canberra, 2000.
Raiber, M., Webb, J. A., Cendón, D. I., White, P. A., and Ja-cobsen, G. E.: Environmental isotopes meet 3D geological modelling: Conceptualising recharge and structurally-controlled aquifer connectivity in the basalt plains of south-western Victo-ria, Australia, J. Hydrol., 527, 262–280, 2015.
Rawling, G. C. and Newton, B. T.: Quantity and location of ground-water recharge in the Sacramento Mountains, south-central New Mexico (USA), and their relation to the adjacent Roswell Arte-sian Basin, Hydrogeol. J., 24, 757–786, 2016.
Reilly, T. E. and Harbaugh, A. W.: Guidelines for Evaluating Ground-Water Flow Models, USGS Scientific Investigations Report 2004-5038, available at: https://pubs.usgs.gov/sir/2004/ 5038/PDF.htm (last access: 10 October 2017), 2004.
Robertson, W. D. and Cherry, J. A.: Tritium as an indicator of recharge and dispersion in a groundwater system in Central On-tario, Water Resour. Res., 25, 1097–1109, 1989.
Salameh, E. and Tarawneh, A.: Assessing the imapcts of uncon-trolled artesian flows on the management of groundwater re-sources in the Jordan Valley, Environ. Earth Sci., 76, 291, https://doi.org/10/1007/s12665-017-6610-0, 2017.
Scanlon, B. R., Healy, R. W., and Cook, P. G.: Choosing appropriate techniques for quantifying groundwater recharge, Hydrogeol. J., 10, 18–39, 2002.
Schilling, K. E., Jacobsen, P. J., Libra, R. D., Gannon, J. M., Lan-gel, R. J., and Peate, D. W.: Estimating groundwater age in the Cambrian-Ordovician aquifer in Iowa: implications for bio-fuel production and other water uses, Environ. Earth Sci., 76, https://doi.org/10/1007/s12665-016-6321-y, 2017.
Sharma, P., Kuhik, P. W., Fehn, U., Gove, H. E., Nishiizumi, K., and Elmore, D.: Development of 36Cl standard for AMS, Nucl. Instr. Meth. B., 52, 410–415, 1990.
Short, M. A., de Caritat, P., and McPhail, D. C.: Continental-scale variation in chloride/bromide ratios of wet deposition, Sci. Tot. Environ., 574, 1533–1543, 2017.
Stone, J. O., Allan, G. L., Fifield, L. K., and Cresswell, R. G.: mogenic chlorine-36 from calcium spallation, Geochim. Cos-mochim. Ac., 60, 679–692, 1996.
Smithson, A.: Lower Namoi Groundwater Source: Groundwater Management Area 001, Groundwater Status Report 2008, NSW Department of Water and Energy, Sydney, 2009.
Tadros, N. Z.: The Gunnedah Basin, New South Wales, Vol. 12, Department of Mineral Resources, Coal and Petroleum Geology Branch, Sydney, 1993.
Tadros, C. V., Hughes, C. E., Crawford, J., Hollins, S. E., and Chis-ari, R.: Tritium in Australian precipitation: A 50 year record, J. Hydrol., 513, 262–273, 2014.
Wilcken, K. M., Fink, D., Hotchkis, M. A. C., Garton, D., But-ton, D., Mann, M., Kitchen, R., Hauser, T., and O’Connor, A.: Accelerator Mass Spectrometry on SIRIUS: New 6 MV spec-trometer at ANSTO, Nucl. Instrum. Meth. B, 406, 278–282, https://doi.org/10.1016/j.nimb.2017.01.003, 2017.
Williams, R. M., Merrick, N. P., and Ross, J. B.: Natural and in-duced recharge in the Lower Namoi Valley, New South Wales, in: Groundwater Recharge, edited by: Sharma, M. L., Proceedings of the Symposium on Groundwater Recharge, 239–253, 1989.