Georgia State University
ScholarWorks @ Georgia State University
Public Health Theses School of Public Health
Spring 5-15-2015
Nativity Status and Dietary and Physical Activity
Behavior among United States Adults: Findings
from the Health Information National Trends
Survey (HINTS 4 Cycle 3)
Joyce T. Alese
Follow this and additional works at:https://scholarworks.gsu.edu/iph_theses
This Thesis is brought to you for free and open access by the School of Public Health at ScholarWorks @ Georgia State University. It has been accepted for inclusion in Public Health Theses by an authorized administrator of ScholarWorks @ Georgia State University. For more information, please contact [email protected].
Recommended Citation
Alese, Joyce T., "Nativity Status and Dietary and Physical Activity Behavior among United States Adults: Findings from the Health Information National Trends Survey (HINTS 4 Cycle 3)." Thesis, Georgia State University, 2015.
Nativity Status and Dietary and Physical Activity Behavior among United States Adults:
Findings from the Health Information National Trends Survey (HINTS 4 Cycle 3)
By
Joyce T. Alese
A Thesis Submitted to the Graduate Faculty of Georgia State University
In Partial Fulfillment of the Requirements for the Degree
MASTER OF PUBLIC HEALTH
ATLANTA, GEORGIA
1
APPROVAL PAGE
Nativity status and Dietary and Physical Activity Behavior among United States Adults:
Findings from the Health Information National Trends Survey (HINTS 4 Cycle 3)
By
Joyce T. Alese
Approved by:
Richard Rothenberg, MD MPH FACP
Committee Chair
Shanta R. Dube, PhD, MPH
Committee Member
2
ACKNOWLEDGEMENT
To God, my heavenly father: I’m forever grateful. My hope is in you always.
To my thesis chair, Dr Richard Rothenberg and my thesis committee member, Dr Shanta Dube:
Thank you for helping me through this. I appreciate your patience, guidance, comments,
corrections and quick response to all my requests.
To my darling husband: Thank you for being there for me. You are indeed a pillar of support.
You rock!
To my adorable daughters: Thank you for your love and support, especially during the hectic
periods. Love you threesome loads!
To my Dad: Thank you for the training. I wish you were here to see this!
To my Mom: Thank you for your love, support, and prayers. I love and appreciate you always.
To my big family: Thank you all for your love and support. Love you all.
To all my teachers, and faculty and staff of School of Public Health at Georgia State University:
Thank you for the great work you all do.
To my senior colleagues, classmates and junior colleagues at School of Public Health, Georgia
State University: It has been an awesome experience with you. I specially appreciate Reynolds
Morrison and David Yankey for the support and encouragement.
3
AUTHOR’S STATEMENT
In presenting this thesis as a partial fulfillment of the requirements for an advanced
degree from Georgia State University, I agree that the Library of the University shall make it
available for inspection and circulation in accordance with its regulations governing materials of
this type. I agree that permission to quote from, to copy from, or to publish this thesis may be
granted by the author or, in his absence, by the professor under whose direction it was written, or
in his absence, by the Associate Dean, College of Health and Human Sciences. Such quoting,
copying, or publishing must be solely for scholarly purposes and will not involve any potential
financial gain. It is understood that any copying from or publication of this thesis which involves
potential financial gain will not be allowed without written permission of the author.
Joyce T. Alese
4 Notice to Borrowers
All thesis deposited in the Georgia State University Library must be used in accordance with the
stipulations described by the author in the preceding statement.
The Author of this Thesis is:
Joyce T. Alese, MBBS 3255 Landingview Court
Lilburn, GA 30047
The Chair of the committee for this Thesis is:
Richard Rothenberg, MD MPH FACP School of Public Health
One Park Place
Atlanta, GA 30303
Users of this thesis who are not regularly enrolled as student at Georgia State University are
required to attest acceptance of the preceding stipulation by signing below. Libraries borrowing
this thesis for the use of their patrons are required to see that each user records here the
information requested.
NAME OF USER ADDRESS DATE TYPE OF USE
5 TABLE OF CONTENTS
List of Abbreviations………..………...……….7
List of Figures………...8
List of Tables...9
Abstract...10
CHAPTER I: INTRODUCTION...12
1.1 Background ……….…….……...……...12
1.2 Purpose of Study ……….………….……...…...13
1.3 Research Questions and Hypotheses……….………14
1.4 Theoretical Framework ……….…...….……14
CHAPTER II: LITERATURE REVIEW...16
2.1 Obesity in the U.S.………..……….….…16
2.2 Obesity-related Behavior ………....………..…….…17
2.3 U.S. Immigration Trends……….………….….17
2.4 U.S. Immigrants and Obesity……….……..…. 18
2.5 U.S. Immigrants and Obesity-related Behavior………...……….….20
CHAPTER III: METHODS……….………...22
3.1 Overview………....…....22
3.2 Variables and Specifications……….….………..…...23
3.3 Data Analysis...26
CHAPTER IV: RESULTS...28
4.1 Demographic Characteristics……….…….………...………...28
4.2 Distributions of Weight, Diet and Physical activity by nativity status…..…….…30
4.3 Associations between Nativity Status and Outcome Variables of Interest……...31
CHAPTER V: DISCUSSION AND CONCLUSION...35
6
5.2 Study Strengths and Limitations...38
5.3 Conclusion and Recommendations...39
Figures………..….…….41
Tables……..……….……..…….……44
7
LIST OF ABBREVIATIONS
ACA: Affordable Care Act
AHA: American Heart Association
AOR: Adjusted Odds Ratio
BMI: Body Mass Index
CPS: Current Population Survey
FGDs: Focus Group Discussions
HIE: Healthy Immigrant Effect
HINTS: Health Information National Trends Survey
IRB: Institutional Review Board
NCDs: Non-communicable Diseases
NCI: National Cancer Institute
95% CI: Ninety-five percent Confidence Interval
SD: Standard Deviation
TV: Television
U.S: United States
8
LIST OF FIGURES
Figure 1: Distribution of demographic characteristics among participants in HINTS 4 cycle 3.
1A: Age distribution
1B: Level of Education
1C: Income ranges
Figure 2: Distribution of demographic characteristics by nativity status of participants in HINTS
4 cycle 3
2A: Nativity status
2B: Level of Education
2C: Income ranges
9
LIST OF TABLES
Table 1:Demographic characteristics by nativity status of participants in HINTS 4 cycle 3.
Table 2:Distributions of selected variables (indicators of dietary behavior and physical activity level, and BMI) by nativity status of participants in HINTS 4 cycle 3.
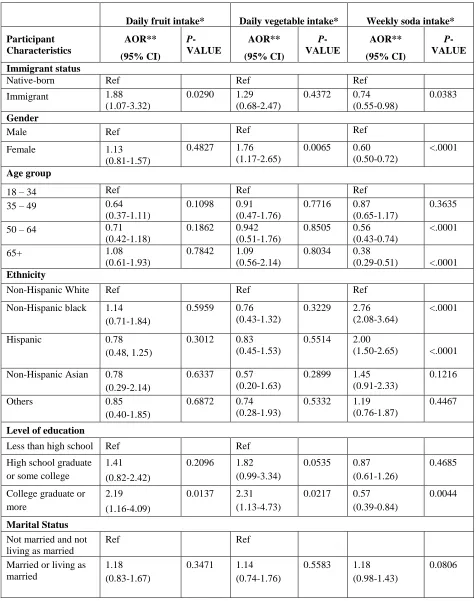
Table 3:Adjusted logistic regression analyses for associations between nativity status and three separate indicators of dietary behavior among participants in HINTS 4 cycle 3.
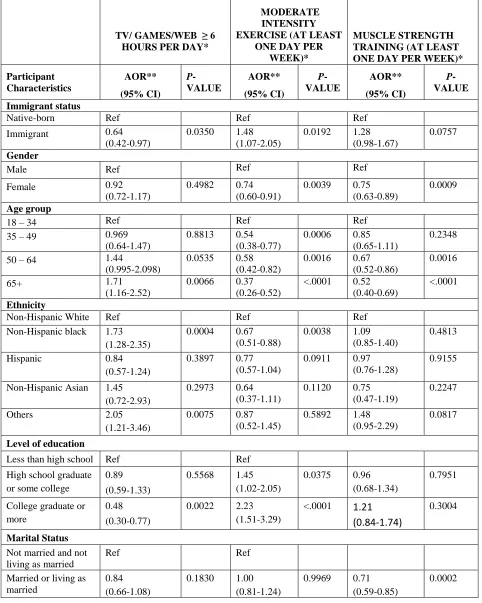
Table 4:Adjusted logistic regression analyses for associations between nativity status and three
10 ABSTRACT
Background: Non-communicable diseases and chronic conditions continue to emerge as public
health crises in the United States (U.S.) and globally. Obesity, one of the most notable of such
conditions, is associated with significant morbidity and mortality. Compared to non-immigrants,
U.S. immigrants are known to have lower risks of obesity. However, there is paucity of literature
on how U.S. immigrants compare to native-born adults regarding obesity-related behavior.
Objective: We aim to describe demographic characteristics, weight distribution, and distributions
of specific obesity-related behaviors among immigrant and native-born U.S. adults. Secondarily,
we aim to estimate associations between nativity status and obesity-related behavior among U.S.
adults.
Methodology: We analyzed data from the Health Information National Trends Survey conducted
between September and December 2013 (HINTS 4 Cycle 3). The independent variable was
nativity status (immigrant vs. native-born). Outcomes of interest were indicators of dietary
behavior (fruit, vegetable, and soda intake) and indicators of physical activity level (sitting time
spent on television/computer games/web surfing, participation in physical exercise, and
participation in muscle training exercise). Bivariate analyses and multivariable logistic
regression models were utilized in describing demographics, weight distribution, and
associations between variables of interest. Statistical significance was determined using p-values
< 0.05 and 95% CI around adjusted odds ratios.
Results: A total of 3185 individuals participated in the survey. The overall male to female ratio
was 1:1.6. Approximately 17% of participants were immigrants and roughly 83% were
11
for native-born respondents. Among immigrants, the racial distribution was 55.3% Hispanic,
18.9% Asian, 14.7% White, 9.9% Black and 1.3% other races. About 25% of immigrants were
obese, compared to 34% of non-immigrants. Immigrants were more likely than native-born
respondents to take some quantity of fruit daily (adjusted OR = 1.88; 95% CI: 1.07 - 3.32; p =
0.0290); and less likely than native-born respondents to consume soda every week (adjusted OR
= 0.74; 95% CI: 0.55 - 0.98; p = 0.0383). Immigrants were less likely than non-immigrants to
spend 6 hours or more a day on sedentary leisure activities (adjusted OR = 0.64; 95% CI: 0.42 -
0.97; p = 0.0350). Immigrants were also more likely than non-immigrants to engage in physical
activity of at least moderate intensity, at least once a week (adjusted OR = 1.48; 95% CI: 1.07 -
2.05; p = 0.0192).
Conclusion: Compared to non-immigrants, U.S. immigrants appear to have a tendency towards
healthier lifestyles regarding diet and physical activity behavior. Strategies to sustain such
tendencies among immigrants will promote health and reduce risks of obesity, cancer and other
chronic diseases in the U.S. More robust studies are needed to shed more light on various
socio-economic, cultural and demographic factors that influence proximal determinants of obesity.
Keywords: Nativity Status, Immigrant, Native Born, Obesity-Related Behavior, Diet, Physical
12
CHAPTER I: INTRODUCTION
1.1Background
Non-communicable diseases (NCDs) and chronic conditions continue to emerge as public
health crises in the United States (U.S.) and globally.1 One of the most prominent of such is
obesity, a major chronic condition associated with many adverse health outcomes.2 Obesity is
defined as a body mass index (BMI) equal to or greater than 30kg/m2, and more than a third
(roughly 35%) of adults in the U.S. is obese.3 Obesity is associated with significant morbidity
and mortality, resulting in huge economic costs for the individual and for the nation.
Cardiovascular disease, hyperlipidemias, type 2 diabetes mellitus, sleep disorders and depression
are more common among obese people compared to the general population; and in 2012, an
estimated $190.2 billion (21% of annual U.S. medical spending) was projected for obesity
related illnesses.2
Individuals’ lifestyle choices have an impact on their BMI, and obesity could be the
consequence of a number of lifestyle choices, collectively known as obesity-related behavior.
Studies have established the remarkable impact of positive health behavior (including
appropriate diet and physical exercise) in reducing obesity rates in general.4,5
In the meantime, immigration to the U.S. is on a steady increase. The population of
immigrants in the U.S. increased from 9.6 million in 1970 to 31.1 million in 2000;6 and
immigrants currently represent a substantial population group in the U.S.7 Research shows that in
spite of lower income and educational attainment, adult U.S. immigrants have lower risks of
obesity compared their native-born counterparts; especially in the early years of immigration.8,9
13
obesity-related behavior between immigrants and native-born U.S. adults. Specifically, data
comparing immigrants and non-immigrants as regards proximal determinants of obesity is very
limited.
In view of the steady increase in the number of U.S. immigrants, and the evidence supporting
lower risks of obesity among immigrants, it is important to explore and characterize any
dissimilarity that may exist in obesity-related behavior, comparing immigrants to native-born
U.S. adults. Good knowledge and understanding of any such dissimilarity will help policy
makers and public health practitioners in formulation of policies and tailoring of messages to
effectively reduce the risk of obesity in the U.S. populace.
The current thesis uses a nationally representative sample of U.S. adults to explore and report
proximal determinants of obesity (dietary and physical activity behavior), comparing U.S.
immigrants to non-immigrants. It will add to the research on obesity in the U.S. by providing
data that can inform appropriate recommendations for specific and targeted interventions.
1.2Purpose of Study
The purpose of this study is to describe demographic characteristics, weight distribution, as
well as distributions of specific obesity-related behavior (diet and physical activity) in a
nationally representative sample of U.S. adults surveyed in 2013. Secondarily, we aim to
estimate associations between nativity status (immigrant vs. native-born) and specific
obesity-related behavior (diet and physical activity) among adults in the U.S. Finally, we aim to evaluate
14 1.3Research Questions and Hypothesis
The following three research questions were explored along with the stated hypotheses:
1. Do adult U.S. immigrants engage in healthier dietary behavior than native-born U.S.
adults?
Ha1: Adult U.S. immigrants will report engaging in healthier dietary behaviors than native-born U.S. adults.
2. Do adult U.S. immigrants engage in more physical activity than native-born U.S. adults?
Ha2: Adult U.S. immigrants will report engaging in more physical activity than
native-born U.S. adults.
3. Does length of stay of U.S. immigrants have an impact on dietary and physical activity
behaviors?
Ha3: Adult U.S. immigrants who report residing in the U.S. for 10 years or more will
have dietary behaviors similar to those of native-born U.S. adults.
Ha4: Adult U.S. immigrants who report residing in the U.S. for 10 years or more will
have physical activity behaviors similar to those of native-born U.S. adults.
1.4 Theoretical Framework
The ‘healthy immigrant’ effect (HIE) posits that new immigrants tend to be healthier than
both the native-born populace and immigrants who have lived in the nation for longer periods of
time.HIE can be viewed as paradoxical because compared to non-immigrants, many immigrants
are of lower socioeconomic status and originate from developing countries. However,several
studies have tested and validated the HIE theory.10-12 Plausible explanations proffered for HIE in
15 mandatory health and fitness screening requirements.13
Based on the HIE, we hypothesize that adult U.S. immigrants engage in healthier dietary
behavior and more physical activity than native-born U.S. adults. Although unlikely to be the
sole reasons, healthier dietary behavior and more physical activity would be expected to
contribute to the lower risks of obesity observed among immigrants, compared to native-born
U.S. adults.
We also postulate that compared to newer immigrants, immigrants with longer length of stay
in the U.S. have dietary and physical activity behavior more similar to those of native-born U.S.
adults. It is known that most immigrants eventually adopt lifestyle choices similar to those of
native-born U.S. adults through acculturation, and the length of stay in the U.S. would be
expected to have an impact on the rate and process of acculturation. Hence, dietary and physical
activity routines of immigrants would be expected to get more similar to those of native-born
residents as length of stay in the U.S. increases, and research has shown the acculturation process
for U.S. immigrants is quite well established within 10 to 15 years of immigration to the country.
16
CHAPTER II: LITERATURE REVIEW
2.1Obesity in the U.S.
With increasing medical costs in the U.S. and globally,14 diseases and conditions that
contribute significantly to health care costs are receiving more attention. The comprehensive
health care reform in the U.S, known as the Affordable Care Act (ACA), was aimed at a
reduction of about $600 billion in the costs of the American health care system in the first decade
alone.15 Due to improvements in technology and in health care practices, NCDs and chronic
conditions such as obesity have dominated the health care landscape for decades, and are
projected to exact the majority of health care costs.1
Defined as a body mass index (BMI) of 30kg/m2 or more, obesity is a notable chronic
condition with significant health consequences of major economic importance. BMI is measured
as weight in kilograms divided by the square of height in meters.16 About 72 million U.S. adults
and 17% of U.S. children are obese.17 Some of the adverse health outcomes of obesity include
type 2 diabetes, hypertension, stroke, heart disease, osteoarthritis, fertility problems, liver
disease, gallbladder disease, and some types of cancer.2,18 In 1991, an estimated 280,184 deaths
in the U.S. was attributed directly to obesity.19 More recent data indicates that obese adults have
20% or more significantly higher rates of all-cause mortality.20 Obesity is therefore a chronic
condition that warrants continued public health attention, and that should be tackled from all
possible angles.
The prevalence of obesity in the U.S. is known to differ among groups and sub-populations.21
Hence, determination of risks specific to sub-populations as well as comparisons of
obesity-related behavior among diverse groups will promote planning of targeted interventions for health
17 2.2Obesity-related Behavior
Numerous studies have explored factors related to the etiology of obesity. These factors have
been broadly categorized as genetic, environmental and behavioral.22 Behavioral factors are
lifestyle choices that either promote or prevent obesity, and constitute part of the multifaceted
proximal determinants of obesity. Balanced caloric intake and regular physical activity are
among the well-recognized lifestyle choices that prevent overweight and obesity.23 It is believed
that overweight and obesity result from an energy imbalance: a combination of consumption of
too many calories (especially from unhealthy food types) and inadequate physical activity. There
is clearly a genetic component to the development of obesity, particularly among people who are
veryheavy,24 but behavioral factors represent the most modifiable factors contributing to the
incidence and prevalence of obesity. As such, interventions aimed at modifying behavioral
factors (especially those that are proximal determinants of obesity)will have significant impact
on prevention and reduction of obesity risks. The World Health Organization framework for the
implementation of the Global Strategy on Diet, Physical Activity and Health emphasizes the role
of governments in formulating policies that improve food and physical activity environments to
make healthy eating and physical activity choices easier for the populace.25 Such policies, for
example, would do well to address facilitation of fruit and vegetable consumption among various
racial and ethnic sub-populations. Consumption of fruits and vegetables is a healthy dietary
choice that has been shown to decrease obesity, enhance weight management and improve
outcomes in cardiovascular disease.26
2.3U.S. Immigration Trends
Foreign born individuals constituted 13% of the 2012, and 16% of the 2013 American
18
number is double, almost triple and about quadruple the 1990, 1980, and 1970 immigrant
population numbers respectively.28 The number of immigrants in the U.S. at present is greater
than at any time in the past andcurrently, there are about one million new arrivals per year.
Based on the steady increase in immigration over the past few decades, it is projected that by
2050, almost 20% of Americans (i.e. one in every five) will be immigrants.29 The banking
industry, Silicon Valley and academia continue to attract highly skilled immigrants, while less
skilled immigrants participate in significant numbers in the blue collar industries of
manufacturing, agriculture, food processing, as well as in other industries less appealing to
native-born workers.30 Incorporating large numbers of newcomers has cost implications for the
nation, including costs of healthcare, hospitals, welfare, social services and other special
programs for immigrants. In order to promote health and prevent disease among the rapidly
expanding U.S. immigrant population, public health researchers and practitioners need to direct
attention to specific conditions for which immigrants are at high risk and to tailor interventions
toward such conditions.
2.4U.S. Immigrants and Obesity
Compared to native-born U.S. adults, U.S. immigrants have been shown to have lower
obesity risks, especially in the first few years following immigration. Antecol et al. found that at
entry into the U.S., female and male immigrants had obesity rates roughly two and five
percentage points lower than native-born women and men respectively.31 This observed lower
risk of obesity cuts across various immigrant subgroups, including Latinos,9 Asians,32 and
persons of African descent.33 Furthermore, the observed lower risk of obesity among immigrants
holds true in spite of lower income and educational attainment.8,9 The latter finding is somewhat
19
indices and the prevalence of obesity in native-born U.S. residents. Explanations proffered in
literature for this “immigrant paradox” include a ‘healthy immigrant’ effect (HIE), the protective
influence of strong social networks and family ties, and even a reporting bias.34 The observed
lower risk of obesity among U.S. immigrants is all the more interesting in the light of increasing
rates of obesity in countries like Mexico that account for a high proportion of immigrants to the
U.S.35
However, morbidity and mortality risks from various diseases and conditions eventually
change for immigrants as their length of residence in the U.S. increases, 36 and obesity is no
exception. The risk of obesity among immigrants is known to increase as the length of stay
increases. In their study, Antecol et al. further reported that female and male immigrants gain
enough weight to develop obesity rates comparable with that of native-born Americans, within
10 and 15 years of arrival respectively. 31 Moreover, similar to the observed lower risk of
obesity for immigrants at entry, the observed increased risk of obesity with increased length of
residence also cuts across various immigrant subgroups. A study found that Latinos who had
stayed in the U.S. for 15 or more years developed about a four-fold risk of obesity compared to
those with less than 5 years of stay.37 Another study observed that immigrant women of Puerto
Rican origin who had been in the U.S. for 10 years or more had a 40% prevalence of obesity,
compared to a prevalence of 29% for those who had been in the U.S. less than a year.38
Furthermore, in a nationally representative sample of 5,230 U.S. immigrants of various racial
and ethnic sub-groups, there was a direct correlation between length of residence and risk of
obesity;15 or more years was associated with increased risk of obesity (OR 1.31; 95% CI
20 2.5 U.S. Immigrants and Obesity-related Behavior
Acculturation is the process by which after immigration, immigrants adopt the norms,
behaviors and practices of the dominant culture. There is evidence for acculturation among U.S.
immigrants as length of residence in the nation increases; and this can lead to the adoption of
lifestyle choices that in turn increase their risks of obesity from the baseline of substantially
lower risks.40 Also, additional evidence for acculturation derives from the notable increases in
obesity risks observed in successive generations of immigrants.41
An individual’s BMI is influenced by proximal (caloric intake and physical activity) and
distal (cultural attitudes and practices) factors, which have also been linked to obesity trends in
populations. Researchers have placed emphasis on distal factors in the acculturation process,
and various studies have examined the role of cultural attitudes and practices among U.S.
immigrants. Changes in culture arebelieved to influence weight gain, leading to increased
obesity rates among immigrant groups as length of stay in the U.S. increases, as well as among
successive generations of immigrants.38,42 In contrast however, the literature is limited
regarding the contributions of proximal determinants of obesity (such as diet and physical
activity) to the observed increase in obesity risks as length of stay increases.
Only a few studies have explored probable baseline differences in diet and physical activity
behavior between immigrants and native-born U.S. adults, as well as how these behavioral
determinants of obesity change with length of stay in the U.S.43 One such study, conducted in
2013, employed focus group discussions (FGDs) among Brazilian, Latin American and Haitian
immigrant women, as part of a community based participatory intervention program.44
Participants (recent immigrants) were asked about their diet and physical activity levels in the
21
food in the U.S. is “less natural” and there is less time for preparation. They also stated that the
U.S. weather represents an obstacle to physical activity. The authors highlighted that there are
differences in diet and physical activity behaviors between immigrants and native-born U.S.
adults and suggested attention should be given to individual modifiable risk factors for obesity
among recent immigrants. Another study, evaluating diet and exercise counseling, found that
immigrants were less likely than native-born U.S. adults to discuss their dietary (18% vs 24%)
and physical activity (19% vs 23%) routines and concerns with health care providers.45 The
study emphasized the importance of early intervention with diet and physical activity in
preventing weight gain, obesity, and related chronic illnesses among immigrant subgroups.
Evidently, strategies to maintain the lower risk of obesity observed among U.S. immigrants in
the early years would be good targets for intervention, and should be a public health priority.
Such strategies however cannot be developed without a robust understanding of factors that
contribute to the lower risk in the early years of immigration. Research exploring various
aspects of obesity-related behavior (especially proximal determinants of obesity) among
immigrants is therefore essential.
22
CHAPTER III: METHODS
3.1 Overview
The Health Information National Trends Survey (HINTS) is a survey of a nationally
representative sample of civilian non-institutionalized individuals in the U.S, who are 18 years or
older. The survey includes identifiers for immigrants. Started in 2003, it is conducted biennially
by the National Cancer Institute (NCI) and it is used to monitor changes in the health information
of the American populace. The HINTS program collects data on the American public's need for,
access to, and use of health-related information; as well as data on health-related behaviors,
perceptions and knowledge.46 HINTS 4 Cycle 3 was conducted by mail from September 2013
through December 2013, using a protocol similar to that utilized in previous cycles.47The vast
majority of the survey items in the HINTS questionnaires are derived from instruments used for
evaluation of general health in existing national-level surveys. Although a lot of attention is
given to cancer, other domains assessed by the survey include nutrition and dietary behavior,
physical activity, food security, health status, health care, and health information seeking.
The current thesis employed secondary analysis of the HINTS 4 cycle 3 dataset and was
conducted under Georgia State University Institutional Review Board (IRB)-exempted protocols.
The written report presented gives statistics for variables of interest (demographics and proximal
determinants of obesity) obtained from the dataset.
3.2 Variables and Specifications
Dependent Variables: The dependent variables evaluated for the analyses included several indicators of the usual dietary behavior and physical activity level of participants, as well
23
For dietary behavior, we selected and examined intake of fruits, vegetables and soda by
utilizing the following survey items respectively:
(1) “About how many cups of fruit (including 100% pure fruit juice) do you eat or drink each
day?” Response options in the questionnaire included “none,” “½ cup or less,” “½ cup to 1 cup,”
“1 to 2 cups,” “2 to 3 cups,” “3 to 4 cups,” and “4 or more cups.” The HINTS dataset variable
‘fruit’ was re-coded to produce a 4-level categorical variable (‘none,’ ‘up to 1 cup per day,’ ‘1 to
3 cups per day,’ and ‘3 or more cups per day’) for bivariate analyses; and a dichotomous variable
(‘some fruit intake daily,’ and ‘none’) for multivariable analyses.
(2) “About how many cups of vegetables (including 100% pure vegetable juice) do you eat or
drink each day?” The choice of responses was identical to those for daily fruit intake and the
dataset variable ‘vegetables’ was re-coded to produce a 4-level categorical variable (‘none,’ ‘up
to 1 cup per day,’ ‘1 to 3 cups per day,’ and ‘3 or more cups per day’) for bivariate analyses; and
a dichotomous variable (‘some vegetable intake daily’ and ‘none’) for multivariate analyses.
(3) “Not counting any diet soda or pop, about how often do you drink regular soda or pop in a
typical week?” Response options included “every day,” “5-6 days a week,” “3-4 days a week,”
“1-2 days a week,” “Less often than 1 day a week” and “I don't drink any regular soda or pop.”
These response categories for the variable “RegularSodaWeek” were maintained for bivariate
analyses, but the variable was dichotomized (‘some soda intake weekly’ and ‘none’) for
multivariate analyses.
Indicators selected to represent the usual physical activity level of participants included
24
exercise of at least moderate intensity, and participation in muscle training exercise. For these,
the following survey items were examined respectively:
(1)“Over the past 30 days, in your leisure time, how many hours per day, on average, did you sit
and watch TV or movies, surf the web, or play computer games?” Responses were reported in
hours, and a 4-level categorical variable, created from re-coding of the dataset variable
“AverageDailyTVGames” was used in bivariate analyses. The four newly created categories
were “none,” “less than 5 hours per day,” “5 to 14 hours per day,” and “15 or more hours per
day.”
(2) “In a typical week, how many days do you do any physical activity or exercise of at least
moderate intensity, such as brisk walking, bicycling at a regular pace, and swimming at a regular
pace?” Response options in the survey were “none,” “1 day per week,” “2 days per week,” “3
days per week,” “4 days per week,” “5 days per week,” “6 days per week,” and “7 days per
week.” The dataset variable “TimesModerateExercise” was re-coded to create a 3-level
categorical variable (‘none,’ ‘1 to 3 times per week,’ and ‘4 or more times per week’) which was
used for bivariate analyses. The variable “TimesModerateExercise” was also dichotomized (‘at
least one day per week,’ and ‘none’) for multivariable analyses. For participants who reported
taking part in some form of moderate intensity exercise at least once a week, the follow up
questions included the survey item “On those days, how long are you typically doing these
activities?” The dataset variable “HowLongModerateExerciseMn” reported the responses in
minutes and it was re-coded into a 3-level categorical variable (‘less than 30 minutes per day,’
25
(3) “In a typical week, how many days do you do leisure-time physical activities specifically
designed to strengthen your muscles?” Response options included “none,” “1 day per week,” “2
days per week,” “3 days per week,” “4 days per week,” “5 days per week,” “6 days per week,”
and 7 days per week.” The variable “TimesStrengthTraining” was dichotomized (‘some
muscle-strengthening exercise every week’ and ‘none’) for multivariable analyses.
BMI was a derived variable made available in the HINTS 4 cycle 3 dataset. It was
calculated from the following two survey items: “About how tall are you without shoes?”
(Response was supplied in feet and inches), and “About how much do you weigh, in pounds,
without shoes?” The dataset variable “BMI” was a continuous variable. It was re-coded to
produce a 4-level categorical variable: Underweight (BMI <18.5), Normal weight (BMI 18.5 - 24.9), Overweight (BMI 25 - 29.9) andObese (BMI ≥30). The new categorical BMI variable
was used in bivariate analyses.
Independent Variables: The independent variable of main interest in the analyses was the nativity status of participants: immigrant versus native-born. The HINTS dataset variable
“BornInUSA” was a dichotomous variable obtained from the survey item “Were you born in the
United States?” The response options were “Yes” and “No”. For participants who responded
“No” (i.e. immigrants), one of the follow up survey items was “In what year did you come to live
in the United States?” Immigrants were to supply their responses to this survey item by
indicating the year of entry into the U.S., generating the continuous variable
“YearCameToUSA.” The variable “BornInUSA” was maintained in its original form for all our
analyses, while “YearCameToUSA” was dichotomized (‘less than 10 years,’ and ‘10 years or
26
Covariates: Covariates in our analysis included the following: gender (male; and female), age categories (18-34 years; 35-49 years; 50-64 years; and 65 years or more), level of
education (less than high school; high school graduate or some college; and college graduate or
higher), race/ethnicity (Non-Hispanic White; Non-Hispanic Black; Non-Hispanic Asian;
Hispanic and Other), income ranges (less than $10,000; $10,000 - $49,999; $50,000 - $99,000;
and 100,000 or more), and marital status (married or living as married; not married and not living
as married). These categories of the covariates were obtained by re-coding of the following
dataset variables respectively:“GenderC,” “AgeGrpB,” “EducA,” “RaceEthn,” “IncomeRanges,”
and “MaritalStatus.” We also included disability status (obtained from the dichotomous dataset
variable “Disabled”) as an additional covariate in our analysis.
3.3 Data Analysis
All analyses were done using SAS 9.3 (SAS Institute, Cary NC). We performed bivariate
analyses, the results of which we utilized to describe the distribution of socio-demographic
characteristics of survey participants by nativity status. We used Wald Chi-Square tests (for
categorical variables), and t test for differences in means (for the continuous variable ‘age’), to
determine differences in distributions of demographic variables among immigrants and
non-immigrants; and p-values <0.05 were taken as statistically significant. Furthermore, bivariate
analyses results were utilized to describe dietary and physical activity behavior as well as BMI
distribution among immigrants and non-immigrants;and p-values <0.05 were taken as
statistically significant. Additionally, weusedmultivariable logistic regression models to obtain
adjusted odds ratios (AOR) and 95% confidence intervals (95% CI) for associations between
27
of usual dietary and physical activity behavior among participants and included fruit intake,
vegetable intake, soda intake, average time spent on TV/games/web surfing, participation in
moderate intensity exercise and participation in strength training exercises. In each multivariable
model, dummy variables were created for multi-level categorical variables, and statistical
adjustments were made for gender, age group, race/ethnicity, level of education, marital status,
and income ranges. Furthermore, we created additional multivariable logistic regression models
in which adjustments were made for disability status when considering physical exercise and
muscle training exercise as outcomes. For these additional models, the dichotomous HINTS
variable ‘Disabled’ (with responses ‘Yes’ and ‘No’) was utilized. The variable ‘Disabled’ was
derived from responses of participants to specific survey items that inquired about various forms
of disability including blindness, deafness, difficulty with walking/ dressing/ bathing/ errands, as
well as emotional disability. In all our multivariable models, p-values < 0.05 and 95% CI around
adjusted odds ratios were used to determine statistical significance.
28
CHAPTER IV: RESULTS
4.1 Demographic Characteristics
A total of 3185 individuals participated in the HINTS 4 cycle 3 survey. Sixty-one percent
of participants were female, giving an overall male to female ratio of 1:1.6. The mean age in the
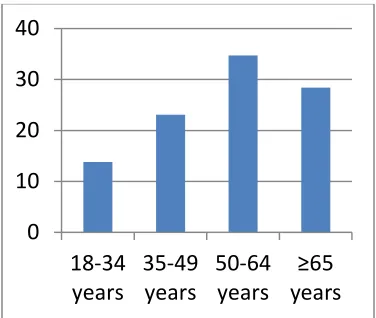
entire cohort was 54.68 years (SD +/- 16.5). Most participants (34.72%) were in the 50-64 year
age category, 28.36% were 65 years or older, 23.10% were in the 35-49 year age category, and
13.82% were in the 18-34 year age category (Figure 1a). About 58% of survey participants were
White, 18.75% were Hispanic, 15.45% were Black, 4.18% were Asian and 3.49% were of other
races. Approximately 52% of respondents were married or living with a partner as married.
Also, 52.71% of participants were high school graduates or had attended some college, 37.69%
had college degrees or higher and 9.59% had less than high school education (Figure 1b). An
estimated 52.24% of respondents were employed, 5.97% were unemployed, 41.79% were either
retired or not in the work force (disabled, homemaker or student). The $10,000 - $49,999 income
range was the most predominant in the entire cohort (44.91%), followed by the $50,000 -
$99,999 income category (28.48%). Seventeen percent of participants made $100,000 or more
per annum, while 9.57% of participants made less than $10,000 per annum (Figure 1c). About
66% of participants reported home ownership.
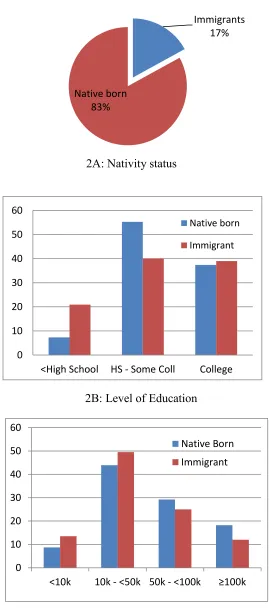
As shown in Figure 2a, approximately 17% of participants were immigrants (n = 533),
while 83% were native-born (n = 2598). About 60% of immigrants and 62% of native-born
respondents were female. Female native-born respondents constituted about half (51.5%) of all
participants in the survey. The mean age for immigrants was 51 years (SD +/- 15), and that for
29
35-49 year age category, while majority of native-born respondents (35.5%) were in the 50-64
year age category. Among immigrants, the second most common age group was the 50-64 year
category (roughly 30.8%), while the 65+ category was the second most common among the
native-born, accounting for 30%. The 18-34 year age category had the least numbers of
respondents among both immigrants and native-born participants. Majority of immigrants
(55.3%) were Hispanic, while most native-born respondents (67.3%) were White. The
distribution among Non-Hispanic immigrant respondents was as follows: 18.9% Asian, 14.7%
White, 9.9% Black and 1.3% other races. Approximately 60% of immigrants, compared to 50%
of native-born respondents, were married or living as married.
About 39% of immigrants had college degrees or higher, compared to 37.4% of
native-born participants. Roughly 21% of immigrants had less than high school education compared to
7.2% of native-born respondents (Figure 2b). Regarding occupational status, 54.9% of
immigrants were employed compared to 51.7% of native-born respondents. Eleven percent of
immigrants were unemployed, compared to 4.9% of native-born participants. Sixty-three percent
of immigrants compared to 52% of native-born respondents had total income less than $50,000
per annum. About 13% of immigrants, compared to 8.7% of non-immigrants earned less than
$10,000 per annum. Approximately 12% of immigrants and 18% of non-immigrants earned
$100,000 or more per annum (Figure 2c). Forty-eight percent of immigrants reported owning
their homes compared to 69% of native-born respondents.
Among immigrants, 82.64% had lived in the U.S. for more than 10 years, 10.74% had
30
4.2 Distributions of Weight, Diet and Physical Activity by Nativity Status
Table 2 shows BMI categories by nativity status,as well as distributions of diet and
physical activity variables by nativity statusof participants. The variables presented were chosen
as specific indicators of the dietary behavior and physical activity level of participants, as
previously described in section 3.2.
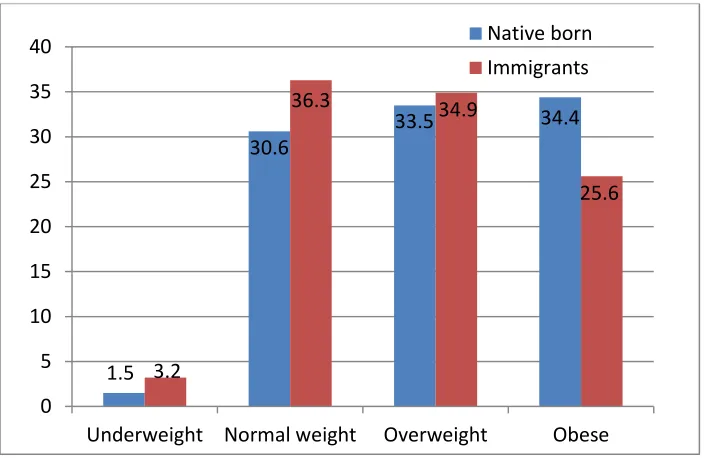
Regarding BMI, 33.06% of participants in the entire cohort (n = 3064) was obese and
33.78% was overweight. Most immigrants (36.3%) were in the normal weight category while
most native-born respondents (34.4%) were in the obese category. An estimated 25.65% of
immigrants were obese compared to 34.4% of native-born respondents (Figure 3).
Most immigrants (44.6%) had a daily fruit intake of 1 to 3 cups per day, while most
native-born participants (44.2%) had a daily fruit intake of up to 1 cup per day. Only 5.6% of
immigrants and 7.5% of the native-born took 3 or more cups of fruit daily. Approximately 7% of
immigrants and 8% of the native-born did not take any quantity of fruit daily. For vegetable
intake, most participants took 1 to 3 cups per day: 44.1% of immigrants vs. 46.8% of the
native-born. About 5% of immigrants and 4.8% of the native-born did not take any quantity of
vegetables daily. About 16% of immigrants and 19% of non-immigrants reported taking soda on
3 or more days per week, while 7.3% of immigrants and 9% of the native-born reported taking
soda every day. Thirty-seven percent of immigrants and 41.9% of the native-born reported not
taking soda at all.
Most participants in the cohort spent less than 5 hours per day (on the average) sitting to
watch TV, play computer games or surf the web: 80.4% of immigrants and about 71.7% of the
31
more per day on these leisure activities. About 42% of immigrants and 38.3% of native-born
participants took part in physical exercise of at least moderate intensity 1 to 3 times per week.
Meanwhile, 22.6% of immigrants and 26.3% of native-born participants did not engage in
physical activity of at least moderate intensity. Among participants who had some weekly
exercise of at least moderate intensity, the commonest length of exercise time was 30 to 60
minute per day; 73.2% of immigrants and 76.2% of the native-born who exercised were in this
category. Also, 46.36% of immigrants vs. 43.26% of native-born participants took part in
muscle strength training exercises at least once a week; while 53.64% of immigrants vs. 56.74%
of native-born respondents did not engage in any form of muscle training exercise.
4.3 Associations between Nativity Status and Outcome Variables of Interest
Three separate multivariable logistic regression analyses were performed to estimate
associations between nativity status and fruit intake, nativity status and vegetable intake, as well
as nativity status and soda intake (Table 3).
After adjusting for gender, age group, race/ethnicity, level of education, marital status
and income category, immigrants were more likely than native-born respondents to take some
quantity of fruits daily (Adjusted OR = 1.88; 95% CI: 1.07 - 3.32; p = 0.0290). Although
immigrants were also more likely than native-born participants to take some vegetables daily, the
association was not statistically significant (Adjusted OR = 1.29; 95% CI: 0.68 - 2.47; p =
0.4372). Furthermore, immigrants were less likely than native-born respondents to consume soda
every week (Adjusted OR = 0.74; 95% CI: 0.55 - 0.98; p = 0.0383).
Our multivariable analyses also revealed that female participants were more likely than
males to take some quantity of vegetables daily (Adjusted OR = 1.76; 95% CI: 1.17 - 2.65; p =
32
category but respondents with at least a college degree were more likely to have some daily
intake of fruits (Adjusted OR = 2.19; 95% CI: 1.16 - 4.09; p = 0.0137) and some daily intake of
vegetables (Adjusted OR = 2.31; 95% CI: 1.13 - 4.73; p = 0.0217). There was no statistically
significant difference in daily fruit consumption by income category but respondents who earned
$100,000 or above were more likely to take vegetables daily (Adjusted OR = 2.575; 95% CI:
1.00 - 6.58; p = 0.0481)
Females were less likely than males to take soda every week (Adjusted OR = 0.60; 95%
CI: 0.50 - 0.72; p <.0001). Also, older participants were less likely to take soda every week, and
this finding was especially notable when comparing the 50 – 64 year age category (Adjusted OR
= 0.56; 95% CI: 0.43 - 0.74; p <.0001) and the 65+ age category (Adjusted OR = 0.38; 95% CI:
0.29 - 0.51; p <.0001) to the 18 – 34 year age category. Respondents with at least a college
degree were less likely to drink soda every week (Adjusted OR = 0.57; 95% CI: 0.39 - 0.84; p =
0.0044). Respondents with an annual income of $100,000 or above were also less likely to drink
soda every week (Adjusted OR = 0.52; 95% CI: 0.34 - 0.78; p = 0.0015). Compared to
Caucasians, Hispanics (Adjusted OR = 2.00; 95% CI: 1.50 - 2.65; p <.0001) and Blacks
(Adjusted OR = 2.76; 95% CI: 2.08 - 3.64; p <.0001) were more likely to consume soda on a
weekly basis.
Furthermore, we conducted three separate multivariable logistic regression analyses for
associations between nativity status and time spent on sedentary leisure activities, nativity status
and moderate intensity physical exercise, as well as nativity status and muscle strength training.
After adjusting for gender, age group, race/ethnicity, level of education, marital status and
income category, immigrants were less likely than native-born respondents to spend 6 hours or
33
95% CI:0.42 - 0.97; p = 0.0350). Also, immigrants were more likely than native-born
respondents to engage in physical activity of at least moderate intensity, at least once a week
(Adjusted OR = 1.48; 95% CI: 1.07 - 2.05; p = 0.0192). Additionally, although the association
was not statistically significant, immigrants were more likely than native-born participants to
engage in muscle strength training at least one day per week (Adjusted OR = 1.28; 95% CI: 0.98
- 1.67; p = 0.0757).
Our multivariable analyses also revealed that participants in the 65+ age group were more
likely to spend 6 or more hours per day sitting down for leisure activities (Adjusted OR = 1.71;
95% CI: 1.16 - 2.52; p = 0.0066). Black participants were also more likely to engage in sedentary
leisure activities for 6 or more hours per day (Adjusted OR = 1.73; 95% CI: 1.28 - 2.35; p =
0.0004). Meanwhile, participants who earned $100,000 or above were less likely to spend 6 or
more hours on sedentary leisure activities (Adjusted OR = 0.45; 95% CI: 0.26-0.80; p = 0.0061).
Females were less likely than males to engage in physical exercise of at least moderate
intensity at least once a week (Adjusted OR = 0.74; 95% CI: 0.60 - 0.91; p = 0.0039). Compared
to participants with less than high school education, participants with high school diploma and
those who had some college education (Adjusted OR = 1.45; 95% CI: 1.02 - 2.05; p = 0.0375),
as well as those with at least a college degree (Adjusted OR = 2.23; 95% CI: 1.51 - 3.29; p
<.0001) were more likely to engage in some moderate intensity exercise at least weekly.
Participants in the 65+ age group were less likely to engage in moderate intensity exercise
weekly (Adjusted OR = 0.37; 95% CI: 0.26 - 0.52; p <.0001). Blacks were also less likely to
engage in moderate intensity exercise every week (Adjusted OR = 0.67; 95% CI: 0.51 - 0.88; p =
34
Participants who earned $100,000 or above were more likely to engage in muscle training
exercises at least weekly (Adjusted OR = 1.25; 95% CI: 0.89 - 1.77; p = 0.0061). Females were
less likely than males to engage in muscle strength training at least once a week (Adjusted OR =
0.75; 95% CI: 0.63 - 0.89; p = 0.0009), and participants in the 65+ age group were less likely to
engage in weekly muscle training exercises (Adjusted OR = 0.52; 95% CI: 0.40 - 0.69; p
<.0001). Overall, level of education was directly and significantly correlated with participation in
moderate intensity exercise but not with muscle strength training.
After including and controlling for disability in our additional models, immigrants were
still more likely than native born respondents to engage in physical activity of at least moderate
intensity, at least once a week (Adjusted OR = 1.46 ; 95% CI: 1.05 - 2.02; p = 0.0242).
Furthermore, after controlling for disability in our models, immigrants were still more likely than
native-born participants to engage in muscle strength training at least one day per week but the
association was not statistically significant (Adjusted OR = 1.266; 95% CI: 0.97 - 1.66; p =
35
CHAPTER V: DISCUSSION AND CONCLUSION
5.1 Discussion of Research Questions
One of the aims of the current thesis was to describe the demographics of the survey
participants by nativity status. A continued look at the demographics of immigrants will produce
a better understanding of the impact of recent immigration, and serve as a strategy for appraisal
of policies related to immigrants and immigration. It is known that immigrants currently make up
about one-sixth of the U.S. population and this was reflected in the composition of participants in
the HINTS 4 Cycle 3 survey which included roughly 17% immigrants.
The results of the current analysis showed that most immigrants were Hispanic,
corroborating previous reports that Mexicans make up the largest population of immigrants to
the U.S. As an example, more than four million Mexicans immigrated to the U.S. between 2000
and 2010.28 The analysis also showed that compared to native-bornrespondents,a greater
proportion of immigrants had college degrees or higher level of education. Historically,
compared to native-born residents, U.S. immigrants have been known to enjoy a benefit
regarding having at least a college level of education.Interestingly, our analysis also revealed
that a much greater proportion of immigrants had less than high school diploma compared to the
proportion among non-immigrants. This finding has also been previously documented in the
2011Current Population Survey (CPS) which showed roughly 28% of immigrants aged 25 to 65
years (compared to an estimated 7% of non-immigrants) without high school certificate.28Level
of education is a strong predictor of socio-economic class. It is therefore not surprising to have
observed in our analysis that compared to their native-born counterparts, a greater proportion of
36
immigrants were unemployed, and a lower percentage reported home ownership. Furthermore,
among participants who were employed, a higher proportion of immigrants had an annual
income less than $50,000. These findings support previous studies that have documented lower
income and higher poverty rates and welfare use among immigrants compared to native-born
U.S. residents.28 Notwithstanding that a large proportion of immigrants have low level of
education, most immigrants are gainfully employed as shown by the result of this analysis and by
prior research.28
The alarmingly trends of obesity in the U.S. was apparent in our results. An estimated
34.4% of native-born participants were obese, reflecting the current reported obesity prevalence
rate of 34.9%.48 Although lower than the proportion among non-immigrants, a 25% proportion of
obese participants among immigrants is a cause for concern. Public health attention should
continually be directed at reducing obesity prevalence across board. The higher proportion of
underweight observed among immigrant participants could reflect the heterogeneity of country
of origin; many immigrants originate from developing countries with high poverty levels and
food scarcity due to famine.
Our bivariate analyses showed that proportions for indicators of diet were similar or close
between the 2 groups of interest: some daily fruit intake (93.05% among immigrants vs 92.09%
among non-immigrants), some daily vegetable intake (94.79% among immigrants vs 95.18%
among non-immigrants), and some weekly soda intake (7.28% among immigrants vs 9% among
non-immigrants). However, following adjustments in multivariable analyses, immigrants were
significantly more likely than non-immigrants to take fruits daily and significantly less likely to
take soda every week. This trend follows current recommendations for healthy living by various
37
were more likely to engage in physical activity of at least moderate intensity at least once a
week, as well as less likely to spend 6 or more hours on TV, games and web surfing. In a prior
study of low-income, minority families, Cespedes et al (2013) had reported that “non-US-born
(vs US-born) parents had less screen exposure.” 34 Considering the specific directions of these
proximal determinants of obesity among immigrant participants, it is not surprising that most
immigrants were in the normal weight category compared to most native-born participants in the
obese category. The specific directions of dietary and physical activity behavior observed among
immigrants in this cohort also very likely contribute to the well-documented lower risk of obesity
among U.S. immigrants.
Notwithstanding the finding that immigrants in the survey engage in healthier dietary
behavior and more physical activity than native-born respondents, it is noteworthy that up to 7%
and 5% of participants have no daily intake of fruits and no daily intake of vegetables
respectively. Furthermore, 16 - 19% of participants consume soda on 3 or more days per week.
Evidence based research has progressively showed that intake of fruits and vegetables is critical
to promotion of good healthandthat diets rich in fruits and vegetables reduce the risk of obesity,
cancer and other chronic diseases.49Furthermore, soda is one of the majorsources of added
sugars in the diet of the American populace and excess sugar intake has been linked to numerous
metabolic problems, adverse health outcomes and deficits of essential nutrients. The American
Heart Association (AHA) recommends that notwithstanding intake of diets rich in fruits and
vegetables, minimizing intake of beverages and foods with added sugars is necessary for healthy
living.50
Moreover, up to 22% and 26% of immigrants and native-born respondents respectively
38
and roughly 54% and 57% of immigrant and native-born participants respectively did not engage
in any muscle training exercise. These numbers are quite concerning, considering the amount of
flexibility woven into the current guidelines for physical activity for Americans. Current
recommendations are 150 minutes of moderate exercise per week and at least two days of muscle
training exercise per week. Public health researchers and practitioners need to continue vigorous
education initiatives and policy makers need to enact policies that promote greater levels of
physical activity among the populace.
Unfortunately, effects of acculturation among the study participants could not be assessed
due to the small sample size of immigrants who have lived in the U.S. for 15 or more years
which under-powered the analysis. Future studies
5.2 Study Strengths and Limitations
To our knowledge, our analysis is the first detailed review of dietary and physical activity
behavior comparing immigrants and native-born U.S. adults. The HINTS dataset has been
validated to capture a representative proportion of U.S. adults regarding their health practices
including diet and physical activity behavior. Nonetheless, our findings have important
limitations that should be considered. The retrospective nature of this thesis limits our ability to
full control for potential biases and confounders. Participants included in the dataset cannot be
followed longitudinally to determine long term outcomes. Social and personal factors of the
participants that influenced the choice of specific health and dietary behaviors cannot be
ascertained from the analysis of this dataset. Although we observed missing data with a number
of the variables utilized, the amount of missing data was small and is unlikely to significantly
39
provides a great insight into major differences in dietary and physical activity behavior between
U.S. immigrants and non-immigrants, and serves as a template on which more robust studies on
obesity-related behavior can be built.
5.3 Conclusion and Recommendations
Analysis of proximal determinants of obesity among immigrant and native-born U.S.
adults showed the association of healthy lifestyle and behavioral choices with lower proportions
of obesity among immigrants. In the general cohort, increase in age was significantly associated
with increase in obesity-related behavior, while higher levels of education and higher income
were associated with decrease in obesity-related behavior.
Previous studies have shown that notwithstanding obesity risk status, most individuals
will derive benefits from better nutrition, healthy eating choices and increased levels of physical
activity. Public health researchers and practitioners need to continue to educate the general
public about the health benefits of healthy diets and physical activity in various forms, while
policy makers need to continue to promote policies that make it easier for the general public to
engage in positive health behavior. Researchers, practitioners and policy makers need to develop
targeted strategies and focus attention on keeping immigrants in the loop of positive health
behavior, encouraging older adults to engage in more physical activity, and increasing the level
of education and the earning power of the general public.
A significant number of acculturation studies highlighted the role of community identity
and homogeneity in integration of immigrants in their host environments. Immigrants who stay
together tend to assimilate the sociocultural milieu less than their counterparts living in mixed
40
promoting active lifestyles among immigrants. Grassroots efforts can exploit the social fabric
among immigrants to perpetuate proximal determinants that protect against obesity among newly
arrived immigrants, and encourage longer-stay immigrants towards reduction in obesity risks.
The recent attempts to reward healthy lifestyle choices in the economic models of
insurance policies should be tailored to facilitate favorable proximal determinants among
immigrants. Most insurance policies currently have lower premiums for non-smokers, and
incentives targeting healthy diets and physical activity among their clientele. The factors
identified in this study can be integrated in medical, life and other insurance policies towards
promoting behavioral characteristics that prevent development of obesity.
Prospective studies with larger samples and adequate follow up of immigrants from time
of entry into the U.S. onwards are crucial in exploring the role of various social, economic,
cultural and demographic factors while eliminating the apparent biases of a retrospective
analysis. Also, the advantages of focus group discussions among immigrants can be harnessed
and would include more accurate evaluation of the role of proximal determinants of obesity in
increased obesity risks with increased length of stay of immigrants in the U.S. Additionally,
studies limited to participants from specific ethnic, racial and nationality groups would enable a
more robust mechanism for ascertaining the impact of demographic characteristics on obesity
risks. Future research embracing these types of studies would be useful in expanding knowledge
and understanding of elements that may differentiate U.S. immigrants from native born from
41
Figure 1: Distribution of demographic characteristics among participants in HINTS 4 cycle 3.
0 10 20 30 40
18-34 years
35-49 years
50-64 years
≥65 years
0 10 20 30 40 50 60
<HS HS-Coll ≥Coll
0 10 20 30 40 50
<10k 10k -<50k
50k -<100k
≥100k 1A: Age distribution
1B: Level of Education
42
Figure 2: Distribution of demographic characteristics by nativity status of participants in HINTS 4 cycle 3.
Immigrants
17%
Native born 83%
0 10 20 30 40 50 60
<High School HS - Some Coll College
Native born
Immigrant
0 10 20 30 40 50 60
<10k 10k - <50k 50k - <100k ≥100k Native Born Immigrant 2A: Nativity status
2B: Level of Education
43
Figure 3: Weight distribution by nativity status of participants in HINTS 4 cycle 3.
1.5
30.6
33.5 34.4
3.2
36.3 34.9
25.6
0 5 10 15 20 25 30 35 40
44
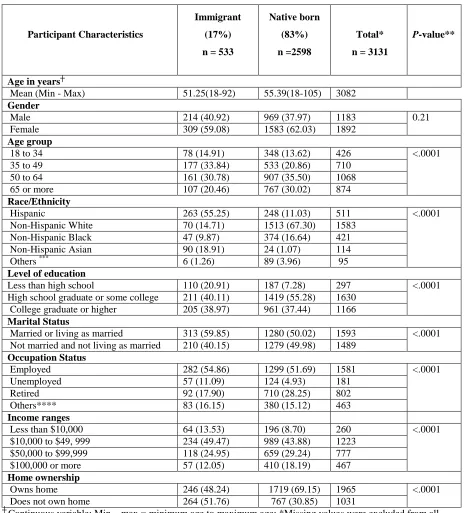
Table 1: Demographic characteristics by nativity status of participants in HINTS 4 cycle 3.
Participant Characteristics
Immigrant
(17%)
n = 533
Native born
(83%)
n =2598
Total*
n = 3131
P-value**
Age in years┼
Mean (Min - Max) 51.25(18-92) 55.39(18-105) 3082
Gender
Male 214 (40.92) 969 (37.97) 1183 0.21
Female 309 (59.08) 1583 (62.03) 1892
Age group
18 to 34 78 (14.91) 348 (13.62) 426 <.0001
35 to 49 177 (33.84) 533 (20.86) 710
50 to 64 161 (30.78) 907 (35.50) 1068
65 or more 107 (20.46) 767 (30.02) 874
Race/Ethnicity
Hispanic 263 (55.25) 248 (11.03) 511 <.0001
Non-Hispanic White 70 (14.71) 1513 (67.30) 1583
Non-Hispanic Black 47 (9.87) 374 (16.64) 421
Non-Hispanic Asian 90 (18.91) 24 (1.07) 114
Others *** 6 (1.26) 89 (3.96) 95
Level of education
Less than high school 110 (20.91) 187 (7.28) 297 <.0001
High school graduate or some college 211 (40.11) 1419 (55.28) 1630
College graduate or higher 205 (38.97) 961 (37.44) 1166
Marital Status
Married or living as married 313 (59.85) 1280 (50.02) 1593 <.0001
Not married and not living as married 210 (40.15) 1279 (49.98) 1489 Occupation Status
Employed 282 (54.86) 1299 (51.69) 1581 <.0001
Unemployed 57 (11.09) 124 (4.93) 181
Retired 92 (17.90) 710 (28.25) 802
Others**** 83 (16.15) 380 (15.12) 463
Income ranges
Less than $10,000 64 (13.53) 196 (8.70) 260 <.0001
$10,000 to $49, 999 234 (49.47) 989 (43.88) 1223
$50,000 to $99,999 118 (24.95) 659 (29.24) 777
$100,000 or more 57 (12.05) 410 (18.19) 467
Home ownership
Owns home 246 (48.24) 1719 (69.15) 1965 <.0001
Does not own home 264 (51.76) 767 (30.85) 1031
┼ Continuous variable; Min – max = minimum age to maximum age; *Missing values were excluded from all
45
Table 2:Distributions of selected variables (indicators of dietary behavior and physical activity level, and BMI) by nativity status of participants in HINTS 4 cycle 3.
Selected Variables Immigrant
(17%)
n = 533
Native-born
(83%)
n = 2598
Total┼
n = 3131
P -value┼┼
Daily Fruit intake*
None 36 (6.95) 202 (7.91) 238 0.1962
Up to 1 cup per day 222 (42.86) 1128 (44.15) 1350
1 to 3 cups per day 231 (44.59) 1033 (40.43) 1264
3 or more cups per day 29 (5.60) 192 (7.51) 221
Daily Vegetable intake*
None 27 (5.20) 123 (4.81) 150 0.6147
Up to 1 cup per day 210 (40.46) 1013 (39.63) 1223
1 to 3 cups per day 229 (44.12) 1195 (46.75) 1424
3 or more cups per day 53 (10.21) 225 (8.80) 278
Soda intake*
None 195 (37.36) 1082 (41.95) 1277 0.0557
Less often than 1 day a week
143 (27.39) 594 (23.03) 737
1-2 days a week 97 (18.58) 402 (15.59) 499
3-4 days a week 38 (7.28) 192 (7.44) 230
5-6 days a week 11 (2.11) 77 (2.99) 88
Every day 38 (7.28) 232 (9.00) 270
Average daily hours spent sitting (TV/movies/web/computer games)**
None 18 (3.67) 43 (1.73) 61 <.0001
Less than 5 hours per day 394 (80.41) 1782 (71.77) 2176
5 to 14 hours per day 73 (14.90) 617 (24.85) 690
15 or more hours per day 5 (1.02) 41 (1.65) 46
Physical activity of moderate intensity per week**
None 118 (22.61) 673 (26.28) 791 0.1768
1 to 3 times per week 217 (41.57) 982 (38.34) 1199
4 or more times per week 187 (35.82) 906 (35.38) 1093
Length of exercise per day of exercise*** Less than 30 minutes per
day
64 (25.20) 233 (20.71) 297 0.1420
30 to 60 minutes per day 186 (73.23) 857 (76.18) 1043
More than 60 minutes per day
4 (1.57) 35 (3.11) 39
Total*** 254 1125 1379**
BMI categories <.0001
Underweight (<18.5) 16 (3.21) 36 (1.43) 52
Normal weight (18.5-24.9) 181 (36.27) 773 (30.63) 954
Overweight (25-29.9) 174 (34.87) 846 (33.52) 1020
Obese (≥30) 128 (25.65) 869 (34.43) 997