Educational Policy Studies Dissertations Department of Educational Policy Studies
Spring 1-9-2015
Modeling Public Satisfaction with School Quality:
A Test of the American Customer Satisfaction
Index Model
Anita Berryman
Follow this and additional works at:https://scholarworks.gsu.edu/eps_diss
This Dissertation is brought to you for free and open access by the Department of Educational Policy Studies at ScholarWorks @ Georgia State University. It has been accepted for inclusion in Educational Policy Studies Dissertations by an authorized administrator of ScholarWorks @ Georgia State University. For more information, please [email protected].
Recommended Citation
Berryman, Anita, "Modeling Public Satisfaction with School Quality: A Test of the American Customer Satisfaction Index Model." Dissertation, Georgia State University, 2015.
This dissertation, MODELING PUBLIC SATISFACTION WITH SCHOOL QUALITY: A
TEST OF THE AMERICAN CUSTOMER SATISFACTION INDEX MODEL, by ANITA
FAUST-BERRYMAN, was prepared under the direction of the candidate’s Dissertation
Advisory Committee. It is accepted by the committee members in partial fulfillment of the
requirements for the degree, Doctor of Philosophy, in the College of Education, Georgia State
University.
The Dissertation Advisory Committee and the student’s Department Chairperson, as
representatives of the faculty, certify that this dissertation has met all standards of excellence and
scholarship as determined by the faculty. The Dean of the College of Education concurs.
C. Kevin Fortner, Ph.D. Committee Chair
Sheryl A. Gowen, Ph.D. Hongli Li, Ph.D.
Committee Member Committee Member
Theodore H. Poister, Ph.D. Committee Member
Date
William L. Curlette, Ph.D.
Chairperson, Department of Educational Policy Studies
Paul A. Alberto, Ph.D. Dean
By presenting this dissertation as a partial fulfillment of the requirements for the advanced degree
from Georgia State University, I agree that the library of Georgia State University shall make it
available for inspection and circulation in accordance with its regulations governing materials of
this type. I agree that permission to quote, to copy from, or to publish this dissertation may be
granted by the professor under whose direction it was written, by the College of Education’s
Di-rector of Graduate Studies, or by me. Such quoting, copying, or publishing must be solely for
scholarly purposes and will not involve potential financial gain. It is understood that any copying
from or publication of this dissertation which involves potential financial gain will not be allowed
without my written permission.
All dissertations deposited in the Georgia State University library must be used in accordance
with the stipulations prescribed by the author in the preceding statement. The author of this
dissertation is:
Anita Faust-Berryman 8995 Brockham Way Alpharetta, GA 30022
The director of this dissertation is:
C. Kevin Fortner, Ph.D.
Department of Educational Policy Studies College of Education
Anita Faust-Berryman
ADDRESS: 8995 Brockham Way
Alpharetta, GA 30022
EDUCATION:
PROFESSIONAL EXPERIENCE:
Summer 2012 Graduate teaching assistant
College of Education
Georgia State University, Atlanta, GA
2011-present Graduate research assistant
College of Education
Georgia State University, Atlanta, GA
2009-2011 Graduate research assistant
Andrew Young School of Policy Studies Georgia State University, Atlanta, GA
2006-2009 Research and public policy project consultant Andrew Young School of Policy Studies
2003-2005 Staff Trainer
CheckFree Corporation, Norcross, GA
2001-2003 Human Resource Development Consultant
United Parcel Service, Atlanta, GA
PRESENTATIONS AND PUBLICATIONS:
Poister, T. H., Thomas, J. C., Berryman, A. F. (2013). Reaching out to stakeholders: The Georgia DOT 360 degree assessment model, Public Performance & Management Review, 37, 302 – 328.
Ph.D. 2014 Georgia State University
Educational Policy Studies Masters Degree 2000 Georgia State University
Human Resource Development Bachelors Degree 1987 University of Virginia
for Education Finance and Policy, Boston, MA.
Poister, T. H., Thomas, J. C., & Berryman, A. F. (2011, June). Reaching out to stakeholders: Lessons from a 360-degree organization assessment. Paper presented at the meeting of the Public Management Research Conference, Syracuse, NY.
Poister, T. H., Edwards, L. H., Edwards, J., Arnett, S., & Berryman, A. F. (2010, November). The impact of strategic planning on organizational performance. Paper presented at the meeting of the Association for Public Policy and Management, Boston, MA.
Berryman, A. F., & Gowen, S. (2010, October). The effect of expectations and expectancy con-firmation/disconfirmation on parents’ satisfaction with teacher quality: A proposed mod-el. Paper presented at the meeting of the Georgia Educational Research Association, Sa-vannah, GA.
Poister, T. H., Edwards, L. H., Edwards, J., Arnett, S., & Berryman, A. F. (2010, April). The im-pact of strategic stance on program outcomes in local transportation agencies. Paper presented at the meeting of the Midwest Political Science Association, Chicago, IL.
Poister, T. H., Thomas, J. C., & Berryman, A. F. (2008, March). Reaching out to stakeholders: The Georgia DOT 360-degree assessment model. Paper presented at the meeting of the American Society for Public Administration, Dallas, TX.
PROFESSIONAL SOCIETIES AND ORGANIZATIONS
SATISFACTION INDEX MODEL
by
ANITA FAUST-BERRYMAN
Under the Direction of C. Kevin Fortner, Ph.D.
ABSTRACT
Within the education literature, satisfaction with the quality of public schools has
received very little scholarly attention. Conversely, in the public administration literature, citizen
satisfaction with public services has been studied since the late 1970s and in the past decade,
models based on expectancy disconfirmation theory have increasingly been utilized. Of these
models, the American Customer Satisfaction Index (ACSI) model goes beyond satisfaction to
examine the effect of satisfaction on behavioral consequences, such as the desire to move away
from a locality, which may be of inherent interest to policymakers and public managers. This
study extends the research on the ACSI model in the public sector by examining the effects of
expectations, perceived quality, perceived disconfirmation, and grade on satisfaction with school
recommend public schools to others, are also examined. Using existing data from a public
opinion poll, models for two groups of participants were estimated via regression-based path
analysis. The study found a small negative effect of expectations on satisfaction and a larger role,
directly and indirectly, of perceived quality on satisfaction judgments. Addition of the grade
variable dispersed the effect of perceived quality but the total effect of the variable was
unchanged. As theorized, satisfaction had a strong negative effect on the desire to choose a
different schooling option and a strong positive effect on the willingness to recommend public
schools to others. Suggestions for further research include a qualitative study incorporating
interviews and focus groups to identify the information sources utilized in making satisfaction
decisions and how individuals’ synthesize various pieces of information to determine whether
their expectations have been met. In addition, use of objective measures, such as test scores,
along with subjective measures may provide increased understanding of the influence of
exogenous variables on the model.
SATISFACTION INDEX MODEL
by
ANITA FAUST-BERRYMAN
A Dissertation
Presented in Partial Fulfillment of Requirements for the
Degree of
Doctor of Philosophy
in
Educational Policy Studies
in
the Educational Policy Studies Department
in
the College of Education
Georgia State University
Copyright by Anita Faust-Berryman
To all those who have gone before me, I stand on the shoulders of giants.
For Alfonz.
ii
ACKNOWLEDGMENTS
I gratefully acknowledge the support and encouragement that I have received from many
people throughout this project and my doctoral program. First, I thank Dr. Kevin Fortner for his
patience, insight, and guidance. It has been my privilege to have him as a mentor. I am deeply
appreciative of the contributions of my committee members, Drs. Sheryl Gowen, Hongli Li, and
Theodore Poister.
I am so thankful for the support of my husband Bryan and my son A.J. for going along
with me on this journey. I appreciate their understanding of evening classes, early mornings, late
nights, and missed dinners.
In addition, I am thankful for my parents, Preston and Mary Faust, and my brother, Neal,
iii
TABLE OF CONTENTS
LIST OF TABLES ... V
LIST OF FIGURES ... VI
GLOSSARY... VIII
1 INTRODUCTION... 1
Assumptions and Limitations ... 3
2 REVIEW OF THE LITERATURE ... 4
Previous Studies of Public Satisfaction with School Quality ... 4
Expectancy Disconfirmation Theory and Models ... 13
Testing of Customer Satisfaction Models in Public Administration ... 21
Hypotheses ... 46
3 METHODOLOGY ... 49
Source ... 49
Participants ... 49
Survey Instrument ... 51
Procedures ... 56
Plan of Analyses ... 59
Equations ... 63
4 RESULTS ... 66
Normality of the Variables ... 66
Models with Subtractive Disconfirmation ... 72
Models with Perceived Disconfirmation ... 72
ACSI-D Excluding the Grade Variable ... 72
Relationships and effects of the antecedents of satisfaction. ... 74
iv
Statistical significance of paths between models by group. ... 76
Post-estimation tests of model fit. ... 76
ACSI-D Including the Grade Variable ... 78
Relationships and effects of the antecedents of satisfaction. ... 81
Behavioral outcomes of satisfaction. ... 82
Statistical significance of paths between models by group. ... 83
Post estimation tests for assessing model fit. ... 83
5 DISCUSSION ... 86
Limitations of the Study ... 87
Comparison with Models Excluding the Grade Variable ... 89
Antecedents of satisfaction. ... 89
Behavioral outcomes of satisfaction. ... 92
Statistical significance of differences between path coefficients by group... 93
Comparing Models Including the Grade Variable ... 94
Antecedents of satisfaction. ... 94
Statistical significance of path coefficients between groups. ... 97
Conclusions ... 97
Significance of the Study ... 99
Suggestions for Further Research ... 100
REFERENCES ... 103
v LIST OF TABLES
Table 1. Descriptive statistics of the sample by group. ... 56
Table 2. Correlation matrix of the study variables. ... 58
Table 3. Path coefficients and diagnostics for models excluding the grade variable. ... 73
vi LIST OF FIGURES
Figure 1. Expectancy disconfirmation model. (Adapted from Oliver, 1980). ... 13
Figure 2. Expectancy disconfirmation with performance model. (Adapted from Oliver, 1997). . 15
Figure 3. American Customer Satisfaction Index (ACSI) model. (Reproduced from Fornell et al. 1996). ... 16
Figure 4. ACSI Government Services model. ... 20
Figure 5. ACSI model, NYC 2000. (Adapted from Van Ryzin et al. 2004)). ... 24
Figure 6. ACSI model, NYC 2001. (Adapted from Van Ryzin et al. 2004). ... 25
Figure 7. EDP model, NYC 2001 data, standardized coefficients. (Adapted from Van Ryzin, 2004). ... 27
Figure 8. EDP model, nationwide panel survey data with subtractive disconfirmation, standardized coefficients. (Adapted from Van Ryzin, 2006). ... 31
Figure 9. EDP model, nationwide panel survey data, perceived disconfirmation, standardized coefficients. (Adapted from Van Ryzin, 2006). ... 32
Figure 10. EDP model, nationwide panel survey data, subtractive and perceived disconfirmation, standardized coefficients. (Adapted from Van Ryzin, 2006). ... 33
Figure 11. Modified EDP model with grade. Applied to satisfaction with road condition and ride quality, standardized coefficients. (Adapted from Poister & Thomas, 2011). ... 37
Figure 12. Modified EDP model with antecedents of expectations. ... 41
Figure 13. EDP model, randomized experiment, standardized coefficients. (Adapted from Van Ryzin, 2013). ... 43
Figure 14. Diagram of paths identified for regression equations... 63
vii
Figure 16. Histograms of perceived quality variable by group. ... 67
Figure 17. Histograms of perceived disconfirmation variable by group. ... 68
Figure 18. Histograms of satisfaction variable by group. ... 69
Figure 19. Histograms of the grade variable by group. ... 69
Figure 20. Histograms of the likely to recommend schools variable by group. ... 70
Figure 21. Histograms of the likely to choose a different school variable by group. ... 71
Figure 22. Parent group ACSI-D with perceived disconfirmation. ... 73
Figure 23. Non-parent group ACSI-D with perceived disconfirmation. ... 74
Figure 24. Chow test F-ratios indicating statistically significant differences of paths between groups. ... 76
Figure 25. Plots of selected regression residuals for the parent group. ... 77
Figure 26. Plots of selected regression residuals for the non-parent group. ... 77
Figure 27. Parent group ACSI-D with perceived disconfirmation including grade variable. ... 80
Figure 28. Non-Parent group ACSI-D with perceived disconfirmation including the grade variable. ... 81
Figure 29. Chow test F-ratios for ACSI-D models including the grade variable. ... 83
Figure 30. Plots of selected regression residuals for the parent group. ... 84
viii GLOSSARY
Behavioral outcomes: A behavior that is the outcome of one’s satisfaction; in this
study, used interchangeably with consequences of satisfaction
Comparative referent: A standard or ideal to which an individual compares a service,
product, or experience
Consequences of satisfaction: A result or action of one’s satisfaction; in this study, used
interchangeably with behavioral outcomes of satisfaction
Consumer: An individual who purchases or uses goods or services; in this
study, used interchangeably with customer
Consumer satisfaction: A measure of the extent to which goods or services meet
consumer’s expectations
Customer: An individual who purchases or uses goods or services; in this
study used interchangeably with consumer
Expectations: An individual’s belief about the quality of a good or service;
how good something will be or should be
Negative disconfirmation: An instance in which an individual’s perception of the quality
of public schools falls short of his or her expectations of how
good the quality of public schools should be; in perceived
disconfirmation, the individual would indicate that school
quality fell short of their expectations; in subtractive
disconfirmation, the individual would assign a higher rating to
expectations as compared to perceived quality so that when the
expectations rating is subtracted from the perceived quality
rating, the result is a negative number
Non-parent group: Individuals who responded they did not currently have children
attending public schools in Georgia
Objective data: Data that are directly observable or measurable
Parent group: Individuals who responded they currently had children
ix
Perceived disconfirmation: A method of measuring the gap between participants
expectations of school quality and their perceptions of school
quality; participants were asked if the perceived quality of
public schools fell short, met, or exceeded their expectations
Perceived quality: An individual’s perception of the quality of public schools
Positive disconfirmation: An instance in which an individual’s perception of the quality
of public schools exceeds his or her expectations of how good
the quality of public schools should be; in perceived
disconfirmation, the individual would indicate that school
quality exceeded their expectations; in subtractive
disconfirmation, the individual would assign a lower rating to
expectations as compared to perceived quality so that when the
expectations rating is subtracted from the perceived quality
rating, the result is a positive number
Satisfaction: A feeling or emotional state experienced based on whether or
not an individual’s expectations have been fulfilled; if the
expectations were fulfilled, the individual is satisfied; if the
expectations were not fulfilled, the individual is dissatisfied
Subjective data: Data that are based on an individual’s personal opinions,
perceptions, or beliefs
Subtractive disconfirmation: A method of measuring the gap between participants
expectations of school quality and their perceptions of school
quality; the expectations variable rating is subtracted from the
perceived quality variable rating, perceived quality minus
expectations; the resulting gap score can be positive, negative,
1 INTRODUCTION
Satisfaction with the quality of public schools has received very little scholarly attention
in the education literature, with only a handful of studies that have examined the topic
(Friedman, Bobrowski, & Geraci, 2006; Friedman, Bobrowski, & Markow, 2007; Thompson,
2003). These recent studies have been concerned with identifying factors that influence parent
satisfaction with public schools and relate the importance of parent satisfaction with public
schools to changes in the education landscape through the No Child Left Behind (NCLB) act of
2002, which gave parents whose children attended chronically underperforming schools more
school choice options by allowing them to move their children to a higher performing school
(U.S. Department of Education, 2002). These school choice options continue under the current
Blueprint for Reform (U.S. Department of Education, 2010).
Within the public administration literature, studies of citizen satisfaction with public
services began appearing in the late 1970s. The early studies aimed at identifying a relationship
between objective measures of public performance and subjective citizen satisfaction with the
performance of public services (Brown & Coulter, 1983; Parks, 1984; Stipak, 1979) were unable
to find significant relationships between the two types of data due to incongruence between the
measures (Kelly, 2003), model misspecification (Parks, 1984), and high levels of aggregation of
the objective data (Parks, 1984). The lack of a relationship between objective performance
measures and citizen satisfaction led scholars to assert that citizens were not aware of the levels
of service they were receiving (Stipak, 1979, 1980). Thus, citizens were cast as unreliable
sources for evaluating the quality of public services (Kelly & Swindell, 2002). Drawing on the
suggestion from other researchers for using models that describe how citizens form their
the expectancy disconfirmation model that had been widely used in the private sector (Erevelles
& Leavitt, 1992; Oliver, 1997) to see if it was viable for explaining citizen satisfaction. In
essence, the model goes beyond viewing satisfaction judgments as being based solely on one’s
experience with the performance of a product or service. The model views satisfaction judgments
as a process in which consumers first compare their prior expectations of the product or service
to the performance of the product or service which then results in a satisfaction judgment (Van
Ryzin, 2004). Several tests of expectancy disconfirmation models within the public
administration literature have found support for the utility of this type of model for explaining
citizen satisfaction with public services despite having confounded results (Morgeson, 2012;
Poister & Thomas, 2011; Van Ryzin, 2004, 2006, 2013).
Charbonneau and Van Ryzin (2012) indicate that more school districts are conducting
surveys of parents regarding their satisfaction with schools. At the same time, because public
schools constitute a large part of public expenditures and service provision, researchers in public
administration are beginning to focus on parent satisfaction with schools, as evidenced by recent
studies by Charbonneau and Van Ryzin (2012) and Favero and Meier (2013). These two studies
have provided initial evidence of a positive relationship between the schools’ objective
performance measures and parents’ satisfaction with school quality—in short, there is some
commonality between how schools and parents measure school quality (Charbonneau & Van
Ryzin, 2012; Favero & Meier, 2013).
Recognizing the importance of this initial evidence of agreement between schools and
parents regarding the quality of schools, coupled with support for expectancy disconfirmation
models in explaining citizen satisfaction, the goal of this study is to extend the body of research
also allows for examining the behavioral outcomes of satisfaction. As Van Ryzin et al. (2004)
argued, the behavioral outcomes of satisfaction are of inherent interest to policymakers and
administrators. This study seeks to estimate measured variable path models for two groups of
participants—those with children attending public school and those without children attending
public school.
Assumptions and Limitations
One of the primary assumptions of the study is that participants are familiar with public
schools, and particularly, their local public schools. It is assumed that most adults will have
familiarity with public schools, even if they do not currently have children attending public
schools, because they may have had children who attended public schools in the past or the
participant may have attended public school. A limitation of the study is the use of
single-indicators instead of multiple single-indicators to measure each construct. Use of single single-indicators
increases the potential for bias and skewness that might be mitigated by the use of multiple
2 REVIEW OF THE LITERATURE
In this section, studies from three primary literature streams will be presented. First,
within the education literature, empirical studies and published reports relevant to satisfaction
with public schools will be reviewed. The empirical studies tend to focus on parent satisfaction
with the school(s) attended by their child(ren). An annual survey conducted by the Gallup Poll
organization asks a nationwide sample which includes individuals who do not have children
attending school, as well as parents with children attending schools, to provide their opinions on
many topics pertinent to public schools. From this annual survey, topics specifically related to
satisfaction with public schools will be reviewed. Next, studies in the public administration
literature stream have examined public satisfaction with services for almost 40 years. In the past
decade, a new line of research in this area has explored expectancy disconfirmation theory and
variations of expectancy disconfirmation models as a means of explaining public satisfaction
with services. Expectancy disconfirmation theory and the related models originated in research
related to marketing, thus, a small portion of marketing literature relevant to the theory and
models will be reviewed. Third, from the public administration literature stream, studies related
to the testing of expectancy disconfirmation models will be reviewed. Finally, research
hypotheses for the current study will be presented.
Previous Studies of Public Satisfaction with School Quality
A few authors have noted the lack of studies examining public satisfaction with school
quality (Charbonneau & Van Ryzin, 2012; Favero & Meier, 2013; Friedman, Bobrowski, &
Geraci, 2006). Salisbury, Branson, Altreche, Funk, and Broetzmann (1997) suggest the topic has
not been well studied due to challenges associated with viewing the public as customers,
and quality. Alternatively, Henig (2008) asserts that satisfaction with schools is discounted as a
soft target because most parents were already satisfied with their child’s school. Within the
education literature, the few studies that have been conducted have utilized methods ranging
from descriptive statistics (Carnevale & Desrochers, 1999) to multiple regression to identify
predictors of overall satisfaction (Friedman, Bobrowski, & Markow, 2007), and
differences/similarities in parent satisfaction by ethnicity (Friedman et al. 2006; Thompson,
2003). Other studies have examined parent satisfaction with charter schools (Buckley &
Schneider, 2006), the relationship between exercising school choice options with parent
satisfaction, involvement, and influence within the school (Hausman & Goldring, 2000), and
comparisons of the levels of parent satisfaction between traditional schools and charter schools
(Schneider & Buckley, 2003; Wohlstetter, Nayfack, & Mora-Flores, 2008). Because these
studies examine parent satisfaction after making a school choice decision instead of focusing on
how satisfaction impacts a behavioral outcome, these studies are not included in the scope of this
paper.
Since 1970 (Gallup & Elam, 1981), the annual Gallup Poll of the Public’s Attitudes
Toward the Public Schools has provided the most in-depth look at school quality from both the
general public and parents with children attending schools. In 1974 (Gallup & Elam, 1981), the
poll began asking participants to grade the quality of their local public schools, and 48 percent
gave A or B grades. Over time, similar survey items were introduced that asked participants to
grade schools for the nation as a whole (Gallup & Elam, 1981) and to grade the school their own
children attended (Gallup, 1985). This series of survey items yielded several findings that have
remained constant over many replications of the survey. In the year of inception, when asked to
compared to 36 percent grading their local schools with an A or B (Gallup & Elam, 1981).
Similarly, in the year of inception, when asked to grade the school attended by their own
children, 71 percent of parents gave grades of A or B compared to 52 percent of parents grading
local schools with an A or B, and 32 percent of parents graded the nations’ schools as a whole
with an A or B (Gallup, 1985). Participants who did not have children attending public or private
schools were less likely to give grades A or B, with 33 percent assigning these grades to local
schools and 23 percent assigning these grades to the nations’ schools (Gallup, 1985). These
differences in the ratings from parents and non-parents continued through 2007 when the
pollsters stopped reporting the findings for these two groups (Rose & Gallup, 2007). With regard
to the grading differences between the two groups, Gallup (1985) indicated that those who were
most closely in touch with public schools held more favorable views of them. Another finding
indicated that parents whose children achieved above average were more likely to give grades of
A or B (84%) compared to 60 percent of parents whose children were average or below-average
(Gallup, 1985).
Tuck (1995), using means from weighted ranked scale survey data from parents of the
District of Columbia school system, found that parents were moderately satisfied with their
children’s schools, with 73.8 percent rating the school as good or excellent. The only statistically
significant difference in satisfaction between parent groups was related to the achievement levels
of their children. Similar to the findings reported by Gallup (1985), parents of children with
higher levels of achievement indicated higher satisfaction with the school. In contrast, studying
the Austin, Texas school district, Falbo et al. (2003) reported no statistically significant
differences between the mean satisfaction levels of Hispanic and low-income parents whose
education programs. Thus, significant differences in satisfaction are not related to student
achievement in a simple linear manner. Other notable findings from the Falbo et al. study include
a statistically significant correlation (r (1151) = .74, p<0.0001) between parents’ ratings of the
overall satisfaction measure and parents’ ratings of the extent to which the quality of education at
the school met their expectations. In addition, the study found statistically significant differences
between ethnic groups in their willingness to recommend their school to others. Black parents
were significantly less likely to be willing to recommend their school to others compared to
White parents (z = 3.70, p<0.001), Asian American parents (z = 2.55, p<0.01), and Hispanic
parents (z = 4.82, p<0.0001). Neither the study by Tuck (1995) nor Falbo et al. specifically
identified the types of analyses that were conducted; but information provided within the reports
indicate appropriate use of t-tests and ANOVA procedures.
The academic studies discussed below employ more sophisticated instruments and
analytic techniques than the previously discussed reports. Also, from a policy perspective,
studies published after 2002 begin to examine parent satisfaction and its importance in
relationship to the No Child Left Behind (NCLB) act, which provided more school choice
options by allowing parents to move their children from substandard schools to higher
performing schools (U.S. Department of Education, 2002).
In order to examine variables that predicted the satisfaction of Black parents with the
school system, Thompson (2003) performed bivariate correlations and multiple regression
analyses on survey data from 11 school districts in California. Of 12 independent variables,
Thompson found 4 variables that were significant and together accounted for 41 percent of the
variance in predicting the satisfaction of Black parents with the school system. The strongest
children’s elementary school teachers. With regard to the school choice options provided by
NCLB (U.S. Department of Education, 2002), Thompson suggests that educators and
policymakers will need to listen to the concerns of Black parents and seek methods of improving
the quality of education provided to their children in order to prevent what she described as a
“parent-initiated mass exodus of children from low-performing schools” (p. 278).
Noting the importance of parent satisfaction with schools in the context of increasing
school choice options, Friedman et al. (2006) used multiple regression with survey data from 27
school districts across the U.S., to identify which factors best predicted parents’ satisfaction with
their children’s schools and the extent to which parent satisfaction varied between ethnic groups.
Instead of single indicators like Thompson (2003), the survey utilized a multiple-indicator
approach to measure 15 areas of parents’ experience with their children’s school. The areas of
parents’ experiences that were measured included facilities, computer technology, school bus
service, school communication, curriculum, and superintendent/central office. Across all four
ethnic groups, the strongest statistically significant predictor of parent satisfaction was their
children’s safety at school, with standardized coefficients having a narrow range from 0.23 to
0.25. Similarly, the parents’ perception of the value of their tax dollar, which was indicated by
the parents’ perception of how responsibly the school handled its finances, was also a
statistically significant predictor for all ethnic groups. The ethnic groups diverged on several
factors with teacher effectiveness being a statistically significant predictor of satisfaction for
Black, White, and Hispanic parents but not for Asian American parents. Computer technology
was a statistically significant predictor only for Asian American parents while experience with
the school principal was not a statistically significant predictor only for Black parents. The
of parent satisfaction, and that it is predicted by not only academic performance but by
non-academic variables such as school safety and facilities.
Seeking to identify a more parsimonious model, Friedman et al. (2007) used factor
analysis to identify factors of parent satisfaction and then regressed overall satisfaction across
three groups of variables: district characteristics, parent demographics, and school satisfaction
factors. Beginning with the same 15 areas of parents’ experience with their children’s school that
were used in the previous study, the authors conducted factor analysis, which resulted in a
three-factor solution: 1) parent communication and involvement, 2) school resources, and 3) leadership
and budget. The first factor, parent communication and involvement, included information
teachers and the school provided to parents regarding academic performance and school events.
The second factor, school resources, addressed provision of adequate computers, curriculum, and
facilities. Lastly, the third factor, was concerned with the school and district administrators
handling of the budget. Next, the overall parent satisfaction measure was regressed on the district
dummy variables, district characteristics, parent demographics, and the three school satisfaction
factors. All four of the regression models were statistically significant and the R2 increased from
0.03 for the initial model, which included only the district dummy variables, to 0.46 for the final
model, which included the district characteristics, parent demographics, and school satisfaction
factors.
The public administration literature views satisfaction with school quality somewhat
similarly to the education literature. In education, parents are often cited as one of the
stakeholders in education (Epstein, 1985) and are recognized as the most important factor in a
child’s education (Bushaw & Lopez, 2010; Sacks, 2007), yet, parents’ satisfaction remains
thus, unimportant (Henig, 2008). Within public administration, there is a long, but skeptical,
history of using citizen (customer) surveys to assess the performance of urban services (Favero
& Meier, 2013). In the 1970s, when use of citizen surveys as a means of assessing public
services was increasing, several authors were unable to find a statistically significant relationship
between objective performance measures, such as police response time, and the citizen
satisfaction ratings of the public services (Brown & Coulter, 1983; Kelly, 2003; Kelly &
Swindell, 2002; Stipak, 1979, 1980). As a result, the validity of citizens’ subjective evaluations
of public services was questioned for many years. In the past decade, more sophisticated
statistical methods, along with disaggregated data and improved models, have led to stronger
links between the subjective satisfaction ratings and objective performance measures (Morgeson
2012; Poister & Thomas, 2011; Van Ryzin, 2004, 2006, 2013).
Asserting that parent satisfaction provides a potential criterion for assessing the validity
of other official measures of school performance, Charbonneau and Van Ryzin (2012) tested the
link between official objective measures of school performance and the subjective satisfaction of
parents. Using data from surveys of parents with students in the New York City school system,
and the quality review reports produced by the school system, the authors used ordinary least
squares (OLS) to estimate regression models. The quality review reports produced by the school
system include an overall rating assigned to the school by the school district, as well as
indicators for student performance and student progress. The study found that the official
measures of school performance were statistically significant and important predictors of
aggregate parental satisfaction. In essence, at the school level, parents form their satisfaction
judgments in ways that match up moderately well with some of the indicators the school system
included, respectively, only the response rate, the school and student characteristics, and only the
official performance measures ranged from 15 to 18 percent. The fourth model, which included
all of the independent variables, explained 44 percent of the variance in parent satisfaction across
schools and three of the official performance measures—Student Performance Score, State
Accountability Status, and Quality Review Score—were statistically significant predictors of
parent satisfaction. A limitation of the data is that all of it comes from one school system instead
of from several school systems. Another limitation is that the analysis looked only at
aggregate-level parental satisfaction ratings instead of individual parent satisfaction ratings.
Similar to Charbonneau and Van Ryzin (2012), Favero and Meier (2013) used data from
New York City schools to examine the relationship between objective measures of school
performance and subjective school performance data from both parents and teachers. Their
hypotheses were concerned with convergent and discriminant validity. First, they expected that
parents and teachers assessments of schools would be similar to the objective administrative data
because the subjective assessment would be based partially on characteristics measured by the
administrative data. At the same time, they expected parents and teachers subjective assessments
to have similarities to each other that were omitted from the objective administrative data. To
measure the two dependent variables, the authors created factor indices based on similar items
from the parent and teacher surveys. Regression analyses indicated that all four education
assessments—attendance rate, student performance, Progress Report score, and Quality Review
score—were positively related to parent satisfaction. For the teacher satisfaction model, Student
performance, Progress Report scores, and Quality Review scores were all positively related to
teacher satisfaction. Thus, the authors found support for their first hypothesis that both the parent
hypothesis was also supported because the parent and teacher assessments were positively and
significantly related to each other, which suggests that the assessments of both groups were
based partially on factors that are not explained by the administrative measures.
All of the studies in both the education and public administration literatures recognized
the importance of measuring parent satisfaction within the context of increasing school choice
options, but only Falbo et al. (2003) included three items that measured the outcomes of
satisfaction: 1) the willingness to recommend the school to others, 2) the desire to move to
another public school, and 3) the desire to enroll their children in private school. Friedman et al.
(2007) suggested that future research should explore the relationship between parent satisfaction
and school choice. Favero and Meier (2013) asserted that parental assessment of schools is a
controversial issue in public policy because it is the linchpin of arguments in favor of greater
school choice options. In addition, Favero and Meier state that scholars have doubt regarding the
ability of most parents to judge school quality adequately. This doubt related to citizens’ ability
to judge the performance of public services is discussed briefly by Charbonneau and Van Ryzin
(2012) and stems from studies conducted in the late 1970s that were unable to find a significant
relationship between objective and subjective performance measures. These two most recent
studies of parent satisfaction with schools (Charbonneau & Van Ryzin, 2012; Favero & Meier,
2013) have shown that there is agreement between the objective and subjective performance
measures of school quality. These findings are important because they indicate that the public is
able to perceive the quality of a publicly provided service in a manner that correlates positively
with objective performance measures, which, as previously discussed, has long been a point of
In the next section, models that have been developed and utilized in the private sector to
measure customer satisfaction are introduced. These models extend the examination of the
impact of individuals’ experiences with a service (e.g., public schools) beyond their satisfaction
to include the behavioral outcome of satisfaction, such as, the desire to exercise school choice
options.
Expectancy Disconfirmation Theory and Models
Expectancy disconfirmation theory posits that satisfaction determinations are the result of
an individual’s comparison of his or her expectations of the product/service with the perceived
performance of a product/service (Oliver, 1980). There are three main constructs in the theory,
expectations, expectancy disconfirmation, and satisfaction, with the first two being antecedents
of satisfaction. Based on the theory, Oliver proposed a temporal model in which expectancy
disconfirmation is the cognitive process used to compare one’s prior expectations about how
good a product/service should be (normative expectations) with his or her perception of the
actual performance (perceived performance) of the product/service (Figure 1). In Oliver’s
original model (1980), perceived performance of the product/service is not explicitly modeled.
Rather, perceived performance serves as an indicator of the expectancy disconfirmation variable
when it is compared to one’s prior expectations. The expectancy disconfirmation process has
three possible outcomes: 1) the perceived performance exceeds expectations (a positive
disconfirmation in that the product/service was better than expected), 2) the perceived
performance falls short of expectations (a negative disconfirmation in which the product/service Expectations Disconfirmation Satisfaction Repurchase
Intention
was not as good as expected), or 3) the performance is perceived to meet expectations (a zero
disconfirmation).
Thus, one’s expectations serve as a referent to which product/service performance is
compared; then, the resulting disconfirmation (positive, negative, or zero) becomes input into the
individual’s feeling of satisfaction. Further, Oliver (1980) argues one’s level of expectations can
be seen as an adaptation level that is formed over time by repeated cycles of the expectancy
disconfirmation process. In short, Oliver views satisfaction as a function of one’s level of
expectations (adaptation level) and disconfirmation. Finally, Oliver suggests that as a
consequence of satisfaction, the individual may change his or her repurchase intentions.
The constructs in the model were measured using a multiple indicator approach. For the
expectancy disconfirmation construct, Oliver (1980) used overall better-worse than expected
scales instead of a difference score that was calculated between expectations and performance
outcomes that had been used in previous studies. Oliver noted that the gap between expectations
and performance had usually been measured by subtractive disconfirmation in which the value of
the expectations variable was subtracted from the performance variable, resulting in a difference
score. Additionally, Oliver noted that the perceived disconfirmation method of capturing the gap
via better-worse scales had been used recently and results sometimes exceeded those using
difference scores (or subtractive disconfirmation). Thus he chose to use perceived
disconfirmation to model the gap between the expectations and performance constructs. The
model was tested via fully recursive path analysis. Additionally, path coefficients were
calculated using LISREL, with almost identical results from both methods.
Following this initial test of the expectancy disconfirmation theory and model, several
models during the 1980s and compared the major characteristics of the models. Most of the
models considered other possible antecedents of satisfaction including experience-based norms
instead of expectations (Woodruff, Cadotte & Jenkins, 1983), alternative standards of
performance (Cadotte, Woodruff & Jenkins, 1987), performance and attributions (Oliver &
DeSarbo, 1988), affect (Westbrook, 1987), multiple comparison processes (Tse & Wilton, 1988),
and perceptions of equity (Oliver & Swan, 1989). Throughout the various models proposed and
tested, Erevelles and Leavitt (1992) note that Oliver’s (1980) expectancy disconfirmation model
was the dominant model of consumer satisfaction research and was included within many of the
other proposed models while the models varied in terms of the other antecedents of satisfaction.
Based on the body of theoretical and empirical work, Oliver (1997) revised the
expectancy disconfirmation model shown in Figure 1 to model performance as an antecedent of
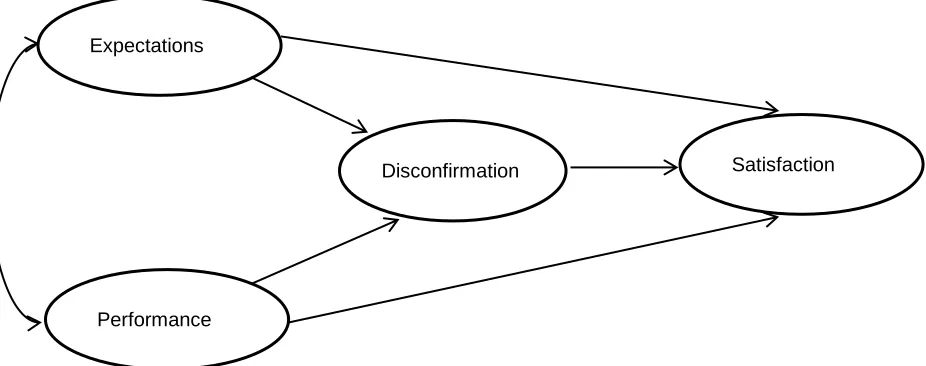
satisfaction explicitly. This revised model, shown in Figure 2, became known as the expectancy
disconfirmation with performance model (EDP). In this model, performance refers to the
consumer’s evaluation of the product/service based on a recent experience. The definitions of the
remaining variables were not changed and the consequences of satisfaction were omitted from
the model. Oliver (1997) notes other studies with various products and services have found Expectations
Performance
[image:34.612.77.540.433.616.2]Disconfirmation Satisfaction
differences in the relationships between the variables with some finding stronger effects for any
of the three antecedents of satisfaction or a combination of the three. He states that any
combination of effects is possible and that none can be ruled out or assumed.
A very similar model, the American Customer Satisfaction Index (ACSI) model was
developed as a customer-based measurement system for evaluating and improving the
performance of organizations, industries, economic sectors and national economies (Fornell,
Johnson, Anderson, Cha & Bryant, 1996). The ACSI model is very similar to the expectancy
disconfirmation with performance model established by Oliver (1997) and goes a step further to
include the behavioral consequences of satisfaction. (See Figure 3).
Customer Complaints Perceived
Quality
Customer Expectations
Perceived Value
Overall Customer Satisfaction
(ACSI)
Customer Loyalty +
+ +
+
+
+ +
_
[image:35.612.72.518.324.557.2]Looking more closely at the constructs in the model, Fornell et al. (1996) define
perceived quality (or performance) as customers’ evaluations of their experiences with the
product/service. Oliver (1980) described performance similarly in that the construct was the
customer’s perception of the performance of the product/service. In the ACSI model, perceived
quality is one of the antecedents of satisfaction and is expected to have a direct positive influence
on both the perceived value and overall satisfaction variables.
In the ACSI model, expectations are the customer’s predictions of the service quality they
will receive and also reflect their prior experiences with a product/service (Fornell et al. 1996).
Thus, the authors contend that the expectations variable is both backward and forward looking.
In addition, expectations may stem from nonexperiential sources, including word-of-mouth or
communications, such as advertising and media sources. Given the predictive role of
expectations—how good a product/service will be—the authors indicate this construct should be
positively related to perceived quality, perceived value, and satisfaction. More specifically, based
on prior experiences and other sources, customer’s expectations should be a relatively accurate
estimate of the quality and value they will receive. Finally, Fornell et al. assert that because the
expectations construct captures previous experiences and information, it has a direct positive
influence on overall satisfaction. In short, customers were satisfied previously and expect to be
satisfied again. Although not specifically stated, the view of the expectations construct held by
Fornell et al. seems similar to Oliver’s (1980) view of expectations as an adaptation level in that
one’s expectations are tempered by previous experiences.
The third antecedent of overall satisfaction is perceived value. Fornell et al. (1996) define
this construct as the perceived level of quality relative to the price paid and predict that perceived
expectancy disconfirmation model and the ACSI model. Both constructs are concerned with a
gap but in the expectancy disconfirmation model, the gap is between expectations and perceived
performance while in the ACSI model the gap is between perceived performance and perceived
value.
Customer satisfaction is a mediating variable between its antecedents and the behavioral
consequences of customer complaints and customer loyalty (Fornell et al. 1996). This construct
is a latent variable and is measured by a multiple indicator approach that results in a latent
variable index. The 0 to 100 ACSI index is calculated using a formula whereby proprietary
weights are applied to the arithmetic mean for each indicator.
The remaining two constructs—customer complaints and customer loyalty—are the
behavioral consequences of overall satisfaction (Fornell et al. 1996). The authors predict that
overall satisfaction will have a negative influence on customer complaints (as overall satisfaction
increases, customer complaints should decrease) and a positive influence on customer loyalty
(increases in overall satisfaction should increase customer loyalty). Fornell et al. identify
customer loyalty as the ultimate dependent variable in the model.
The final relationship in the model is between customer complaints and customer loyalty
(Fornell et al. 1996). The authors predict that customer complaints will have a positive influence
on customer loyalty if complaining customers can be turned into loyal customers. A negative
influence of customer complaints on customer loyalty would indicate a decrease in customer
loyalty (more customers opting to choose a different product/service).
To reduce negative skewness, the constructs were measured by a multiple indicator
approach (with the exception of customer complaints which was a yes/no question). Partial least
because it is an iterative procedure for estimating causal models and does not impose
distributional assumptions on the data. In addition, partial least squares can accommodate both
categorical and continuous variables.
As previously mentioned, the ACSI is used to measure the performance of economic
sectors (Fornell et al. 1996). In the United States, the model was applied initially to seven sectors
of the economy, including, manufacturing, transportation, public administration/government, and
retail. Models were estimated separately for each of the seven economic sectors and based on the
performance of all of the models on four indicators, the authors’ reported that the model was
viable. First, 54 of 56 of the path coefficients were statistically significant and in the predicted
direction. Of the two relationships that did not perform as predicted, one was in the model for the
public administration/government sector. Specifically, the effect of expectations on perceived
value was in the predicted direction (positive) but was not significant. Next, the model explained
an average of 75 percent of the variation in the customer satisfaction construct and an average of
36 percent of the variation in customer loyalty. The remaining two indicators were concerned
with the fit of the measurement and latent variables in the model. The model explained an
average of 87 percent of the covariance in the measurement variable, and an average of 94
percent of the covariance in the latent variable.
Fornell et al. (1996) reported that the largest direct influence of expectations on overall
satisfaction was in the public administration/government sector with a path coefficient of 0.09.
Similarly, the authors report that the total effect of expectations (0.59), the sum of the direct and
indirect effects, on overall satisfaction was the greatest for this sector. They suggest the larger
services, whereas expectations may have a smaller effect in other sectors because more recent
perceived performance (quality) experiences are more salient.
In 1999, measurement of federal services increased to more than 70 agencies, including
30 of the largest federal agencies (Fornell, 2001). As the ACSI was utilized with an increasing
number of federal agencies, the researchers realized that modifications to the model were needed
because customer loyalty was not a relevant outcome measure for most government agencies so
a separate version of the model was created for use with the public administration/government
sector (See Figure 4). The terminal dependent variable in the model was redefined as trust in
government which was viewed as a more appropriate outcome of customer satisfaction for this
sector. Again, the construct was measured by two indicators: 1) degree to which the customer
would recommend the agency’s services to others, and 2) extent to which the customer has
confidence in relying on the agency in the future. Additionally, perceived value was not a driver
of customer satisfaction because customers do not pay for many government services directly
and this construct was removed completely from the model. As can be seen in the model below,
customer satisfaction now has only two antecedents—perceived quality and expectations. At Process Website Customer Service Information Perceived Quality Customer Satisfaction (ACSI) Customer
Expectations Citizen Trust
[image:39.612.80.550.305.472.2]Ease Timeliness Ease Usefulness Courtesy Professional Clarity Accessibility Customer Complaints
present, this modified version of the model is still used to measure customer satisfaction for
federal and other government agencies (ACSI, 2013).
In summary, while Oliver’s expectancy disconfirmation with performance model (1997)
and the ACSI government services model (Fornell et al. 1996) have some similarities, they also
have key differences. There are two primary similarities between the models: 1) the models
utilize multiple indicator approaches to measure latent constructs, and, 2) the models were
devised and tested using data from customers with recent experiences with the product/service.
The expectations and perceived quality constructs are defined similarly between the two models
while the third antecedent of satisfaction differs. In the ACSI government services model,
satisfaction has only two antecedents. Disconfirmation is one of the indicators used to create the
satisfaction construct rather than being modeled separately as in the expectancy disconfirmation
with performance model. The ACSI government services model redefined the outcome of
satisfaction as trust in government as most government services are not purchased directly by the
customer.
Testing of Customer Satisfaction Models in Public Administration
In the past decade, several tests of customer satisfaction models have been reported in the
public administration literature. These tests are a departure from previous decades, primarily the
1980s until the early 2000s, during which a few researchers made unsuccessful attempts in
modeling a relationship between performance indicators of public services and citizen
satisfaction (Brown & Coulter, 1983; Kelly, 2003; Parks, 1984; Stipak, 1979; Swindell & Kelly,
2000). One of the results of these failed attempts was the assertion that citizens (customers) were
unaware of the levels of services they received (Brown & Coulter, 1983). However, as citizen –
accountability (Kelly, 2003), there was renewed interest in developing and testing a model of
overall satisfaction with public services. To that end, Van Ryzin, Muzzio, Immerwahr, Gulick,
and Martinez (2004) published the initial studies of customer satisfaction with public services
using the ACSI government services model (Fornell, 2001) and the EDP model (Oliver, 1997).
To date, the ACSI government services model has been tested once while the expectancy
disconfirmation with performance EDP model has been tested most often. The tests of the
models have used survey data and have been applied toward evaluation of services provided by
different levels of government including city/local (Van Ryzin 2004, 2006), state (Poister &
Thomas, 2011), and the federal government (Morgeson, 2013). Most of the tests have measured
the constructs via single-indicator approaches with the exception of the perceived performance
construct which has been modeled as a latent variable with multiple performance indicators. The
tests have utilized both perceived disconfirmation and subtractive disconfirmation which have
resulted in confounded results. In addition, the relationships between the expectations construct
and other constructs have varied across the tests of the models.
Noting that few studies in public administration literature attempted to link citizen
satisfaction with behavioral consequences of interest to public managers, Van Ryzin, Muzzio,
Immerwahr, Gulick, and Martinez (2004) sought to test a single explanatory framework that
included behavioral consequences, such as, desire to remain in/move away from a community,
along with evaluations of specific city services, perceived performance, and satisfaction
judgments. Van Ryzin et al. (2004) applied an adapted version of the ACSI government services
model to New York City satisfaction survey data from 2000 and 2001. Rather than using broad
categories such as “process” or “website” as indicators of perceived quality shown in Figure 4,
protection, etc.) provided by the city of New York. Ratings of these services loaded onto a latent
variable for overall perceived quality. The nine performance indicators allowed the authors to
examine how specific services drove perceived quality and satisfaction. In turn, the authors could
then assess the influence of satisfaction on trust in New York City government or the desire to
move away.
The remaining constructs—expectations, satisfaction, trust in government, and the desire
to move away—were measured by single indicators, however, the wording of the expectations
survey item changed from 2000 to 2001 (Van Ryzin et al. 2004). In 2000, participants were
asked to identify the level of expectations they held for city government in terms of meeting their
needs. In 2001, the survey item was phrased retrospectively and asked participants to rate the
expectations they held for city services a few years ago. In both years, the surveys were
completed in July and August. Thus, the results for 2001 were not influenced by the events of
September 11, 2001.
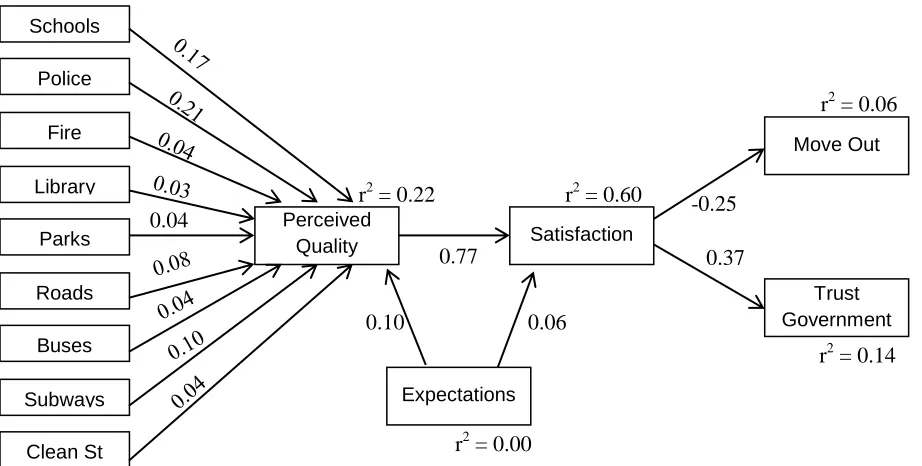
Van Ryzin et al. (2004) estimated models separately by year and described the
standardized parameter estimates across the models as similar in magnitude and direction.
Beginning on the left side of the model (See Figure 5), participant ratings of police services and
public schools had the largest influence on the perceived quality latent variable while library
services had the smallest influence on perceived quality. The expectations construct, modeled as
an exogenous variable, had a 0.10 (p < 0.01) influence on perceived quality and a 0.06 (p < 0.01)
direct influence on satisfaction. Indirectly, the influence of expectations through perceived
quality onto satisfaction was 0.077 (0.10 x 0.77), which, when summed with the direct influence
(0.077 + 0.06), the total effect of expectations on satisfaction was 0.137. Comparatively, the
has a statistically significant negative influence on participants’ desire to move away from New
York City (-0.25) and a statistically significant positive influence on trust in New York City
government (0.37).
As previously mentioned, the wording for the 2001 survey item for expectations was
changed to match the original ACSI model more closely. As shown in Figure 6, expectations had
a direct influence of 0.11 (p < .001) on satisfaction and an indirect influence of 0.21 (0.31 x 0.69)
(p < .001), thus, the total effect of expectations on satisfaction was 0.32 (0.11 + 0.21). Van Ryzin
et al. (2004) attributed the stronger influence of expectations to the wording change and stated
their belief that the 2001 data may be a more operationally valid test of the ACSI model. The
authors do not provide any further explanation for their assertion of increased operational
validity. In later studies, it becomes evident that the expectations construct is sensitive to whether
expectations are predictive (how good a service will be) or normatively (how good a service
should be) (Poister & Thomas, 2011; James, 2007; Van Ryzin, 2006). Schools Fire Police Library Parks Roads Buses Subways Clean St Perceived Quality Expectations Satisfaction Move Out Trust Government
r2 = 0.00
r2 = 0.60
r2 = 0.14 r2 = 0.06
r2 = 0.22
0.77 0.37
-0.25
0.06 0.10
[image:43.612.72.533.69.302.2]0.04
Van Ryzin et al. (2004) stated that the model remained stable with expectations and
perceived quality having a significant influence on satisfaction. In turn, satisfaction had a
significant influence on both behavioral consequences (trust in government and desire to move
away). The authors stated that the relationship between satisfaction and the behavioral
consequences implied that improving the performance of government services, particularly
services that have a significant influence on perceived quality, would help to increase trust in
government and retain citizens. Concerning limitations of the study, the authors noted the
complexity of the model and use of structural equation modeling techniques which may be
unfamiliar to persons outside of academia. Another limitation is the use of single indicators to
measure the constructs which may have increased skewness. Despite these limitations, the
authors stated that the ACSI model could provide a conceptual framework for understanding
how citizens make judgments about government services. Lastly, inclusion of the behavioral
consequences of satisfaction serves to increase the relevance to policy makers by explaining an
outcome that is of interest to them. Schools Fire Police Library Parks Roads Buses Subways Clean St Perceived Quality Expectations Satisfaction Move Out Trust Government
r2 = 0.00
r2 = 0.54
r2 = 0.13 r2 = 0.05
r2 = 0.25
0.69 0.35
-0.22
.11 0.31
[image:44.612.72.531.70.301.2]0.04
Next, Van Ryzin (2004) completed the first test of the EDP model that was published in
the public administration literature. With regard to the relationships between the constructs, Van
Ryzin (2004) postulated that a relatively strong direct relationship between perceived quality and
satisfaction would suggest that citizens’ satisfaction judgments are based primarily on perceived
quality with little reference to their expectations. Further, he postulated that this strong direct
relationship could negate use of the expectancy disconfirmation model with citizen satisfaction.
Additionally, Van Ryzin (2004) hypothesized that a direct relationship between
expectations and perceived quality might be due to two different effects. First, citizens’ may
have little basis for judging perceived performance because they have a low level of involvement
with the service or they lack awareness of the performance of the service. Second, in an effort to
reduce cognitive dissonance, an individual may assimilate his or her satisfaction judgments
toward their expectations (Oliver, 1997). Similarly, within public administration, overall views
of the government might influence citizens’ expectations of performance quality (Stipak, 1980).
Van Ryzin believed that both of these effects could result in a positive direct effect of
expectations on satisfaction.
The model was tested using data from a citizen satisfaction survey conducted in New
York City in August 2001 (Van Ryzin, 2004). The expectations and satisfaction constructs were
measured by single indicators rather than a multiple indicator approach used by Oliver (1980).
The expectations survey item was asked retrospectively with participants asked to rate the
expectations for government services they held a few years ago. The expectancy disconfirmation
construct was operationalized by the subtractive disconfirmation method whereby the gap
between perceived quality and expectations was calculated as perceived quality minus
either positive (perceived quality exceeds expectations) or negative (perceived quality falls short
of expectations). Finally, the perceived quality construct was operationalized as a latent variable
composed of nine performance indicators. Participants were asked to rate the performance of
nine services (for example, street cleanliness, subways, public schools, and fire protection
services) provided by New York City government and the ratings of these services loaded onto a
single indicator that asked participants to rate overall quality of city services.
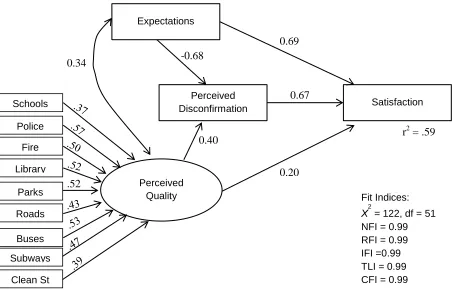
The model (See Figure 7) was estimated with the AMOS program for structural equation
modeling and used full information maximum likelihood (FIML) estimation (Van Ryzin, 2004).
The author reports that all structural path coefficients and factor loadings were statistically
significant. The chi-square test was significant but the chi-square/degrees of freedom ratio was
less than three, which is the suggested threshold for good fit (Arbuckle & Wothke, 1999). In Fit Indices:
Χ2 = 122, df = 51 NFI = 0.99 RFI = 0.99 IFI =0.99 TLI = 0.99 CFI = 0.99 Schools Fire Police Library Parks Roads Buses Subways Clean St
r2 = .59
0.20 -0.68
0.40
0.69
0.67
.52 Perceived Quality Expectations
Perceived
Disconfirmation Satisfaction
[image:46.612.74.526.283.573.2]0.34