www.hydrol-earth-syst-sci.net/18/257/2014/ doi:10.5194/hess-18-257-2014
© Author(s) 2014. CC Attribution 3.0 License.
Hydrology and
Earth System
Sciences
Hydrological appraisal of operational weather radar rainfall
estimates in the context of different modelling structures
D. Zhu, Y. Xuan, and I. Cluckie
College of Engineering, Swansea University, Swansea, SA2 8PP, UK Correspondence to: D. Zhu ([email protected])
Received: 26 July 2013 – Published in Hydrol. Earth Syst. Sci. Discuss.: 15 August 2013 Revised: 27 November 2013 – Accepted: 6 December 2013 – Published: 21 January 2014
Abstract. Radar rainfall estimates have become increasingly available for hydrological modellers over recent years, espe-cially for flood forecasting and warning over poorly gauged catchments. However, the impact of using radar rainfall as compared with conventional raingauge inputs, with respect to various hydrological model structures, remains unclear and yet to be addressed. In the study presented by this paper, we analysed the flow simulations of the upper Medway catch-ment of southeast England using the UK NIMROD radar rainfall estimates, using three hydrological models based upon three very different structures (e.g. a physically based distributed MIKE SHE model, a lumped conceptual model PDM and an event-based unit hydrograph model PRTF). We focused on the sensitivity of simulations in relation to the storm types and various rainfall intensities. The uncertainty in radar rainfall estimates, scale effects and extreme rain-fall were examined in order to quantify the performance of the radar. We found that radar rainfall estimates were lower than raingauge measurements in high rainfall rates; the res-olutions of radar rainfall data had insignificant impact at this catchment scale in the case of evenly distributed rain-fall events but was obvious otherwise for high-intensity, lo-calised rainfall events with great spatial heterogeneity. As to hydrological model performance, the distributed model had consistent reliable and good performance on peak simulation with all the rainfall types tested in this study.
1 Introduction
The capability of providing instantaneous rainfall estima-tion at high spatial and temporal resoluestima-tion renders radar rainfall an important alternative to raingauge data for river flow forecasting. It is even more so for real-time flood fore-casting over ungauged or data-sparse areas. The applica-tions of radar rainfall in hydrological modelling have been constantly highlighted in many studies (e.g. Collier and Knowles, 1986; Cluckie and Owens, 1987; Bell and Moore, 1998a,b; Carpenter et al., 2001; Borga, 2002; Tachikawa et al., 2003; Hossain et al., 2004; Reichel et al., 2009). How-ever, the potential of the rainfall estimation using weather radar has often been limited by a variety of sources of errors, for instance, those due to hardware calibration, attenuation, ground clutter, anomalous propagation, vertical reflectivity profile,Z–Rrelationship, sampling effects. The corrections for those radar application issues have been investigated and discussed by many studies, which can be referred to Harrold et al. (1974), Browning (1978), Wilson and Brandes (1979), Fabry et al. (1992, 1994), Kitchen (1997), Krajewski and Smith (2002), Rico-Ramirez et al. (2007), etc. Moreover, the results of flow simulation with radar rainfall are further com-plicated by the hydrological models employed, which, de-pending on their structures, may produce drastically differ-ent outcomes. This scenario is also intertwined with various types of storm types and the distribution over the catchments of concern.
Many studies have been carried out to identify and to help developing hydrological modelling systems that can better utilise radar rainfall estimates in order to improve stream flow simulations. For example, one of the major goals
258 D. Zhu et al.: Hydrological appraisal of operational weather radar rainfall estimates
of the Distributed Model Intercomparison Project (DMIP, Smith et al., 2004) was to understand how to utilise the NEXRAD (Next-Generation Radar, Smith et al., 1996) rain-fall data to improve the river forecasts of the National Weather Service (NWS) of the US using its existing hy-drological models applied in a lumped and semi-distributed fashion. Some key findings of DMIP can be referred to Ajami et al. (2004), Bandaragoda et al. (2004), Carpenter and Georgakakos (2004) and Liang et al. (2004). It is sug-gested that the impact on simulation accuracy is related more to the model formation, parameterisation and the skill of the modeller, rather than how the spatial structure is described (lumped or distributed). The runoff and evapotranspiration driven by the NEXRAD precipitation data showed more spa-tial heterogeneities than those forced by raingauge precipi-tation data in general (Guo et al., 2004; Reed et al., 2004). Additionally, Cole and Moore (2008, 2009) used three types of gridded rainfall estimation based on raingauge and radar measurements with two hydrological models – the lumped conceptual model PDM and a grid-to-grid, conceptual dis-tributed model. It was found that there was little difference between the performance of the PDM and that of the grid-to-grid model, whereas the frequent and spatially varying gauge adjustment was the key for accuracy improvement of radar rainfall estimates. Additionally, Liguori and Rico-Ramirez (2013) also implemented the PDM model for the assessment of probabilistic flow predictions. Rico-Ramirez et al. (2012) also used the PDM model for testing different radar rainfall algorithms.
However, there is an important question yet to be ex-plicitly addressed: given the existing radar rainfall esti-mates which have already undergone the sophisticated post-processor with best efforts of meteorological services, what is the implication of choosing hydrological models with dif-ferent model structures in terms of utilising the radar rainfall inputs as an alternative to the raingauge. The question can be conveniently extended one step further as to considering the role of storm types in the context of catchment characteristics (i.e. localised convective storm or more uniformly stratiform one). In response to this, we chose and studied a catchment from southeast England which is well equipped with dense raingauge network and radar coverage, aiming to gain the in-sights into the question. Contrasting to previous studies that either focused only on the prospect of model structures or the prospect of rainfall sources, we analysed the impact of model structure on the flow simulations with the operational UK NIMROD radar data sets (Golding, 1998; Harrison et al., 2000), taking into account the variation of storm types, and then try to address the following questions:
1. How do the NIMROD rainfall products perform at dif-ferent rainfall intensity, comparing to the raingauge measurement, in terms of the rainfall rate and rainfall detection reliability?
2. How do different rainfall estimators perform in hy-drological models with respect to their mathematical structures?
3. How do different types of rainfall events impact on hydrological models with different levels of spatial complexity?
4. What is the recommendation to apply current radar rainfall products on hydrological simulation and flood forecasting at catchment scale?
In order to answer these questions, we built and tested three hydrological models representing different structures to carry out flow simulations with three types of rainfall es-timators derived from raingauges and radar at different spa-tial and temporal resolutions. This paper is organised as fol-lows: Sect. 2 describes the catchment of the case study and available hydrological data from raingauge and radar. Sec-tion 3 covers the model descripSec-tion, calibraSec-tion and valida-tion Sect. 4 details the analysis of rainfall comparison be-tween the raingauges and the weather radars. The hydrolog-ical model assessment of the different rainfall estimators is presented in Sect. 5 and finally, discussion and some con-cluding comments are given in Sects. 6 and 7.
2 Study catchment and available data
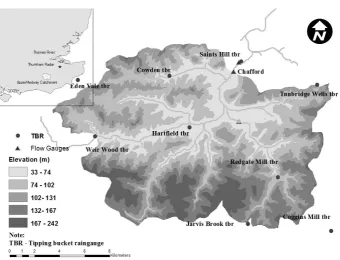
The upper Medway catchment is located to the south of Lon-don covering an area of around 220 km2. The average annual rainfall and potential evapotranspiration are 729 and 663 mm, respectively (MacDonald, 2003). The elevation of catchment terrain varies between 30m and 220m above mean sea level (see Fig. 1). The landscape of the catchment is dominated by the permanent grassland, while the geology of the catchment is a mixture of permeable (chalk) and impermeable (clay) and the dominant aquifers consist of the Ashdown Formation and the Tunbridge Wells Formation of the Hastings Group.
The catchment is equipped with 9 real-time, tipping-bucket raingauges (TBRs) operated by the Environment Agency (EA). Figure 1 shows the locations of the raingauges (circles) and the flow gauges (triangles) on the catchment. And all the flow comparisons in this study were carried out at the Chafford flow gauge close to the catchment outlet.
The precipitation data used in this study originates from two sources: (1) the rainfall data from TBR measurements and (2) rainfall data from the NIMROD product which is pro-duced from the weather radar network of the UK operated by the Met Office. The radar rainfall data has already been subject to a quality-control process and was calibrated using raingauges within the radar coverage area (Zhu and Cluckie, 2011).
Fig. 1. The upper Medway catchment with raingauges location and elevations.
or five radar scans at different elevations at each site in order to give the best possible estimate of rainfall at the ground. The radar rainfall composite is then adjusted and evaluated by the raingauge measurement using a mean-bias adjust-ment factor and undergoes extensive processing to account for various sources of radar errors. Operationally speaking, the NIMROD radar rainfall data is one of the best available sources of rainfall information although it certainly is not free from errors. In order to address the impact from radar data at different resolutions, we made use of two radar data sets: one of which was available every 15 min with a spa-tial resolution of 5 km and the other was every 5min with a spatial resolution of 1 km. Both data sets are converted from same observed polar radar rainfall data and are given on a Cartesian grid based upon the UK National Grid Reference projection.
3 Hydrological modelling methodology and verification
To serve the purpose, we chose and built three hydrologi-cal models of different mathematihydrologi-cal structures which are the physically based, fully distributed model: MIKE SHE model; the lumped conceptual model: probability distributed model (PDM) and an event-based unit hydrograph model: physical realisable transfer function (PRTF).
The purpose of this choice was not to compare a spe-cific set of models but rather to consider the impact of rainfall estimation processes on a set of mathematical model structures with dramatic differences that span from
complex/sophisticated to simple/empirical and reflect a de-creasing ability to specifically represent the spatial dis-tributed nature of the rainfall–runoff process.
The PRTF model is a black box, data-driven system us-ing mathematical and statistical concepts (transfer function technique) to link the rainfall (model input) to the runoff (model output), which is also known as a stochastic hydrol-ogy model.
In contrast, the PDM and MIKE SHE model are process-based hydrological models, which contain representations of surface runoff, subsurface flow, evapotranspiration, and channel flow, which are known as deterministic hydrology models. The difference is PDM is a lumped conceptual model that considers the whole catchment as a unit, whereas the MIKE SHE is a distributed model that takes the spatial variation of the inputs and the outputs into account by dis-cretising the entire catchment into a large number of small grids or elements.
It is worth noting that all three models have been widely used across the world and are representative of a set of math-ematical structures. More details of the model structures can be referred to Zhu and Cluckie (2011) and Zhu et al. (2013). 3.1 The MIKE SHE/MIKE 11 modelling system
The MIKE SHE/MIKE 11 modelling system is a result of further development based on the SHE concept (Abbott et al., 1986a, b).
The two-dimensional Saint-Venant equation is employed to describe the water movement on the surface in MIKE
260 D. Zhu et al.: Hydrological appraisal of operational weather radar rainfall estimates
SHE, and solved by finite difference method. The water movement through the soil profile, along with the transpiration is modelled by a simplified two-layer evapo-transpiration/unsaturated model, which fits catchments that have a shallow groundwater table. It can be used in unsatu-rated zones to calculate the actual evapotranspiration and the amount of water that recharges the saturated zone. The dy-namics of ground water is accounted for by employing a lin-ear reservoir in this study. Finally, all the water content gener-ated by MIKE SHE model is routed to the river channel and propagated to the catchment outlet by the one-dimensional hydrodynamic MIKE 11 model.
3.2 The Probability Distributed Moisture (PDM) model
The PDM model is a fairly general lumped rainfall–runoff model but internally uses a probability distribution function to describe the spatial distribution of soil moisture deficit across the catchment. The saturation excess runoff mecha-nism is employed to generate surface flow at any point in the catchment and the integrated flow is propagated to the catchment outlet by fast response pathways. The net rainfall not only fills up the soil stores and produces the overland flow, but also infiltrates and forms the groundwater recharge which is routed afterwards to the catchment outlet by the slow response pathways. Therefore, the total streamflow at the catchment outlet is summed by the flow yield by fast and slow response pathways (Moore, 1985, 1986, 1999; Moore and Bell, 2002).
3.3 The Physically Realisable Transfer Function (PRTF) model
The PRTF model is an improved form of rainfall–runoff transfer function (TF) model (Yang and Han, 2006; Young, 2006; Pollard and Han, 2012) of which the process is equiva-lent to the combination of parameterisation and calibration for physically based hydrological models. Mathematically speaking, the PRTF model represents the simplest structure chosen to transfer the precipitation information to stream-flow by replicating the non-linear and time variant nature of the rainfall–runoff process and matching the model re-sponse as closely as possible to the catchment rere-sponse in terms of three real-time adjustment factors (shape, volume and timing). This is similar to the mathematical procedures adopted in the field of control engineering in terms of mini-mal realisation of model form and provides a powerful alter-native to conventional linear systems theory as applies within hydrology.
3.4 Set-up and verification of three hydrological models
The three hydrological modes were all calibrated and vali-dated by using the TBR data only while the radar rainfall data was fed to the models later to evaluate the impact of model structures as to the radar rainfall input. The hydrological data
sets were divided into two sets with the first set (1 Septem-ber 2003–28 February 2004) used for model parameteri-sation, and the second part (1 September 2006–28 Febru-ary 2007) for model validation. Both the calibration and val-idation were carried out using raingauge measurements. This process was performed for a 6-month period, with the first two months for warming up, and the remaining four months for evaluating model outputs. A trial-and-error method was employed to calibrate the MIKE SHE model, which focused on the limited number of sensitive parameters that affect the peak flow and base flow in the model; whilst the PDM model was calibrated in simulation mode using a mix of manual and automatic parameter adjustment, driven by a simplex direct search procedure (Nelder and Mead, 1965). An auto calibra-tion funccalibra-tion was also employed to identify PRTF model pa-rameters for the upper Medway catchment. Both the MIKE SHE model and PDM model were set to start with a com-plete dry condition before the calibration and a period of two months was needed for warming up purpose.
The result of model calibration was assessed by four in-dices, namely the mean relative error (MAE), the root mean square error (RMSE), correlation coefficient (CC) and the Nash–Sutcliffe coefficient (NS):
MAE=
n P
i=1
|oi −mi|
n , (1)
RMSE= v u u u t n P
i=1
(oi −mi)2
n , (2)
CC=
n P
i=1
(oi −o) (mi −m) s
n P
i=1
(oi −o)2 n P
i=1
(mi −m)2
, (3)
NS=1−
n P
i=1
(oi −mi)2 n
P
i=1
(oi −o)2
, (4)
wherenis the data length,oi is the observed discharge, and
miis the simulated discharge,ois the mean value of the
ob-served discharges.
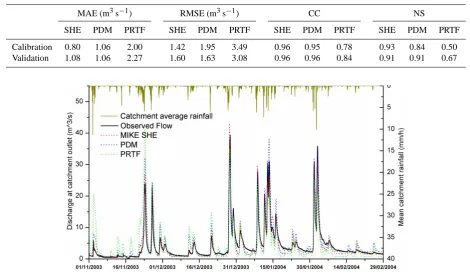
Table 1 shows the corresponding statistics of model per-formance for calibration and validation, which indicates a relatively good calibration for three hydrological models. It is worth noting that reducing the errors indicated by NS was the priority in model calibration, the other three indicators (MAE, RMSE, and CC) were assisted to examine and rein-sure the improvement of model performance.
Table 1. Statistics of performance for model calibration and validation.
MAE (m3s−1) RMSE (m3s−1) CC NS
SHE PDM PRTF SHE PDM PRTF SHE PDM PRTF SHE PDM PRTF
Calibration 0.80 1.06 2.00 1.42 1.95 3.49 0.96 0.95 0.78 0.93 0.84 0.50 Validation 1.08 1.06 2.27 1.60 1.63 3.08 0.96 0.96 0.84 0.91 0.91 0.67
33 729
Figure 2. The results of Model Calibration with raingauge rainfall
730
731
Figure 3. The results of model validation with raingauge rainfall
732
733
734
Fig. 2. The results of model calibration with raingauge rainfall.
minimise the interference from model structure when eval-uating the impact from different rainfall sources, all model structures and parameters had been intentionally kept un-changed after calibration and validation, which reflects our main objective that was to utilise the three principle model structures available in hydrology to evaluate the sensitivity of the different radar sources for rainfall data.
4 Analysis of weather radar rainfall data
4.1 Comparison of radar and raingauge measurement
Although we trust that the NIMROD radar rainfall data is one of the best data sets operationally available, it is still de-sirable to ensure that its quality is comparable as to feed the hydrological models. Limited by the data availability, a pe-riod from July 2006 to December 2007 (18 months in total) was selected for radar rainfall analysis. The areal rainfall over the catchment was taken as a measure to evaluate the radar rainfall estimates against that calculated from the raingauges. The areal rainfall from raingauges measurements was com-puted using the conventional Thiessen Polygon method while the radar rainfall was counted on the overlapped area be-tween radar grids with various spatial resolutions (e.g. 1 and 5 km) and the catchment.
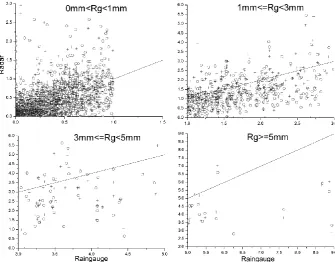
Figure 4 shows that the cumulative catchment rainfall from the 5 km/15 min resolution radar had a better agreement with the raingauge measurements than the 1 km/5 min radar reso-lution, in terms of the overall amount of precipitation. Fig-ure 5 also suggests that the 5 km/15 min 1 h cumulative radar rainfall estimates had a slightly better overall performance than the 1 km/5 min data, according to the MAE and RMSE. Additionally, it clearly shows that the radar rainfall was con-siderably underestimated during the high rainfall rate events. Figure 6 provides further comparisons in different range of rainfall intensities, based on the same data set as in Fig. 5. It indicates that the comparisons between radar rainfall and the raingauge measurements vary in different rainfall inten-sity. There are considerable amount of radar rainfall overes-timates when the 1 h cumulative catchment raingauge rain-fall intensity is less than 1 mm, showing some large radar rainfall values recorded while the raingauge measurement is fairly small. For the hourly cumulative rainfall intensity be-tween 1 and 3 mm, the radar rainfall estimates tend to be un-derestimated marginally and the distribution of radar rain-fall estimates versus raingauge measurements are rather dis-persed. However, the trend of radar rainfall being underes-timated is getting determinative when the rainfall intensity above 3 mm h−1, in particular for the rainfall intensity above 5 mm h−1, which implies that the higher the rainfall intensi-ties are, the higher degree that radar rainfall underestimates.
262 D. Zhu et al.: Hydrological appraisal of operational weather radar rainfall estimates
33 729
Figure 2. The results of Model Calibration with raingauge rainfall
730
[image:6.595.125.469.62.253.2]731
Figure 3. The results of model validation with raingauge rainfall
732
733
734
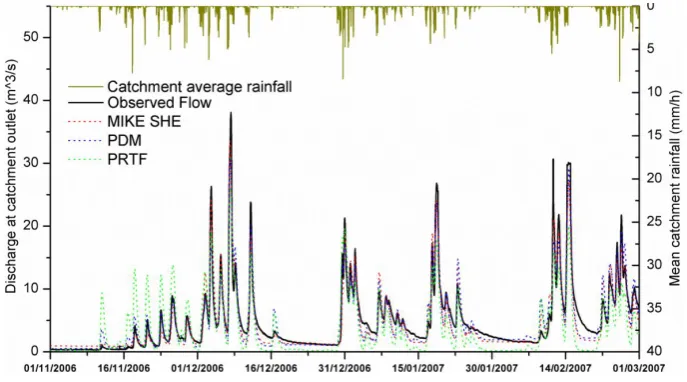
Fig. 3. The results of model validation with raingauge rainfall.
Fig. 4. Comparisons of cumulative catchment rainfall from raingauges and radar at different resolutions.
4.2 Radar rainfall detection reliability analysis
The skills of radar rainfall estimates was further evaluated by another set of indicators, namely the critical success index (CSI) (Donaldson et al., 1975); the probability of detection (POD) (Panofsky and Brier, 1965) and the false alarm rate (FAR) (Schaefer, 1990). The three indicators can be readily understood with reference to the contingency table (Table 2) whereXstands for the number of hits by both raingauge and radar, whileY is the number of hits that only occurred in radar,Z is the number of hits that radar are missing, com-pared to the raingauge.
With the help of Table 2, the three indices can be defined in a straightforward fashion:
CSI= X
X+Y +Z
which is used here to measure how well the rainfall events are hit by radar according to the raingauge observation;
POD= X
X+Z
which shows the proportion of the observed rainfall events has been matched by radar; and finally
FAR= Y
X+Y
demonstrates the fraction of the observed rainfall events that did not occur on radar.
[image:6.595.98.508.284.422.2]Fig. 5. Comparisons of 1 h cumulative catchment rainfall from raingauges and radar at different resolutions.
35 743
Figure 6. 1-h cumulative catchment rainfall distributions in different range based on
744
the same data as in Fig. 5. Circles and crosses correspond to 5km/15min and
745
1km/5min radar rainfall estimates versus raingauge measurements respectively.
746
[image:7.595.70.526.64.201.2]747
Fig. 6. 1 h cumulative catchment rainfall distributions in different range based on the same data as in Fig. 5. Circles and crosses correspond to 5 km/15 min and 1 km/5 min radar rainfall estimates versus raingauge measurements respectively.
series until all the skill scores were achieved for different thresholds.
Figure 7 shows the skills of radar rainfall estimates mea-sured by three indices with regard to different rainfall intensi-ties (with threshold at 0.2 mm h−1). The POD, which is quite sensitive to the number of correct hits, has a tendency to de-crease as rainfall rate changes from 0 to 8 mm h−1for both resolutions of radar rainfall data which echoes the finding indicated by the scatter maps shows in Fig. 6. Another inter-esting finding is that the POD actually rises again when the rainfall rate goes up to 8 mm h−1and the radar performs bet-ter in detecting high-intensity rainfall, compared to the mod-erate rainfall rate.
Table 2. Contingency table.
Hits indicated by raingauge measurements
Yes No
Hits detected Yes Hits (X) False alarms (Y) by radar No Misses (Z)
The CSI, which measures the overall reliability on detec-tion, shows a similar tendency with POD, except for the rain-fall rate ranging from 0 to 0.2 mm h−1where the CSI actually increases as well. Since the false alarms also affect the CSI, it is reasonable to infer that for low intensity rainfall events
[image:7.595.129.465.237.499.2]264 D. Zhu et al.: Hydrological appraisal of operational weather radar rainfall estimates
0 0.2 0.4 0.6 0.8 1
Sk
ill Sc
o
re
Rainfall Threshold (mm/h)
CSI (5km) POD (5km) FAR (5km)
[image:8.595.129.468.67.247.2]CSI (1km) POD (1km) FAR (1km)
Fig. 7. The skills of radar rainfall estimates against raingauge measurements.
(i.e. 0–0.2 mm h−1), the radar rainfall is consistent with rain-gauges with lower chances of issuing false alarms. This is also evidently shown by the plot of FAR in Fig. 7 which shows the trend of FAR as we expected.
When looking at the difference in these scores with regard to the resolution of the radar data sets, they vary with the in-dex of concern and more interestingly, with the rainfall rate. For CSI, the 5 km/15 min data considerably outperformed the 1 km/5 min data when rainfall rate was under 1 mm h−1, but the latter became dominant when the rainfall rate was over 7 mm h−1. Apart from that, the two resolution data sets had very similar performance on CSI. For POD, the coarser reso-lution data generally outperformed the other, especially when the rainfall rate was in the range of 4–7 mm h−1. Further-more, with CSI the finer resolution data set outperformed when the rainfall rate was over 7 mm h−1.
Regarding the FAR, it is interesting to note that the finer resolution data set significantly outperformed when the rain-fall rate was in the range of 3–8 mm h−1. However, the FAR on coarser resolution dropped down quickly when rainfall rate was above 8.6 mm h−1, which was much better than the other data set in this study. That was due to the edge effect from the algorithm (Harrison et al., 2009) employed to con-vert the polar cells into Cartesian cells, in which case, a big-ger Cartesian grid size a greater edge effect will be suffered, especially when the rainfall rate is largely heterogeneous in cells of polar format. Therefore, the coarser resolution radar data was less likely to trigger the false alarm in high rainfall rate while the raingauge data did not exceed the threshold.
The aim of employing these forecast indicators (CSI, POD and FAR) in this study is to evaluate the reliability of radar detection with various rainfall intensities (the thresholds in this case). It is strongly related and consistent to the anal-ysis in Sect. 4.1, especially when the threshold analanal-ysis is introduced. Additionally, when rainfall rate remains in low
to medium range (less than 7 mm h−1), the radar rainfall es-timates at 5 km resolution, in general, achieved marginally higher CSI and POD score than the one at 1 km resolution. In contrast, in high rainfall rate situation, the 1 km resolu-tion data set was considerably better on CSI and POD, but significantly worse on FAR. In terms of precipitation detec-tion success rate, radar performs better when the rainfall rate is either relatively low (0.2–2.2 mm h−1) extremely high (8– 10 mm h−1). For high rainfall rate events, the radar data at finer resolution tends to achieve better detection skill score.
5 Hydrological simulation results
Three evaluation periods (A: 15 November 2006–14 Decem-ber 2006; B: 27 DecemDecem-ber 2006–14 January 2007 and C: 15 July 2007–25 July 2007) were selected to examine the performance of the application of NIMROD radar rainfall estimates in hydrological models compared with raingauge measurements. The first two evaluation periods (A and B) were mainly caused by stratiform precipitation while the last one was trigged by a convective storm in summer 2007.
36 749
Figure 8. Model simulations for evaluation period A using raingauge and radar
750rainfall
751Fig. 8. Model simulations for evaluation period A using raingauge and radar rainfall.
37 752
Figure 9. Model simulations for evaluation period B using raingauge and radar
753rainfall
754755
Figure 10. Rainfall rate distribution observed by radar at four time points from 0930
756to 0945 GMT on the 20/07/2007
757Fig. 9. Model simulations for evaluation period B using raingauge and radar rainfall.
[image:9.595.99.502.389.664.2]266 D. Zhu et al.: Hydrological appraisal of operational weather radar rainfall estimates
Table 3. Statistics of performance for different model output for frontal events.
Event A MAE (m3s−1) RMSE (m3s−1) Correlation Nash–Sutcliffe
SHE PDM PRTF SHE PDM PRTF SHE PDM PRTF SHE PDM PRTF
Gauge 1.93 1.71 2.74 2.97 2.82 3.85 0.87 0.88 0.77 0.75 0.77 0.58 1 km 2.57 2.14 3.06 4.16 3.86 4.68 0.72 0.77 0.63 0.50 0.57 0.37 5 km 2.58 2.22 3.05 4.34 3.97 4.69 0.68 0.76 0.62 0.46 0.55 0.37
Event B
Gauge 1.90 1.12 1.97 2.41 1.53 2.35 0.91 0.93 0.92 0.64 0.85 0.65 1 km 1.93 1.55 2.01 2.74 2.43 2.50 0.82 0.90 0.90 0.53 0.63 0.61 5 km 1.80 1.37 1.94 2.49 2.20 2.39 0.86 0.90 0.90 0.62 0.70 0.64
For comparison between the simulations driven by rain-gauge and radar rainfall, it was found that they were gener-ally comparable for the low-flow parts but the radar driven one constantly underestimated the high flows for both evalu-ation period A and B. The first several low peaks in evalua-tion period A and the recession flow of evaluaevalua-tion period B driven by radar rainfall were higher than those caused by raingauge rainfall. This behaviour is more pronounced in the MIKE SHE model. However, for the following higher peaks (over 20 m3s−1), the radar rainfall could not drive the model to achieve the point close to the observed record, and com-pared to the raingauge measurement, a considerable amount of peak flow was underestimated.
This in fact agrees with the analysis of the radar rainfall as discussed previously where the radar rainfall usually failed to match the raingauge values for high rainfall rate events. This finding also implies that, in addition to the process al-ready applied by the NIMROD system, a further correction to radar rainfall is necessary in order to feed the hydrologi-cal model with radar rainfall. It can be inferred further that such a correction method needs to be nonlinear and better to account for different precipitation types.
Table 3 indicates that there is small amount of heterogene-ity between the simulation results trigged by the 5 km/15 min and 1 km/5 min radar rainfall data, due to the smoothing effect from hydrological models, especially in normal low rainfall rate periods (like evaluation period A and B in this study). The raingauge measurements produce better perfor-mances on the peak flow in all three models than the radar rainfall estimates. With respect to the three different math-ematical structures, although the Figs. 8 and 9 shows that the distributed MIKE SHE model have outperformed other two models in terms of the agreement of peak flow simula-tion, Table 3 suggested that PDM model have slightly bet-ter overall performance than MIKE SHE and PRTF, which is due to its better simulation on the low flow. Interestingly, an implication from this finding is that that the lumped hy-drological model structure might be a better choice for sim-ulation with low rate rainfall, considering the level of model
complexity and computation cost. When flow peak is pre-ferred, distributed model is more desirable.
While both evaluation periods A and B represent a nor-mal flooding situation, it is also desirable to look into rain-fall event with much higher intensity. The selection of eval-uation period C is just to serve this purpose. The unusual rainfall magnitude of this evaluation period was triggered by a convective storm which produced 80 mm precipitation over the catchment recorded by the raingauges which caused over 40 m3s−1peak discharge at the catchment outlet. Note that the peak of the rainfall took place on 20 July 2007 with 30 mm within 3 h from 08:00 to 11:00 UTC according to the raingauge measurement. Figure 10 shows the spatial distri-bution and movement of this rainfall peak in the MIKE SHE with 1 km resolution using the local model grid reference, in-dicating a very narrow band with very high intensity over the catchment. The rainfall rate at the centre of the storm reached as high as 112 mm h−1.
This period in fact highlights two important issues related to radar rainfall estimates and the inability of a lumped con-ceptual model to account for the heterogeneity of rainfall dis-tribution. The impact of attenuation of C-band radar beam during high-intensity rainfall events is evident in this pe-riod where all three models with NIMROD inputs produced severely underestimated results (Fig. 11) due to the under-estimated radar rainfall as a result of attenuation. Addition-ally, the situation becomes even worse with radar rainfall at coarser resolution (e.g. the 5 km data set in the study). It again suggests that the advantage of using finer resolution radar rainfall data is highlighted in high-intensity events with uneven spatial distribution.
Table 4. Statistics of performance for different model output for convective events.
MAE (m3s−1) RMSE (m3s−1) Correlation Nash–Sutcliffe
SHE PDM PRTF SHE PDM PRTF SHE PDM PRTF SHE PDM PRTF
Gauge 2.85 2.34 2.58 6.86 5.12 4.46 0.64 0.92 0.93 0.39 0.66 0.75 1 km 2.75 2.91 2.37 6.74 6.51 3.82 0.76 0.90 0.91 0.42 0.46 0.81 5 km 3.50 3.33 2.48 7.80 7.46 4.33 0.86 0.86 0.89 0.19 0.28 0.76
Fig. 10. Rainfall rate distribution observed by radar at four time points from 09:30 to 09:45 GMT on the 20 July 2007.
the distribution is inevitably more obvious than that in events with much smooth and uniform rainfall distribution. Like those in periods A and B.
Interestingly and yet contrary to common belief, the PRTF model with simplest mathematical structure clearly exceeds its two counterparts as indicated in both Fig. 11 and Table 4. The model simulated the event reasonably well with rain-gauge data. Even with the radar data, the results from the PRTF are much better than both the MIKE SHE and the PDM. The reason for such behaviour may lies in the fact that the PRTF is a event-based model in a sense that it fits to simulate a single, independent event, instead of a contin-uous events. And the mechanism of PRTF model suggests that the agreement of peak flow in model simulation depends on the characteristic of peak flow in calibration, in terms of the shape, volume and timing, which offers it certain advan-tage as compared with the complex distributed model and the lumped conceptual model both suffering from the errors in radar data.
6 Discussion
The context at which the study is targeted is flood forecast-ing with available modellforecast-ing tools and the best available op-erational radar data which in this case is the NIMROD data from the Met Office of the UK. The experiments with this setting, although limited by the availability of observations and showed a tendency of underestimating the peak flows for higher precipitation rate events, are yet able to provide a valuable insight into the effect of different rainfall measure-ments and the impact of spatial variability of rainfall at the scale of a middle size catchment, which result in some inter-esting findings are revealed for the first time. These findings are deemed to be very important for practitioners as to the choice of better model with radar rainfall input. The major findings are summarised as follows:
– The radar rainfall estimates (in our case, NIMROD) as already subject to the process of calibration and cor-rection, has a mixture performance compared to the raingauge measurements on simulated streamflows in three hydrological models. The radar rainfall products showed a tendency to overestimate the low-to-medium
268 D. Zhu et al.: Hydrological appraisal of operational weather radar rainfall estimates
38 758
Figure 11. Model simulations for evaluation period C using raingauge and radar
759rainfall
760761
762
763
764
765
766
767
[image:12.595.98.497.62.342.2]768
Fig. 11. Model simulations for evaluation period C using raingauge and radar rainfall.
rainfall rate events. However, for flow-peak-generating events (with high rainfall rate intensity), the radar data has difficulties to reproduce same magnitude of raingauge rainfall and hence underestimated the flood peaks. This mixture performance is consistent to the radar data analysis in Figs. 5 and 6. It was hypoth-esised that the cause of this could be due to using the uniform distribution to describe the variation of the drop size distribution (drizzle and showers) dur-ing the radar rainfall process. And considerdur-ing the to-pography of the catchment and the raingauge mea-surements performance in peak simulation, the oro-graphic enhancement is also suspected to cause the underestimation of the radar rainfall, as described by Kunz and Kottmeier (2006). Also, similar radar per-formances against raingauge were found by Schellart et al. (2012). However, the difficulty in estimating the rain drop size distribution, the hydrometeor drifting, evaporation, and moisture loss, prevented the further investigation for these hypothesises.
– Furthermore, the radar performance at different rain-fall rates influences the detection reliability analysis. Because of the general underestimation of the rainfall at high rainfall rate and overestimation at low–middle rainfall rate, the detection reliability analysis shows a tendency of decreasing skill score for CSI and POD but increasing skill score for FAR. And finer resolution
radar data has better performance on detection reliabil-ity but also have a risk of causing false alarm.
– As to the timing of flow peaks, the radar rainfall esti-mates has similar performance to raingauge data, that were able to drive all three models well to match the observed data, which is also important when put in an operational context where such timing directly deter-mines the action time for flood warning purposes. – The model structure indeed affects simulations of
– The PRTF model had relatively poor performance in most of the simulations, compared to the MIKE SHE and PDM models, which is partially attributed to the chalk catchment with a strong baseflow influence but without sufficient multi-year calibration period and warm-up process. Moreover, PRTF is generally an event-based unit hydrograph model, which is expected to perform better for single flood peak event simula-tions (period C in Fig. 11) or continuing multiple flood peak events along with real-time adjustment. Never-theless, the inclusion of PRTF model in this study is essential and necessary, not only because it represents a unit-hydrograph type of hydrological modelling and thus provides a powerful alternative to conventional linear systems theory as applies within hydrology, but also it has been used operationally for flood forecast-ing by Environment Agency in South West of England. Therefore it is worthwhile to include PRTF model to serve the aim of this study.
– The difference due to using radar data at different res-olutions for these events was found to be insignificant (i.e. the simulations with both low and high resolution radar data produced very close results), which suggests that the additional information content of the high res-olution radar rainfall estimates could be possibly fil-tered out by a low-pass filter such as the radar format conversion from polar to Cartesian and hydrological process.
– However, the significant advantage of using high res-olution radar data has been shown in a localised, con-vective storm event where a great deal of heterogeneity exists in the rainfall distribution over the catchment. It is vital to use rainfall data which has both high spatial and temporal resolution to ensure optimum accuracy of peak flow predictions.
– The use of more than one measurement technique, such as ensemble QPE and/or QPF, such as STEP (Bowler et al., 2006), may be necessary to account for the uncertainty inherent in all rainfall measure-ment methods used for radar rainfall applications. Moreover, in order to improve the accuracy of rain-fall measurements, more delicate interpolation meth-ods can be introduced to average the raingauge rainfall over catchments, such as Kriging (Goudenhoofdt and Delobbe, 2009; Velasco-Forero, 2009). However, the complex techniques come with heavy computational cost, which will affect the efficiency of the model dur-ing the flood forecastdur-ing. Moreover, the cost-benefit impact has to be evaluated before the method is applied.
7 Conclusions
In this study, we analysed the impact of model structure and storm types on flow simulations using radar rainfall es-timates. Three hydrological models with different mathe-matical structure and complexity were set up for a medium sized catchment the upper Medway catchment in south-east of the UK. The three models, namely the distributed model MIKE SHE, the lumped conceptual model PDM and the transfer-function-based model PRTF were firstly calibrated using raingauge data and then subject to the rainfall inputs from the NIMROD radar rainfall estimates at two different temporal/spatial resolutions. The quality of the radar data was evaluated against raingauge data before being used as the input for flow simulations. Three periods of data were then selected for the analysis with two having stratiform precipi-tation and one was due to strong, localised convective storm. A few concluding remarks can be drawn as below with respect to the objectives of this study:
1. The operationally available radar data has been shown to be able to drive hydrological simulations with rea-sonable results from models with different structures. In principle, the radar driven models are able to pro-duce comparable results for low flow with an evenly distributed storm as compared with the raingauge driv-ing counterparts. A large amount of peak underesti-mation is common in radar-driven model simulations although the radar data has been subjected to compli-cated calibration and correction, it still fails to repre-sent high-intensity precipitation due to inherent prob-lems in the technology such as mixture of raindrop dis-tribution, orographic enhancement and attenuation yet to be addressed. A very encouraging outcome, how-ever, is that the timing of the peaks is able to be re-produced with precision, which implies the utility of radar data if the underestimates are properly acknowl-edged, especially in the case of ungauged basins where the radar rainfall may be the only available sources of rainfall.
2. The impacts due to difference in model structure and the resolution of radar data, however, are less pronounced in the situation of stratiform rainfall events with moderate rainfall intensity. It unfortunately means that the spatial information contained in the radar rainfall data is often spatially averaged, dimin-ishing the impact of the measurement resolution. And the much simpler structures based upon lumped forms or black box models are generally sufficient for opera-tional hydrology.
3. However, high-intensity, localised, convective storms require better rainfall distribution representation in which case radar rainfall estimates play a more impor-tant role than raingauge. The resolution of radar data
270 D. Zhu et al.: Hydrological appraisal of operational weather radar rainfall estimates
matters more as a higher resolution gives a better de-scription which results in better flow simulation in the distributed model
4. Given that models are properly calibrated, the choice of hydrological models is not as imperative as expected for normal cases with uniform rainfall distribution as they can produce similar results. However, in the case of highly localised strong storms, lumped conceptual models that are unable to account for rainfall inhomo-geneity may fail first, it is therefore that making use of distributed models or even simple transfer function based models is desirable.
5. The improvement of attenuation correction of the re-flectivity signal in extreme intense rainfall events has to be considered before applying the radar rainfall es-timation on hydrological models, which was partic-ularly the case at the C-band frequency. Operational radars in the UK national network are all C-band radars, and the virtue of the real-time attenuation cor-rection capability of the dual-polarisation radars was found to be of assistance in the case of a severe storm, as suggested by Zhu and Cluckie (2011).
6. More sophisticated, frequent and spatially varying lo-calised gauge-adjustment techniques should be in-volved in the Nimrod radar rainfall process in order to achieve the best rainfall estimators with high res-olutions at time and space, which will certainly play a key part for accuracy improvement of radar rain-fall estimates at catchment and urban scale for future developments.
It is worth noting that the conclusions are drawn only from our case study and a more comprehensive picture however would apparently require more representative storms, differ-ent models and even radar data processed with differdiffer-ent tech-niques ought to be taken into account. Also, the consistent differences of the performance between raingauge and radar rainfall estimates in hydrological simulations may imply that hydrological models intended to be calibrated and driven with same data source. However, the raingauge measure-ments are point measuremeasure-ments and may not be able to rep-resent the “true” catchment averaged rainfall, which would possibly cause the error in the comparison. Furthermore, al-though the scenario of this study is to minimise the interfer-ence from model structure when evaluating the impact from different rainfall sources, the results from the experiments are inevitably affected by the choice of catchment, the errors derived from model structures and calibration methods, etc., which should require more further comprehensive investiga-tion to make conclusive and generalisable comments to other situations for future research.
Nevertheless, the experiments as well as the analysis pre-sented in this paper may provide a valuable insight for other
researchers and more importantly practitioners as to the mea-sures need to be taken when using operational radar rainfall estimates with their existing hydrological models. Certainly it would be more interesting to include the discussion on the technics to improve the radar data quality into the scenario but that for sure deserves a separate study where the authors would like to venture in future.
Acknowledgements. The authors would like to acknowledge the financial support provided by the FRMRC (Flood Risk Manage-ment Research Consortium). We would also like to thank the Environment Agency, Meteorology Office, and British Atmo-spheric Data Centre (BADC) for their support and the continuing collaboration with a former colleague, Dr. Miguel Rico-Ramirez of the University of Bristol.
Edited by: E. Morin
References
Abbott, M. B., Bathurst, J. C., Cunge, J. A., O’Connell, P. E., and Rasmussen, J.: An introduction to the European hydrological system-Système Hydrologique Europeèn, SHE 1. History and philosophy of a physically based distribute modelling system, J. Hydrol., 87, 45–59, 1986a.
Abbott, M. B., Bathurst, J. C., Cunge, J. A., O’Connell, P. E., and Rasmussen, J.: An introduction to the European Hydrological System-syste‘me hydrologique Europeèn, SHE 2. Structure of a physically based distributed modelling system, J. Hydrol., 87, 61–77, 1986b.
Ajami, N. K., Gupta, H., Wagener, T., and Sorooshian, S.: Calibra-tion of a semi-distributed hydrologic model for streamflow esti-mation along a river system, J. Hydrol., 298, 112–135, 2004. Bandaragoda, C., Tarboton, D. G., and Woods, R.: Application of
TOPNET in the distributed model intercomparison project, J. Hydrol., 298, 178–201, 2004.
Bell, V. A. and Moore, R. J.: A grid-based distributed flood fore-casting model for use with weather radar data: Part 1. Formula-tion, Hydrol. Earth Syst. Sci., 2, 265–281, doi:10.5194/hess-2-265-1998, 1998a.
Bell, V. A. and Moore, R. J.: A grid-based distributed flood forecast-ing model for use with weather radar data: Part 2. Case studies, Hydrol. Earth Syst. Sci., 2, 283–298, doi:10.5194/hess-2-283-1998, 1998b.
Borga, M.: Accuracy o., 267, 26–39, 2002.
Bowler, N. E., Pierce, C. E., and Seed, A. W.: STEPS: A probabilis-tic precipitation forecasting scheme which merges an extrapola-tion nowcast with downscaled NWP, Q. J. Roy. Meteorol. Soc., 132, 2127–2155, 2006.
Browning, K. A.: Meteorological applications of radar, Reports Prog. Phys., 41, 763–801, 1978.
Carpenter, T. M. and Georgakakos, K. P.: Continuous streamflow simulation with the HRCDHM distributed hydrologic model, J. Hydrol., 298, 61–79, 2004.
Cluckie, I. D. and Owens, M. D.: Real-time Rainfall–Runoff Mod-els and Use of Weather Radar Information, in: Weather Radar and Flood Forecasting, edited by: Collinge, V. K. and Kirby, C., John Wiley & Sons Ltd, 171–190, 1987.
Cole, S. J. and Moore, R. J.: Hydrological modelling using raingauge- and radar-based estimators of areal rainfall, J. Hy-drol., 358, 159–181, 2008.
Cole, S. J. and Moore, R. J.: Distributed hydrological modelling using weather radar in gauged and ungauged basins, Adv. Water Resour., 32, 1107–1120, 2009.
Collier, C. G. and Knowles, J. M.: Accuracy of rainfall estimates by radar, part iii: Application for short-term flood forecasting, J. Hydrol., 83, 237–249, 1986.
DHI: MIKE SHE Water Movement: User manual, Danish Hy-draulic Institute, Hørsholm, Denmark, 2007.
Donaldson, C. A., Dyer, R. M., and Kraus, M. J.: An objective eval-uator of techniques fro predicting severe weather events, Ninth conference on severe local storms, American Meteorology Soci-ety, Boston, 321–326, 1975.
Fabry, F., Austin, G. L., and Tees, D.: The accuracy of rainfall esti-mates by radar as a function of range, Q. J. Roy. Meteorol. Soc., 118, 435–453, 1992.
Fabry, F., Bellon, A., Duncan, M. R., and Austin, G. L.: High reso-lution rainfall measurements by radar for very small basins: the sampling problem reexamined, J. Hydrol., 161, 415–428, 1994. Golding, B. W.: Nimrod: a system for generating automated very
short range forecasts, Meteorol. Appl., 5, 1–16, 1998.
Goudenhoofdt, E. and Delobbe, L.: Evaluation of radar-gauge merging methods for quantitative precipitation estimates, Hy-drol. Earth Syst. Sci., 13, 195–203, doi:10.5194/hess-13-195-2009, 2009.
Guo, J., Liang, X., and Leung, L. R.: Impacts of different precipi-tation data sources on water budgets, J. Hydrol., 298, 311–334, 2004.
Harrison, D. L., Driscoll, S. J., and Kitchen, M.: Improving pre-cipitation estimates from weather radar using quality control and correction techniques, J. Meteorol. Appl., 7, 135–144, 2000. Harrison, D. L., Scovell, R. W., and Kitchen, M.: High-resolution
precipitation estimates for hydrological uses, Proc. Inst. Civil Eng., 162, 125–135, 2009.
Harrold, T. W., English, E. J., and Nicholass, C. A.: The accuracy of radar derived rainfall measurements in hilly terrain, Q. J. Roy. Meteorol. Soc., 100, 331–350, 1974.
Hossain, F., Anagnostou, E. N., Dinku, T., and Borga, M.: Hydro-logical model sensitivity to parameter and radar rainfall estima-tion uncertainty, Hydrol. Process., 18, 3277–3291, 2004. Kitchen, M.: Towards improved radar estimates of surface
precipi-tation rate at long range, Q. J. Roy. Meteorol. Soc., 123, 145–163, 1997.
Krajewski, W. F. and Smith, J. A.: Radar hydrology: rainfall esti-mation, Adv. Water Resour., 25, 1387-1394, 2002.
Kunz, M. and Kottmeier, C.: Orographic enhancement of precipi-tation over low mountain ranges, Part I: Model formulation and idealized simulations, J. Appl. Meteorol. Clim., 45, 1025–1040, 2006.
Liang, X., Guo, J., and Leung, L.: Assessment of the effects of spa-tial resolutions on daily water flux simulations, J. Hydrol., 298, 287–310, 2004.
Liguori, S. and Rico-Ramirez, M. A.: A practical approach to the assessment of probabilistic flow predictions, Hydrol. Process., 27, 18–32, 2013.
MacDonald, M.: River Medway flood risk mapping, phase 3 study, volume 1-main report, Technical report, Environment Agency, Southern Region, Guildbourne House Chatsworth, Worthing, West Sussex, UK, 2003.
Moore, R. J.: The probability-distributed principle and runoff pro-duction at point and basin scales, Hydrolog. Sci. J., 30, 273–297, 1985.
Moore, R. J.: Advances in real-time flood forecasting practice. Sym-posium on Flood Warning Systems, Winter meeting of the River Engineering Section, The institution of Water Engineers and Sci-entist, p. 23, 1986.
Moore, R. J.: Real-time flood forecasting systems: Perspectives and prospects, in: Floods and landslides: integrated Risk As-sessment, edited by: Casale R. and Margottini, C., Springer, Berlin/Heidelberg, 147–189, 1999.
Moore, R. J. and Bell, V. A.: Incorporation of groundwater losses and well level data in rainfall–runoff models illustrated using the PDM, Hydrol. Earth Syst. Sci., 6, 25–38, doi:10.5194/hess-6-25-2002, 2002.
Nelder, J. A. and Mead, R.: A simplex method for function mini-mization, Computer J., 7, 308–313, 1965.
Panofsky, H. A. and Brier, G. W.: Some Applications of Statistics to Meteorology, The Pennsylvania State University, 1965. Pollard, O., and Han, D.: Making calibration objectives relevant for
flood forecasting, Proc. Inst.f Civil Eng., 165, 121–136, 2012. Reed, S., Koren, V., Smith, M., Zhang, Z., Moreda, F., Seo, D.-J.,
and DMIP Participants: Overall distributed model intercompari-son project results, J. Hydrol., 298, 27–60, 2004.
Reichel, F., Verworn, H.-R., Kramer, S., Cluckie, I. D., and Rico-Ramirez, M. A.: Radar-based flood forecasting for the upper Medway catchment in the UK, Proceedings of the Institution of Civil Engineers, Water Manage. 162, 159–168, 2009.
Rico-Ramirez, M. A., Cluckie, I. D., Shepherd, G., and Pallot, A.: A high-resolution radar experiment on the island of Jersey, J. Me-teorol. Appl., 14, 117–129, 2007.
Rico-Ramirez, M. A., Bringi, V. N., and Thurai, M.: River flow simulations with polarimetric weather radar, in: Weather Radar and Hydrology, Proceedings of a symposium held in Exeter, UK, April 2011, edited by: Moore, R. J., Cole, S. J., and Illingworth, A. J., IAHS Press, 351, 466–471, 2012.
Schaefer, J. T.: The critical success index as an indicator of warning skill, Weather Forecast., 5, 570–575, 1990.
Schellart, A. N. A., Shepherd, W. J., and Saul, A. J.: Influence of rainfall estimation error and spatial variability on sewer flow pre-diction at a small urban scale, Adv. Water Resour., 45, 65–75, 2012.
Smith, J. A., Seo, D. J., Baeck, M. L., and Hudlow, M. D.: An Inter-comparison Study of NEXRAD Precipitation Estimates, Water Resour. Res., 32, 2035–2045, 1996.
Smith, M. B., Seo, D.-J., Koren, V. I., Reed, S. M., Zhang, Z., Duan, Q., Moreda, F. , and Cong, S.: The distributed model intercom-parison project (DMIP): motivation and experiment design, J. Hydrol., 298, 4–26, 2004.
272 D. Zhu et al.: Hydrological appraisal of operational weather radar rainfall estimates
Tachikawa, Y., Vieux, B. E., Georgakakos, K. P., and Nakakita, E. (Eds.): Weather Radar Information and Distributed Hydro-logical Modelling, Proceedings of an International Symposium (Symposium HS03) Held During IUGG 2003, the XXIII Gen-eral Assembly of the International Union of Geodesy and Geo-physics: at Sapporo, Japan, 30 June–11 July 2003, IAHS Press, 2003.
Velasco-Forero, C. A.: A non-parametric automatic blending methodology to estimate rainfall fields from rain gauge and radar data, Adv. Water Resour., 32, 986–1002, 2009.
Wilson, J. W. and Brandes, E. A.: Radar measurement of rainfall – A summary, B. Am. Meteorol. Soc., 60, 1048–1058, 1979.
Yang, Z. and Han, D.: Derivation of unit hydrograph using a transfer function approach, Water Resour. Res., 42, W01501, doi:10.1029/2005WR004227, 2006.
Young, P. C.: Rainfall-Runoff Modeling: Transfer Function Mod-els, Encyclopedia of Hydrological Sciences, John Wiley & Sons, Ltd., doi:10.1002/0470848944, 2006.
Zhu, D. and Cluckie, I. D.: A Preliminary Appraisal of Thurnham Dual Polarisation Radar in the Context of Hydrological Mod-elling Structure, J. Hydrol. Res., 43, 736–752, 2011.