Open Access
Research
Accuracy of commercial geocoding: assessment and implications
Eric A Whitsel*
1, P Miguel Quibrera
2, Richard L Smith
3, Diane J Catellier
4,
Duanping Liao
5, Amanda C Henley
6and Gerardo Heiss
2Address: 1Departments of Epidemiology and Medicine, University of North Carolina, Cardiovascular Disease Program, Bank of America Center
Suite 306, 137 East Franklin Street, Chapel Hill, NC 27514, USA, 2Department of Epidemiology, University of North Carolina, Cardiovascular
Disease Program, Bank of America Center Suite 306, 137 East Franklin Street, Chapel Hill, NC 27514, USA, 3Department of Statistics and
Operations Research, University of North Carolina, 201 Smith Building 128, Chapel Hill, NC 27599, USA, 4Department of Biostatistics, University
of North Carolina, Collaborative Studies Coordinating Center, 137 East Franklin Street, Chapel Hill, NC 27514, USA, 5Department of Health
Evaluation Sciences, Pennsylvania State University College of Medicine, 600 Centerview Drive Suite 2200, A210, Hershey, PA 17033, USA and
6Walter Royal Davis Library, University of North Carolina, Reference Department, Geographic Information Services, Chapel Hill, NC 27599, USA
Email: Eric A Whitsel* - [email protected]; P Miguel Quibrera - [email protected]; Richard L Smith - [email protected]; Diane J Catellier - [email protected]; Duanping Liao - [email protected]; Amanda C Henley - [email protected]; Gerardo Heiss - [email protected]
* Corresponding author
Abstract
Background: Published studies of geocoding accuracy often focus on a single geographic area, address source
or vendor, do not adjust accuracy measures for address characteristics, and do not examine effects of inaccuracy on exposure measures. We addressed these issues in a Women's Health Initiative ancillary study, the Environmental Epidemiology of Arrhythmogenesis in WHI.
Results: Addresses in 49 U.S. states (n = 3,615) with established coordinates were geocoded by four vendors
(A-D). There were important differences among vendors in address match rate (98%; 82%; 81%; 30%), concordance between established and vendor-assigned census tracts (85%; 88%; 87%; 98%) and distance between established and vendor-assigned coordinates (mean ρ [meters]: 1809; 748; 704; 228). Mean ρ was lowest among
street-matched, complete, zip-coded, unedited and urban addresses, and addresses with North American Datum of 1983 or World Geodetic System of 1984 coordinates. In mixed models restricted to vendors with minimally acceptable match rates (A-C) and adjusted for address characteristics, within-address correlation, and among-vendor heteroscedasticity of ρ, differences in mean ρ were small for street-type matches (280; 268; 275), i.e. likely
to bias results relying on them about equally for most applications. In contrast, differences between centroid-type matches were substantial in some vendor contrasts, but not others (5497; 4303; 4210) pinteraction < 10-4, i.e. more
likely to bias results differently in many applications. The adjusted odds of an address match was higher for vendor A versus C (odds ratio = 66, 95% confidence interval: 47, 93), but not B versus C (OR = 1.1, 95% CI: 0.9, 1.3). That of census tract concordance was no higher for vendor A versus C (OR = 1.0, 95% CI: 0.9, 1.2) or B versus C (OR = 1.1, 95% CI: 0.9, 1.3). Misclassification of a related exposure measure – distance to the nearest highway – increased with mean ρ and in the absence of confounding, non-differential misclassification of this distance biased
its hypothetical association with coronary heart disease mortality toward the null.
Conclusion: Geocoding error depends on measures used to evaluate it, address characteristics and vendor.
Vendor selection presents a trade-off between potential for missing data and error in estimating spatially defined attributes. Informed selection is needed to control the trade-off and adjust analyses for its effects.
Published: 20 July 2006
Epidemiologic Perspectives & Innovations 2006, 3:8 doi:10.1186/1742-5573-3-8
Received: 03 November 2005 Accepted: 20 July 2006
This article is available from: http://www.epi-perspectives.com/content/3/1/8 © 2006 Whitsel et al; licensee BioMed Central Ltd.
This is an Open Access article distributed under the terms of the Creative Commons Attribution License (http://creativecommons.org/licenses/by/2.0), which permits unrestricted use, distribution, and reproduction in any medium, provided the original work is properly cited.
Background
Various sources of measurement error have substantial implications for the accuracy of epidemiologic estimates. Exposure measurement error, for example, may arise when geographic information systems are trusted without recognizing the limitations of processes that rely on them. One such process is address matching, the automated pairing of coordinates (latitudes; longitudes) and statisti-cal tabulation areas (e.g. census tracts) with street addresses, typically using TIGER/Line or other street data files [1]. The process – which is also known as geocoding – has been described in detail [2,3]. Geocoding usually involves matching addresses to specific street segments then positioning the addresses along the segments assum-ing an even distribution of street numbers within them. Although this form of geocoding involves linear interpo-lation and assumptions that can be inappropriate, its inaccuracy may be overlooked in large, population-based studies of associations between spatially interpolated environmental exposures, relevant health outcomes, and their contextual, socioeconomic effect modifiers. Never-theless, geocoding accuracy is critical when such studies focus on exposure mechanisms that operate over short distances [4].
Although error in assignment of latitudes, longitudes, and census tracts has the potential to bias both estimation of location-specific exposures and socioeconomic contexts within which they occur [5,6], recent studies have reported mean positional errors in commercially geoco-ded address coordinates between fifty and 300 meters [7-11]. This is a distance over which long-term average ambi-ent air pollution concambi-entrations, meteorological measures and their monitor-to-monitor temporal correlations are relatively constant [12-14]. However, concentrations of traffic-related emissions rapidly fall to ambient levels within comparable distances from street center-lines [15]. Moreover, positional error may be relevant in an even wider range of studies if the previously reported range of distances (50 – 300 m) is an underestimate. Lack of adjustment for potentially important address characteris-tics suggests that this is a distinct possibility. Population density in the area surrounding an address, for example, is so strongly and inversely associated with positional error that reported distances may be biased by even small dif-ferences in the ratio of rural to urban and suburban address matches [16,17]. Positional error also varies markedly with match type, i.e. whether vendors match individual addresses to specific streets or to centers of sta-tistical tabulation areas (centroids) [18], yet to date, most studies have not accounted for these factors.
Published studies of positional error have several addi-tional features that are pertinent in this context. Many restricted their focus to a single geographic setting, address
source or geocoding vendor, while those focusing on mul-tiple vendors did not account for among-vendor hetero-scedasticity or within-address correlation of positional error [19,20]. Others ignored potential for verification bias [21] and with a notable exception, none examined effects of positional error on exposure measures [7]. Col-lectively, these observations suggest that the next genera-tion of studies in this area should be designed with generalizability, validity and utility in mind.
To this end, we established three study objectives: (i) to compare multiple geocoding vendors using an identical sample of addresses with known coordinates selected from a broad range of data sources and geographic areas, (ii) to estimate geocoding accuracy and account for address characteristics that affect it using appropriate sta-tistical procedures, and (iii) to estimate effects of observed inaccuracy on individual- and contextual-level exposure measures. We conducted this study to inform research emanating from two studies. The first, The Environmental
Epidemiology of Arrhythmogenesis in WHI [22], is an
ancil-lary study of electrocardiographic mechanisms linking air pollution and cardiovascular disease in 68,133 U.S. women aged 50–79 years at baseline in the Women's
Health Initiative (WHI) clinical trial [23]. The second, the Atherosclerosis Risk in Communities (ARIC) study, is a
pro-spective study of cardiovascular disease in 15,792 U.S. men and women aged 45–64 years at baseline [24]. This Institutional Review Board-approved ancillary study com-plied with all applicable regulations governing human subjects research (University of North Carolina Medical IRB# 03-EPID-12).
Methods
Assembling and cleaning addresses
We screened seven, publicly available electronic data sources for addresses in areas of the contiguous U.S. con-taining the 75 WHI and four ARIC exam sites [25-27]. Addresses were eligible for inclusion in this study if they were unique, associated with an established latitude, lon-gitude, street (or route or post office box), city and state; and valid in U.S. Census year 2000. Screening identified 3,615 such addresses: 2,522 of U.S. Environmental Pro-tection Agency (EPA) Air Quality System monitors in the 48 contiguous United States and District of Columbia; 1,050 of WHI clinical trial participants in five counties containing the majority of WHI participants residing in North Carolina (Durham; Forsyth; Guilford; Orange; Wake); and 43 of U.S. National Geodetic Survey (NGS) stations in the four ARIC communities (Forsyth County, NC; Washington County, MD; the city of Jackson, MS; eight suburbs of Minneapolis, MN). We cleaned the addresses (minor edits) when they did not conform to U.S. Postal Service standards [28]. We also used web-based utilities [29-32] to investigate and correct address
information (major edits) when it conflicted with that in accompanying field notes (EPA addresses only). If neither condition was met, we did not edit the addresses and flagged them as "unedited". The locations and character-istics of the addresses are described in Figure 1 and Table 1.
Spatial data quality
Coordinates in decimal degrees with at least six significant digits after the decimal point accompanied all addresses. EPA coordinates were established according to a federal accuracy standard of < 25 m [33], NGS coordinates, according to a federal standard < 10 m [34], and WHI coordinates, by applying a spatial routine that determines center points of residential land parcels on digital maps (adapted from O'Rourke [35]). The median accuracy of the latter method approximates that of high resolution aerial photography, 8 to 15 m depending on population density [16]. These coordinates and their associated block group, tract, and county identifiers (U.S. Census 2000 Federal Information Processing Standards [FIPS] codes) served as the criterion standards against which the accu-racy of vendor-assigned geocodes was measured.
Geocoding addresses and estimating accuracy
We submitted the addresses to four well-known vendors (A-D) frequently contracted by epidemiologists for geoco-ding and related services or products (Table 2). We label the vendors generically in this paper to mask their iden-tity, a practice consistent with our current data use agree-ments and previously implemented in similar contexts [5,7,20]. To examine whether editing introduced error, we also submitted unedited versions of the edited EPA addresses to one of the vendors. We estimated the accu-racy of geocodes assigned by the vendors using three pre-viously defined measures: (i) the address match rate (%), i.e. percentage of all addresses to which a given vendor assigned a latitude, longitude and FIPS code; (ii) the con-cordance (%) between vendor-assigned and criterion standard FIPS codes; and (iii) the distance in meters between vendor-assigned and criterion standard coordi-nates, as measured using the Haversine spherical Earth formula (ρ) [20]. We based the measures on analyses of spatial data that we transformed, when necessary, to a standard geographic coordinate system using ArcGIS® 9.0.
Analysis of variance
We used analysis of variance (ANOVA) to quantify the variation in ρ (log-transformed to satisfy the assumption
Location of the 3,615 addresses
Figure 1
Location of the 3,615 addresses. EPA = United States Environmental Protection Agency Air Quality System monitors.
NGS = United States National Geodetic Survey stations. WHI = Women's Health Initiative clinical trial participant residential parcels.
EPA NGS WHI
of Gaussian errors) among vendors, before and after con-trolling for characteristics that affect geocoding accuracy: address source (EPA; WHI; NGS), address type (complete; no street number; intersection), zip code (present; absent), editing (unedited; minor; major), population density of the associated census tract (persons/km2), and
original coordinate datum (North American Datum of 1983 [NAD83] or World Geodetic System of 1984 [WGS84]; North American Datum of 1927 [NAD27]; unknown). In this context, "no street number" includes rural route and post office box addresses. After testing for effect modification (significance of the interaction between vendor and match type), we stratified ANOVA models. We computed adjusted, least-square means among vendors using weights that were proportional to
the observed distribution of covariates in our dataset. We back-transformed predicted values to the original scale as follows: , where and were the vendor-spe-cific least square means and variances of log ρ, the latter estimated from the residuals. We used logistic regression to estimate the odds ratios and 95% confidence intervals (OR, 95% CI) for address match and census tract concord-ance among vendors, before and after adjustment for the same address characteristics used in the ANOVA models. We arbitrarily chose vendor C as a basis for comparison in these logistic models.
Within-address dependence and among-vendor heteroscedasticity of ρ
Recognizing that the above analyses failed to account for the observed dependence of coordinates assigned to the same address by different vendors and the heterogeneity of variances across vendors (among centroid-type matches), we repeated analyses using mixed effects mod-els. This modeling framework allowed simultaneous spec-ification of the within-address dependence and among-vendor heteroscedasticity of ρ. Assuming values of ρ
pro-vided by different vendors were equally correlated, we used a compound symmetric (exchangeable) covariance structure. We were not interested in testing hypotheses concerning the variances and covariances of the within-address covariance matrix. We simply considered them as nuisance parameters needing to be controlled. We also considered the addresses as a random sample of a larger defined population, and the sample of vendors as fixed. Inferences therefore pertain to the four vendors.
Application
We examined the effects of geocoding error over the observed range of ρ in a 5% random sample of street-type
address matches (n = 2,608) and a census of centroid-type address matches (n = 2,671) from The Environmental
Epi-demiology of Arrhythmogenesis in WHI, 1999–2002 [36]. eµ σˆ ˆ /+ 2 2 µˆ σˆ2
Table 1: Characteristics of the 3,615 addresses
Characteristic Stratum or Units n (%) or mean (standard deviation)
Address Source EPA 2,522 (70)
WHI 1,050 (29)
NGS 43 (1)
Address Typea Complete 2,808 (78)
No Street Number 460 (13)
Intersection 347 (10)
Zip Code Absent 2,359 (65)
Present 1,256 (35)
Edit Unedited 1,533 (42)
Minor 1,392 (39)
Major 690 (19)
Densityb persons/km2 1,066 (2,645)
Original Datumc NAD83 or WGS84 1,615 (45)
Unknown 1,274 (35)
NAD27 726 (20)
aComplete = street number, name, city and state present; No Street
Number = street name, city and state present; Intersection = crossing street names, city and state present. b33rd and 67th percentiles = 221
and 920 persons/km2. cOf associated coordinates: NAD83 and
NAD27 = North American Datum of 1983 and 1927; WGS84 = World Geodetic System of 1984.
Table 2: Characteristics of the four vendors
Vendor CASS Street Offset
Corner Inset
Street Data Files Scheduled Data File Updates
Original Datuma
Manual Address Cleaningb
TIGER USPS Other
A Yes 40 ft Yes 2002 2004 Yes 4×/yr WGS84 No
B No 5 ft Yes 2002 2004 Yes 4×/yr NAD83 No
C Yes 50 ft No 2002 2004 Yes 6×/yr NAD83 Yes
D No 0 ft No 2002 2003 No 2×/yr NAD83 No
aOf assigned coordinates: NAD83 = North American Datum of 1983. WGS84 = World Geodetic System of 1984. bAfter initial processing by
geocoding software. CASS = Address standardization certified by the United States Postal Service National Customer Support Center Certification Program, Coding Accuracy Support System. TIGER = Topologically Integrated Geographic Encoding and Referencing (TIGER/Line®) file. USPS =
Briefly, we displaced the coordinates associated with each address at random over a uniform distribution of θ (range, 0–360°) and lognormal distributions of ρ with
means and standard deviations approximating the range of values observed in this context. We used ArcGIS® 9.0 to
assign the original and displaced coordinates to year 2000 U.S. Census tracts and to estimate the distance between the coordinates and the nearest interstate, U.S., or state highway or major traffic thoroughfare at that time. Con-sistent with prior literature, we dichotomized this distance at 100 meters to create a simple proxy for traffic-related air pollution exposure [15,37]. Then we examined the effect of displacement on this proxy, exposure misclassification rates and census tract concordance. We completed all analyses using the SAS, Version 9.1 software package.
Results
Door-to-door return times and geocoding costs were gen-erally reasonable across vendors: range, 2–5 business days and $16–$25 per 1,000 addresses. However, analyses of the edited address database revealed large differences among vendors A-D in address match rate (98%; 82%; 81%; 30%), census tract concordance (85%; 88%; 87%; 98%) and mean ρ (1809; 748; 704; 228 m) (Table 3 and
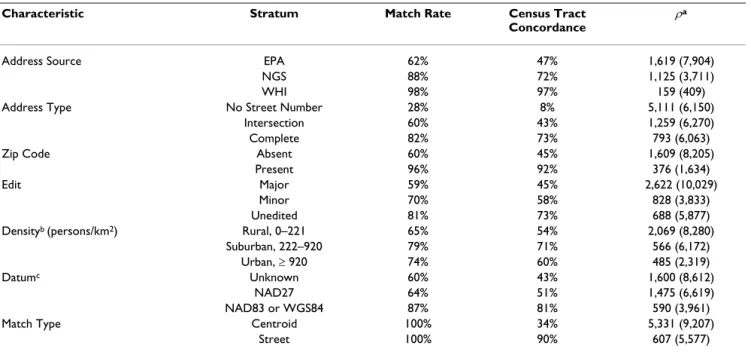
Figure 2). Address match rate and census tract concord-ance were relatively high and mean ρ, relatively low among WHI, complete, zip-coded, unedited, and urban or suburban addresses; addresses with NAD83 or WGS84 cri-terion standard coordinates; and street-type matches (Table 4).
In analyses restricted to vendors with minimally accepta-ble match rates (A-C), among-vendor differences in mean ρ were small for street-type matches (293; 287; 288 m). In
Table 3: Accuracy of geocodes assigned by the four vendors
Vendor Match Rate Concordance ρc
Overalla Street Centroidb Block Group Tract County
A 98% 79% 20% 77% 85% 99% 1809 (8790)
B 82% 78% 4% 83% 88% 99% 748 (4611)
C 81% 77% 4% 81% 87% 99% 704 (4418)
D 30% 30% 0% 97% 98% 100% 228 (884)
aDue to rounding, may differ from the sum of street- and centroid-type match rates.
bGeographic or delivery-weighted center of a statistical tabulation area, e.g. U.S. Census tract. cSpherical distance in meters between criterion
standard and vendor-assigned coordinates (mean [standard deviation]).
Table 4: Overall match rate, census tract concordance and ρa, by address and match characteristics
Characteristic Stratum Match Rate Census Tract Concordance
ρa
Address Source EPA 62% 47% 1,619 (7,904)
NGS 88% 72% 1,125 (3,711)
WHI 98% 97% 159 (409)
Address Type No Street Number 28% 8% 5,111 (6,150)
Intersection 60% 43% 1,259 (6,270)
Complete 82% 73% 793 (6,063)
Zip Code Absent 60% 45% 1,609 (8,205)
Present 96% 92% 376 (1,634)
Edit Major 59% 45% 2,622 (10,029)
Minor 70% 58% 828 (3,833)
Unedited 81% 73% 688 (5,877)
Densityb (persons/km2) Rural, 0–221 65% 54% 2,069 (8,280)
Suburban, 222–920 79% 71% 566 (6,172)
Urban, ≥ 920 74% 60% 485 (2,319)
Datumc Unknown 60% 43% 1,600 (8,612)
NAD27 64% 51% 1,475 (6,619)
NAD83 or WGS84 87% 81% 590 (3,961)
Match Type Centroid 100% 34% 5,331 (9,207)
Street 100% 90% 607 (5,577)
aSpherical distance in meters between criterion standard and vendor-assigned coordinates (mean [standard deviation]). bStratified at the 33rd and
67th percentiles. cOriginal datum of coordinates. NAD27 and NAD83 = North American Datum of 1927 and 1983. WGS84 = World Geodetic
Distribution of the spherical distance in meters (ρ) between criterion standard and vendor-assigned coordinates, by vendor
Figure 2
Distribution of the spherical distance in meters (ρ) between criterion standard and vendor-assigned coordi-nates, by vendor. Column I: Scatterplots in which Xs and center points represent vendor-assigned and criterion standard
coordinates, respectively. Columns II and III: Normalized frequency histograms before (II) and after (III) log-transformation. Columns I and II exclude outlying values to allow equal cross-vendor scaling of axes in meters. n = sample size. sd = standard deviation.
contrast, differences between centroid-type matches were substantial in some vendor contrasts, but not others (6375; 4854; 5524 m), p for interaction < 10-4. Adjust-ment for address characteristics, within-address correla-tion and heteroscedasticity of ρ reduced the mean and standard deviation of ρ (Table 5). The pattern of adjusted mean ρ among vendors reflected that of the adjusted odds of an address match: it was higher for vendor A versus C (OR = 66, 95% CI: 47, 93), but not B versus C (OR = 1.1, 95% CI: 0.9, 1.3). The adjusted odds of census tract con-cordance were, by comparison, no higher for vendor A versus C (OR = 1.0, 95% CI: 0.9, 1.2) or B versus C (OR = 1.1, 95% CI: 0.9, 1.3) (Table 6).
Further restricting analyses to records successfully geoco-ded by all vendors A-C attenuated mean ρ and its pattern
of differences among them. Match rate and census tract concordance were much lower, and mean ρ, much higher in analyses of the unedited versus edited EPA addresses (data not shown).
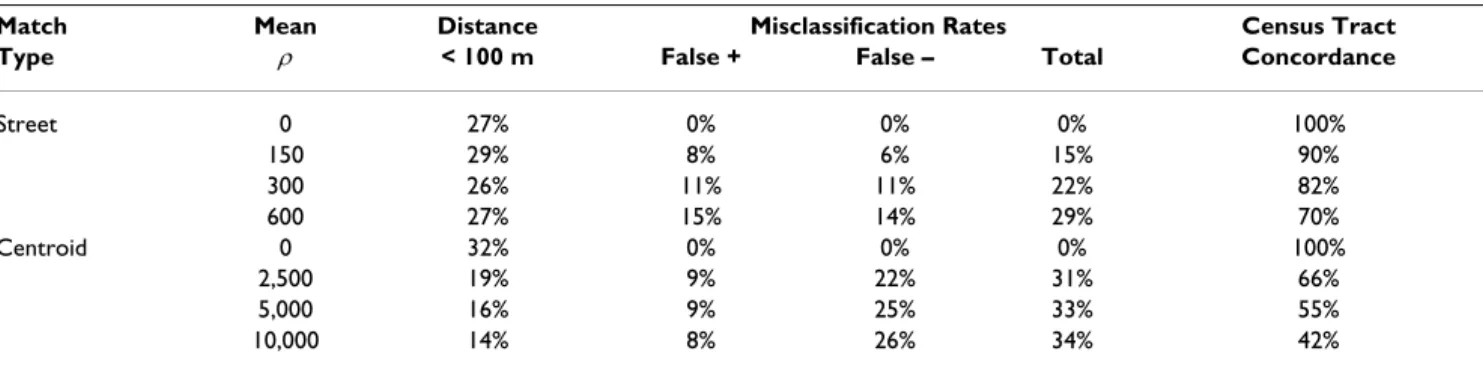
The percent of street-type address matches < 100 meters away from the nearest highway was relatively constant across mean ρ (Table 7). This apparent absence of
misclas-sification was related to counter-balancing effects of approximately equal false positive and false negative rates at values of mean ρ between 150 and 600 meters.
Together, they accounted for a 14% increase in the total
error rate over the same range. This increase was accompa-nied by a 20% decrease in census tract concordance.
In contrast, the percent of centroid-type address matches classified as < 100 meters away from the nearest highway was approximately two-fold higher at zero versus non-zero values of mean ρ (Table 7). This finding was related
to the two- to three-fold excess of false negative versus false positive rates at values of mean ρ between 2,500 and
10,000 meters. The total error rate increased by 3% and census tract concordance decreased by 24% over the same range.
Discussion
Persistent concerns about the potential effects of inaccu-rate geocoding on spatially interpolated environmental exposures, exposure-outcome associations, and their con-textual effect modifiers have stimulated interest in the positional error of commercially geocoded address coor-dinates. However, studies of the topic have often reported average positional errors in the range of fifty to 300 meters [6-9,16-20]. Although these reports have reduced such concerns, few studies have focused on multiple geo-graphic areas, address sources and vendors; adjusted accu-racy measures for important address and methodological characteristics; and estimated the influence of inaccuracy on individual- and contextual-level exposure measures. The generalizability, validity and utility of these estimates is therefore unclear.
We addressed this issue in a Women's Health Initiative ancillary study, the Environmental Epidemiology of
Arrhyth-mogenesis in WHI, by submitting addresses selected from a
broad range of data sources and geographic areas to four well-known vendors often contracted by epidemiologists for geocoding and related services or products (at the time of submission, they had been in business for a combined total of > 35 years, employed > 650 persons, and reported > $50 million of annual sales [38]). We then examined
Table 5: Spherical distance in meters (ρ) between criterion standard and vendor-assigned coordinates (mean [standard deviation]), by match type and vendor
Match Type Vendor ρ
Unadjusted Adjusteda Withina,b Heteroa-c
Street A 293 (564) 272 (476) 280 (492) NA B 287 (545) 262 (438) 268 (447) NA C 288 (551) 266 (456) 275 (471) NA Centroid A 6,375 (10,437) 6,194 (9,473) 5,630 (8,576) 5,497 (8,345) B 4,854 (27,279) 3,663 (15,948) 4,230 (18,730) 4,303 (19,185) C 5,524 (34,703) 3,298 (13,068) 3,900 (15,943) 4,210 (17,638)
aFor address source, type, zip code, edit, population density (persons/km2) and datum.
bAlso adjusted for within-address correlation of ρ. cAdditionally adjusted for among-vendor heteroscedasticity of ρ (see methods). NA = not
applicable.
Table 6: Odds ratios (95% confidence intervals) for overall address match and census tract concordance, by vendor
Overall Address Match Census Tract Concordance Vendor Unadjusted Adjusteda Unadjusted Adjustedb
A 12 (9, 15) 66 (47, 93) 0.8 (0.7, 0.9) 1.0 (0.9, 1.2)
B 1.1 (0.9, 1.2) 1.1 (0.9, 1.3) 1.1 (0.9, 1.2) 1.1 (0.9, 1.3)
C 1.0 1.0 1.0 1.0
aAdjusted for address source, type, zip code, edit, population density,
differences between vendors in address match rate, census tract concordance and mean ρ.
We found that geocoding error depends on measures used to evaluate it and vendor. More specifically, vendors matching lower proportions of addresses geocoded them with higher spatial accuracy, i.e. higher census tract con-cordance and lower mean ρ. We also found that that geoc-oding error depends on address characteristics. Mean ρ, for example, was relatively high among EPA, incomplete, unzip-coded, edited and rural addresses; addresses with NAD27 criterion standard coordinates; and in particular, centroid-type address matches. After stratifying by match type, then adjusting for the remaining address characteris-tics and other methodological factors, mean ρ remained
twenty times higher among vendor A's centroid- versus street-type address matches. The adjusted odds of an address match also remained more than sixty times higher for vendor A than either B or C. Lastly, by randomly dis-placing address coordinates over the range of mean ρ observed in this context, we found that traffic-related pol-lution exposure misclassification rates increased and cen-sus tract concordance decreased with corresponding increases in mean ρ.
Considered together, these findings suggest that vendor selection presents a trade-off between potential for miss-ing data and error in estimatmiss-ing spatially defined attributes such as environmental exposure and socioeco-nomic context. They also indicate that the trade-off can be quite unbalanced. Vendor D, for example, matched an unacceptably low proportion of addresses, but geocoded them with a singularly high level of spatial accuracy. Moreover, the observed association between missing data and positional error across vendors suggests that while
vendors may be targeting different points along the trade-off spectrum, they tend to retain observations that are likely to have positional errors. Deleting these observa-tions would of course translate into reduced potential for bias due to individual- and contextual-level exposure measurement error, but it remains unclear whether ven-dors can increase data accuracy without compromising its availability.
Although these findings may have greater generalizability, validity and utility than those previously reported, our cri-terion standards may have been imperfect. Interpretation must therefore recognize potential for bias due to the elu-siveness of a definitive criterion standard. Indeed, match rate and concordance may have been overestimated and mean ρ, underestimated because using imperfect criterion standards tends to artificially inflate accuracy [21].
Since errors in accuracy measures vary with errors in imperfect criterion standards, we therefore edited addresses when they failed to conform to U.S. postal standards or conflicted with field notes. Editing was intended to reduce misspelled, misspaced or inappropri-ately abbreviated state, street suffix or secondary unit des-ignators like "apartment" [28]. Though well-intentioned, editing may have introduced error instead of reducing it. Mindful of this possibility, we submitted both the unedited and edited versions of EPA addresses for geoco-ding. We found that, on average, match rate and census tract concordance were much higher and mean ρ, much lower in analyses of the edited versus unedited versions of the database. This finding confirmed that, on average, editing tended to correct addresses and thereby reduce error in accuracy measures, but as a precaution, we also adjusted measures of accuracy for edit type.
Table 7: Effect of mean ρa on classification of distance to the nearest highwayb, exposure misclassification ratesc and census tract concordanced
Match Mean Distance Misclassification Rates Census Tract Type ρ < 100 m False + False – Total Concordance
Street 0 27% 0% 0% 0% 100% 150 29% 8% 6% 15% 90% 300 26% 11% 11% 22% 82% 600 27% 15% 14% 29% 70% Centroid 0 32% 0% 0% 0% 100% 2,500 19% 9% 22% 31% 66% 5,000 16% 9% 25% 33% 55% 10,000 14% 8% 26% 34% 42%
aSpherical distance in meters between criterion standard and vendor-assigned coordinates. Standard deviation of ρ = 500 and 15,000 meters for
street- and centroid-type matches, respectively. bInterstate, U.S., or state highway or major traffic thoroughfare. cFalse + indicates misclassification
of the unexposed (≥ 100 m) as exposed (< 100 m). False – indicates misclassification of the exposed as unexposed. The sum of false + and – error rates may not equal the total error rate due to rounding. dPercent of census tracts matching those in the datasets without positional error (ρ = 0).
Based on a 5% random sample of street-type address matches (n = 2,608) and a census of centroid-type address matches (n = 2,671) in The Environmental Epidemiology of Arrhythmogenesis in WHI, 1999–2002.
Even after editing addresses, our criterion standards may have contained erroneous coordinates of EPA monitors, NGS stations and WHI participants. Such errors have been identified, for example, within EPA databases of environ-mental hazards in South Carolina [39]. Although theses errors vary across data sources, among states and over time, their potential existence in this context is no less a concern. The EPA implemented its Locational Data Policy in 1991 in response to concerns of this sort. It stipulated adoption of uniform methods, use of global positioning systems and collection of monitor coordinates according to a Federal Interagency Coordinating Committee on Dig-ital Cartography accuracy standard of 25 meters [33]. Five years later, the EPA also launched its Locational Data Improvement Project as a vehicle for further improvement in the accuracy of its databases [40]. Moreover, the NGS adheres to a stricter, 1998 Federal Geographic Data Com-mittee standard of less than ten meters [34] – a distance identical to that between parcel center points and true res-idential locations in urban settings and somewhat less than that in rural areas [16]. We also adjusted measures of accuracy for differences among address sources despite these reassurances.
Interpretation of the findings reported here must also con-sider the challenges inherent in disentangling the general effect of vendor and the specific effect of a given geocod-ing method. Street offset – the perpendicular distance between vendor-assigned coordinates and the corre-sponding street centerline – serves as an illustrative exam-ple. Although researchers are often troubled by vendors' underlying assumption that this distance is equal for all addresses, a different study design would have been required to discriminate effects of vendor and offset because as a default, vendors A-D used distinct offsets between zero and fifty feet. However, a repeated-measures design – one in which the same addresses would have been geocoded repeatedly by the same vendors using dif-ferent offsets – was not feasible: the option of changing defaults was not uniformly available among vendors A-D. Even if it had been, prior reports suggesting that the con-tribution of offset to geocoding accuracy is rather modest within the narrow range of defaults observed in this con-text are reassuring [11,16].
Conclusion
With these caveats in mind, we conclude that informed selection of geocoding practices and approaches to data analysis involves estimating potential for, balancing the trade-off between, and when appropriate, adjusting for the effects of missing data and error in spatially defined attributes. We suggest beginning this process by submit-ting (masked) addresses associated with high quality cri-terion standard coordinates in a given study area to geocoding vendors, estimating the accuracy of vendor-assigned coordinates, and selecting vendors that balance the tradeoff between missing data and error in ways that best meet study needs. If edited and unedited forms of the same address are included in the geocoded data set, address cleaning procedures – which should (but may not) be standardized – can be simultaneously evaluated.
Comparing the limitations of methods commonly used to analyze incomplete data with those used to adjust for positional or exposure measurement error may help prior-itize individual study needs in advance [41-44]. Basic algebra, for instance, can be used to adjust associations for exposure measurement error [44]. Consider the cell counts observed in a hypothetical case-control study of the association between distance to the nearest highway and coronary heart disease mortality (Table 8). The sensi-tivity (se) and specificity (sp) of the 100 m distance classi-fication at mean ρ = 150 m can be calculated from the
corresponding false negative (fn) and false positive (fp) rates in Table 7:
se = 1 - fn = 1 - 0.06 = 0.94
sp = 1 - fp = 1 - 0.08 = 0.92
Under non-differential misclassification, the corrected cell counts are
a = (a* - 0.08 × (a* + c*)) ÷ (0.94 + 0.92 - 1) = 81.40
b = (b* - 0.08 × (b* + d*)) ÷ (0.94 + 0.92 - 1) = 88.19
c = (a* + c*) - a = 143.61
d = (b* + d*) - b = 313.81
and in the absence of confounding, the corrected odds ratio is
OR = (a × d) ÷ (b × c) = (81.40 × 313.81) ÷ (88.19 × 143.61) = 2.0
This odds ratio is more extreme than its uncorrected coun-terpart, OR* (Table 8), which is biased toward the null. Its
Table 8: Cell counts from a hypothetical case-control study of the association between distance to the nearest highway and coronary heart disease mortality
Distance Case Non-Case
< 100 m a* = 88 b* = 108
≥ 100 m c* = 137 d* = 294
corrected probability distribution can be estimated using Monte Carlo simulation [45].
However, the magnitude of exposure measurement error in a continuous variable such as distance to the nearest highway may not vary directly with the magnitude of a given exposure-outcome association. When it is inde-pendent of disease status, the resulting misclassification of commonly used exposure categories (e.g. distance < or ≥ 100 meters) may be differential and vary in unantici-pated ways. Seemingly appropriate adjustments may also be inaccurate even when this type of misclassification is non-differential [43]. Such adjustments must therefore be applied with caution.
Nonetheless, uninformed selection of geocoding practices and data analysis appears to be a less desirable alternative, particularly in studies of exposure mechanisms operating within short distances. The positional errors reported here suggest that "short" should be defined as less than 280 meters for potentially geocodable addresses matched at the street level and less than 5.5 kilometers for those matched at the centroid level by well-known vendors with minimally acceptable match rates. Critical distances, though, may be substantially lower given the non-negligi-ble misclassification rates we observed when mean ρ was
approximately one-half as large as these values. More accurate geocoding methods that involve global position-ing or parcel matchposition-ing can be used to reduce potential for bias in studies requiring such high levels of spatial resolu-tion [2,16]. Use of the latter method is expected to grow over time as high quality, parcel-level databases become more uniformly available across larger study areas.
Abbreviations
ARIC Atherosclerosis Risk in Communities
CASS Coding Accuracy Support System
EPA Environmental Protection Agency
FIPS Federal Information Processing Standards
NAD27 and NAD83 North American Datum of 1927 and 1983
NGS National Geodetic Survey
TIGER Topologically Integrated Geographic Encoding and Referencing
USPS United States Postal System
WHI Women's Health Initiative
WGS84 World Geodetic System of 1984
Competing interests
The author(s) declare that they have no competing inter-ests.
Authors' contributions
EAW conceived of the study, designed it, and drafted the manuscript. PMQ assembled and analyzed the data, and helped draft the manuscript. RLS directed the statistical analysis and helped draft the manuscript. DJC helped direct the statistical analysis and draft the manuscript. DL helped design the study and draft the manuscript. ACH directed handling of geographic data and helped draft the manuscript. GH helped design the study and draft the manuscript.
Acknowledgements
The National Institute of Environmental Health Sciences funded this ancil-lary study (5-R01-ES012238). The National Heart, Lung and Blood Institute, U.S. Department of Health and Human Services funded the WHI program. The authors published their preliminary findings as an abstract [18] and acknowledge the contributions of WHI Investigators in the:
Program Office (National Heart, Lung, and Blood Institute, Bethesda, Mar-yland) Barbara Alving, Jacques Rossouw, Shari Ludlam, Linda Pottern, Joan McGowan, Leslie Ford, and Nancy Geller.
Clinical Coordinating Center (Fred Hutchinson Cancer Research Center, Seattle, WA) Ross Prentice, Garnet Anderson, Andrea LaCroix, Charles L. Kooperberg, Ruth E. Patterson, Anne McTiernan; (Wake Forest University School of Medicine, Winston-Salem, NC) Sally Shumaker; (Medical Research Labs, Highland Heights, KY) Evan Stein; (University of California at San Francisco, San Francisco, CA) Steven Cummings.
Clinical Centers (Albert Einstein College of Medicine, Bronx, NY) Sylvia Wassertheil-Smoller; (Baylor College of Medicine, Houston, TX) Jennifer Hays; (Brigham and Women's Hospital, Harvard Medical School, Boston, MA) JoAnn Manson; (Brown University, Providence, RI) Annlouise R. Assaf; (Emory University, Atlanta, GA) Lawrence Phillips; (Fred Hutchinson Can-cer Research Center, Seattle, WA) Shirley Beresford; (George Washington University Medical Center, Washington, DC) Judith Hsia; (Harbor-UCLA Research and Education Institute, Torrance, CA) Rowan Chlebowski; (Kai-ser Permanente Center for Health Research, Portland, OR) Evelyn Whit-lock; (Kaiser Permanente Division of Research, Oakland, CA) Bette Caan; (Medical College of Wisconsin, Milwaukee, WI) Jane Morley Kotchen; (MedStar Research Institute/Howard University, Washington, DC) Barbara V. Howard; (Northwestern University, Chicago/Evanston, IL) Linda Van Horn; (Rush Medical Center, Chicago, IL) Henry Black; (Stanford Preven-tion Research Center, Stanford, CA) Marcia L. Stefanick; (State University of New York at Stony Brook, Stony Brook, NY) Dorothy Lane; (The Ohio State University, Columbus, OH) Rebecca Jackson; (University of Alabama at Birmingham, Birmingham, AL) Cora E. Lewis; (University of Arizona, Tucson/Phoenix, AZ) Tamsen Bassford; (University at Buffalo, Buffalo, NY) Jean Wactawski-Wende; (University of California at Davis, Sacramento, CA) John Robbins; (University of California at Irvine, CA) F. Allan Hubbell; (University of California at Los Angeles, Los Angeles, CA) Howard Judd; (University of California at San Diego, LaJolla/Chula Vista, CA) Robert D. Langer; (University of Cincinnati, Cincinnati, OH) Margery Gass; (Univer-sity of Florida, Gainesville/Jacksonville, FL) Marian Limacher; (Univer(Univer-sity of
Hawaii, Honolulu, HI) David Curb; (University of Iowa, Iowa City/Daven-port, IA) Robert Wallace; (University of Massachusetts/Fallon Clinic, Worcester, MA) Judith Ockene; (University of Medicine and Dentistry of New Jersey, Newark, NJ) Norman Lasser; (University of Miami, Miami, FL) Mary Jo O'Sullivan; (University of Minnesota, Minneapolis, MN) Karen Mar-golis; (University of Nevada, Reno, NV) Robert Brunner; (University of North Carolina, Chapel Hill, NC) Gerardo Heiss; (University of Pittsburgh, Pittsburgh, PA) Lewis Kuller; (University of Tennessee, Memphis, TN) Karen C. Johnson; (University of Texas Health Science Center, San Anto-nio, TX) Robert Brzyski; (University of Wisconsin, Madison, WI) Gloria E. Sarto; (Wake Forest University School of Medicine, Winston-Salem, NC) Denise Bonds; (Wayne State University School of Medicine/Hutzel Hospi-tal, Detroit, MI) Susan Hendrix.
References
1. U.S. Census Bureau: Topologically Integrated GeographicEn-coding and Referencing (TIGER) system. [http://www.cen sus.gov/geo/www/tiger/index.html].
2. Rushton G, Armstrong MP, Gittler J, Greene BR, Pavlick CE, West MM, Zimmerman DL: Geocoding in cancer research: A review.
Am J Prev Med 2006, 30(2S):S16-S24.
3. Vine MF, Degnan D, Hanchette C: Geographic information sys-tems: Their use in environmental epidemiologic research.
Environ Health Perspect 1997, 106(6):598-605.
4. Nuckols JR, Ward MH, Jarup L: Using geographic information systems for exposure assessment in environmental epidemi-ology studies. Environ Health Perspect 2004, 112(9):1007-1015. 5. Krieger N, Waterman P, Lemieux K, Zierler S, Hogan JW: On the
wrong side of the tracts? Evaluating the accuracy of geocod-ing in public health research. Am J Public Health 2001, 91(7):1114-1116.
6. Yu L: Development and evaluation of a framework for assess-ing the efficiency and accuracy of street address geocodassess-ing strategies. In PhD Thesis State University of New York at Albany, Rockefeller College of Public Affairs and Policy; 1996.
7. Ward MH, Nuckols JR, Giglierano J, Bonner MR, Wolter C, Airola M, Mix W, Colt JS, Hartge P: Positional accuracy of two methods of geocoding. Epidemiology 2005, 16(4):542-547.
8. Karimi HA, Durcik M, Rasdorf W: Evaluation of uncertainties associated with geocoding techniques. Computer-aided Civil and
Infrastructure Engineering 2004, 19(3):170-185.
9. Bonner MR, Han D, Nie J, Rogerson P, Vena JE, Freudenheim JL: Posi-tional accuracy of geocoded addresses in epidemiologic research. Epidemiology 2003, 14(4):408-412.
10. Dearwent SM, Jacobs RR, Halbert JB: Locational uncertainty in georeferencing public health datasets. J Expo Anal Environ
Epide-miol 2001, 11(4):329-334.
11. Ratcliffe JH: On the accuracy of TIGER-type geocoded address data in relation to cadastral and census areal units. Int J
Geo-graphical Information Science 2001, 15(5):473-485.
12. U.S. Environmental Protection Agency: Guidelines on procedures for constructing air pollution isopleth profiles and popula-tion exposure analysis. In EPA-450/2-77-024a Research Triangle Park, NC; 1977.
13. Ito K, De Leon S, Thurston GD, Nádas A, Lippmann M: Monitor-to-monitor temporal correlation of air pollution in the contigu-ous US. J Expo Anal Environ Epidemiol 2005, 15(2):172-184. 14. Ito K, Thurston GD, Nádas A, Lippmann M: Monitor-to-monitor
temporal correlation of air pollution and weather variables in the North-Central U.S. J Expo Anal Environ Epidemiol 2001, 15(2):172-184.
15. Zhu YF, Hinds WC, Kim S, Sioutas C: Concentration and size dis-tribution of ultrafine particles near a major highway. J Air
Waste Manag Assoc 2002, 52(9):1032-1042.
16. Cayo MR, Talbot TO: Positional error in automated geocoding of residential addresses. International J Health Geographics 2003, 2(10):.
17. Hurley SE, Saunders TM, Nivas R, Hertz A, Reynolds P: Post office box addresses: a challenge for geographic information sys-tem-based studies. Epidemiology 2003, 14(4):386-391.
18. Whitsel EA, Quibrera PM, Smith RL, Catellier DJ, Liao D, Henley AC, Heiss G: Accuracy of commercial geocoding in a Women's Health Initiative ancillary study: The Environmental
Epide-miology of Arrhythmogenesis in WHI [Abstract]. Circulation 111(14):237.
19. Bellander T, Berglind N, Gustavsson P, Jonson T, Nyberg F, Pershagen G, Jarup L: Using geographic information systems to assess individual historical exposure to air pollution from traffic and house heating in Stockholm. Environ Health Perspect 2001, 109(6):633-639.
20. Whitsel EA, Rose KM, Wood JL, Henley AC, Liao D, Heiss G: Accu-racy and repeatability of commercial geocoding. Am J
Epide-miol 2004, 160(10):1023-1029.
21. Begg CB: Biases in the assessment of diagnostic tests. Stat Med 1987, 6:411-423.
22. Whitsel EA, Heiss G, Smith RL, Catellier DJ, Liao D, Peuquet DJ, Pri-neas RJ, Anderson GL: Environmental Epidemiology of Arrhythmogenesis in WHI. [http://crisp.cit.nih.gov/crisp/ CRISP_LIB.getdoc?textkey=6599396&p_grant_num=1R01ES012238-01&p_query=&ticket=6776514&p_audit_session_id=30381838&p_k eywords=].
23. The WHI Study Group: Design of the Women's Health Initia-tive clinical trial and observational study. Control Clin Trials 1998, 19(1):61-109.
24. ARIC investigators: The Atherosclerosis Risk in Communities (ARIC) Study: design and objectives. Am J Epidemiol 1989, 129(4):687-702.
25. U.S. Environmental Protection Agency: Technology Transfer Net-work. Air Quality System. [http://www.epa.gov/ttn/airs/airsaqs/ detaildata/downloadaqsdata.htm].
26. Links to North Carolina county geographic information sys-tems (GIS) websites [http://www.unc.edu/~ewhitsel/ NCGISlinks2.html]
27. National Geodetic Survey: NGS datasheet page. [http:// www.ngs.noaa.gov/cgi-bin/datasheet.prl].
28. U.S. Postal Service: Official USPS Abbreviations. [http:// www.usps.com/ncsc/lookups/usps_abbreviations.html].
29. U.S. Census Bureau: American Fact Finder. [http://factfinder.cen sus.gov/servlet/AGSGeoAd
dressServt?_lang=en&_programYear=50&_treeId=420].
30. U.S. Environmental Protection Agency: EnviroMapper. [http:// www.epa.gov/enviro/html/em/index2.html].
31. Mapquest [http://www.mapquest.com] 32. Google Maps [http://maps.google.com]
33. U.S. Environmental Protection Agency: Locational data.
Informa-tion Resources Management Policy Manual. EPA directive 2100 1991
[http://www.epa.gov/irmpoli8/archived/polman/chaptr13.htm]. 34. Federal Geographic Data Committee: Geospatial positioning
accuracy standards. Part 2: Standards for geodetic networks.
FGDC-STD-007.2-1998 [http://www.fgdc.gov/standards/
standards_publications/index_html].
35. O'Rourke J: Computational Geometry in C 2nd edition. Cambridge: Cambridge University Press; 1998.
36. Whitsel EA, Liao D, Prineas RJ, Peuquet DJ, Quibrera PM, Catellier DJ, Heiss G, Smith RL: Heart rate variability, ambient particu-late matter and socioeconomic context: The Environmental Epidemiology of Arrhythmogenesis in WHI [Abstract].
Cir-culation 2006, 113(8):338.
37. Hoek G, Fischer P, Van Den Brandt P, Goldbohm S, Brunekreef B: Estimation of long-term average exposure to outdoor air pollution for a cohort study on mortality. J Expo Anal Environ
Epidemiol 2001, 11(6):459-469.
38. Dun and Bradstreet: Small business solutions. Company profile reports. [http://www.dnb.com/us].
39. Scott M, Cutter SL, Menzel C, Ji M, Wagner D: Spatial accuracy of the EPA's environmental hazards databases and their use in environmental equity analyses. Appl Geog Studies 1997, 1(1):45-61.
40. U.S. Environmental Protection Agency: Locational Data Improve-ment Project (LDIP). [http://www.epa.gov/enviro/html/loca tional/ldip].
41. Raghunathan TE: What do we do with missing data? Some options for analysis of incomplete data. Annu Rev Public Health 2004, 25:99-117.
42. Cressie N, Kornak J: Spatial statistics in the presence of loca-tion error with an applicaloca-tion to remote sensing of the envi-ronment. Stat Sci 2003, 18(4):436-456.
Publish with BioMed Central and every scientist can read your work free of charge
"BioMed Central will be the most significant development for disseminating the results of biomedical researc h in our lifetime."
Sir Paul Nurse, Cancer Research UK Your research papers will be:
available free of charge to the entire biomedical community peer reviewed and published immediately upon acceptance cited in PubMed and archived on PubMed Central yours — you keep the copyright
Submit your manuscript here:
http://www.biomedcentral.com/info/publishing_adv.asp
BioMedcentral
43. Flegal KM, Keyl PM, Nieto FJ: Differential misclassification aris-ing from nondifferential errors in exposure measurement.
Am J Epidemiol 1991, 134(10):1233-1244.
44. Greenland S: Basic methods for sensitivity analysis and exter-nal adjustment. In Modern epidemiology second edition. Edited by: Rothman KJ, Greenland S. Philadelphia: Lippincott Williams and Wilkins; 1998:343-357.
45. Phillips CV: Quantifying and reporting uncertainty from sys-tematic errors. Epidemiology 2003, 14(4):459-466.

![Table 5: Spherical distance in meters ( ρ ) between criterion standard and vendor-assigned coordinates (mean [standard deviation]), by match type and vendor](https://thumb-us.123doks.com/thumbv2/123dok_us/8342795.2216300/7.918.85.832.166.318/spherical-distance-criterion-standard-assigned-coordinates-standard-deviation.webp)