Parametric Optimization of Electric Discharge
Drilling Machine Using Al-SiC Metal Matrix
Composite
S.Vijaya KumarAP/Mechanical Engineering, Muthayammal Engineering College, Rasipuram, Namakkal, Tamilnadu, India Email: [email protected] +91-9629723720
C.Srinivasan
AP/Mechanical Engineering, Muthayammal Engineering College, Rasipuram, Namakkal, Tamilnadu, India Email: [email protected] +91-9047710365
P.Paramasivam
AP/Mechanical Engineering, Muthayammal Engineering College, Rasipuram, Namakkal, Tamilnadu, India Email: [email protected] +91-7708432392
M.Maniyarasan
AP/Mechanical Engineering, Muthayammal Engineering College, Rasipuram, Namakkal, Tamilnadu, India Email: [email protected] +91-8508509789
71
ISSN: 2278 – 7798 All Rights Reserved © 2015 IJSETR
Abstract - Electric Discharge Drill Machine (EDDM) is a spark erosion process to produce micro and small holes in conductive materials. This process is widely used in aerospace, medical, dental and automobile industries.
As for the performance evaluation of the Electric discharge drilling machine it is very necessary to study the process parameters of machine tool. In this study a brass rod of 1 mm diameter was selected as a tool electrode.
The experiments generate output responses such as material removal rate (MRR) and tool wear rate (TWR). The parameters such as pulse on-time, Pulse off-time and water pressure were studied for best machining characteristics. This investigation presents the use of Taguchi approach for better MRR in drilling of Al-6061 based composites. The experiments were performed based on L27 orthogonal array as per Taguchi’s design of experiment concept.
From the analysis of variance the percentage contribution of the control factor in the machining of Al-6061 based composites in EDDM were obtained.
The optimal combination levels and the significant drilling parameters on MRR and TWR were obtained. The optimization results showed that the combination of maximum pulse on-time and minimum pulse off-time gives maximum MRR and minimum pulse on-time and maximum pulse off-time gives minimum TWR.
Index Terms- EDDM, MMC-Metal Matrix Composite, MRR Stir casting, SiC, TWR.
I. INTRODUCTION
Samar Singh et.al [1] study in this research paper a brass rod 2 mm diameter was selected as a tool electrode. The experiments generate output responses such as material removal rate (MRR). The best parameters such as pulse on-time, Pulse off-time and water pressure were studied for best machining characteristics. A plan of experiments, based on L27 Taguchi design method
A.TolgaBozdana et.al [2] reports an experimental investigation of EDM drilling of 2 mm diameter holes on
Inconel 718 using brass electrode. The effect of process parameters (discharge current, pulse on and off times, and capacitance) on process outputs (material removal rate and electrode wear rate) was determined based on minimum number of experiments. The mathematical modelling of process has been done using Response Surface Methodology.
Ruben Phipon et.al [3] this present research study deals with the single and multi objective optimization of micro EDM process using Genetic Algorithm. Mathematical models using Response Surface Methodology (RSM) is used to correlate the response and the parameters.
C. Diver et.al [4] this papers details the development of a novel technique to produce reverse tapered micro-holes the quality of the holes produced is examined using a novel 3D impression technique, as well as SEM, surface roughness, and 3D optical measurements.
O. Yilmaz, et.al [5] a comparative investigation of fast hole drilling of aerospace alloys, namely as Inconel 718 and Ti-6Al-4V using electrical discharge machining (EDM) method was performed in order to explore the influence of electrode type and material. The experimental results reveal that the single-channel electrodes have comparatively better MRR and lower Electrode wear.
Electric Discharge Drill Machine (EDDM) is a spark erosion process to produce micro and small holes in conductive materials. As for the performance evaluation of the Electric discharge drilling machine it is very necessary to study the process parameters of machine tool.
In this experiment the optimization based on brass tube of diameter 1 mm taken as a electrode and Al-SiC metal matrix composites taken as a work piece from these two kind of materials MRR and TWR is analyzed by L27 Taguchi design method.
72
ISSN: 2278 – 7798 All Rights Reserved © 2015 IJSETR
II. EXPERIMENTAL PROCEDURE A. SPECIMEN PREPARATION
The specimen is must be prepared by considering various process parameters like and all the steps for the preparation of Al-SiC composites are followed. The steps include weight calculation, fabrication (casting and machining) and experiment conduct.
TABLE 1
PROPERTIES OF Al 6061 AND SiC
Properties Al 6061 SiC Elastic Modulus (GPa) 70-80 410 Density (g/cc) 2.7 3.1 Poisson’s Ratio 0.33 0.14 Hardness (kg/mm2) 95 2800
Modulus of rigidity
(GPa) 26 140 Shear strength (MPa) 83 - Tensile Strength (MPa) 115 390
FORMULAE:
Weight = Volume x Percentage x Density Density of Al alloy=2.72g/cm3
Density of SiC alloy=3.21g/cm3 TABLE 2
WEIGHT OF Al alloy and SiC
S.No Samples Weight of Al Ingot in Grams Weight of SiC powder in Grams 1 For 6% of SiC 306.8 23.1 B. EXPERIMENTAL SETUP
Fig. 1 and Fig. 2 show the preheating furnace and stir casting furnace. Stir casting method is used to melt the Aluminium ingots. The coil transfers the heat to the crucible and melts the metal.
Fig.1 Pre Heating Furnace
Fig.2 Stir Casting Furnace
The melting capacity of the stir casting furnace is 3 kg. SiC preheated in preheating chamber around 8500C.Required Quantity of Al metal is charged into the
main crucible and placed inside the furnace and heated by coil.
A stirrer positioned at the top of the furnace is used to mixing the reinforcement in the molten metal. An electric motor is used to rotate the stirrer through belt drive, at 1200 rpm. As Stirrer has to rotate at 600 rpm, the shaft and the stirrer have large pulley which reduce the rpm. Die is made of wood which has one part of 20x20 mm in cross section and 300mm length.
C. FABRICATION
Aluminium particle is charged into the crucible and kept inside the furnace and covered. Switch on the furnace and temperature is gradually raised up to 900°C.
Pre heated reinforcement (around 850°C) is adding into molten metal in main furnace crucible and Stirrer with 5minutes.
From the stirring action of 5 minutes the reinforced material is evenly distributed entire liquid metal.
Clean the die before pouring the liquid metal, so that it reduces the solidification rate. Magnesium is added to the liquid metal which increases the wet ability of the matrix and assisted particle incorporation.
The liquid stage metal matrix composite is taken out and poured in to the die then cooled. Cast specimen shown in Figure 3.
73
ISSN: 2278 – 7798 All Rights Reserved © 2015 IJSETR
D. MACHINING
After casting the work piece is machined by ordinary lathe in required dimensions of 10mmx10mmx150mm.
E. PROBLEM IDENTIFICATION
Stirrer blade starts to erode at 600 rpm at high temperature.Tool (High Speed Steel) was getting blunted while machining the specimen.
III. INVESTIGATION OF MRR & TWR
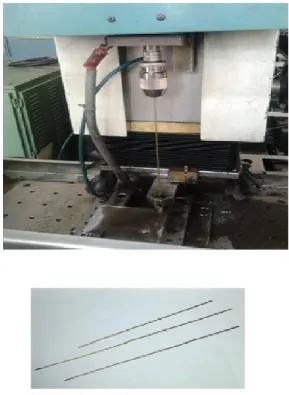
Experiments are performed on Electronica Make ED 300 Electric discharge drilling Machine as shown in fig. 4. The goal is to obtain the best machining parameters resulting in Maximum MRR and minimum TWR. Holes were made in a 10 mmX10 mm cross section square piece of Al 6061 based composites using a 1 mm diameter electrode of Brass in 27 pitches. Take job centre in y-axis and edge reference in x-axis. Here pitch means y axis is constant and x axis varies from 5, 10… 135mm.
Fig. 4 Experimental set up of EDM drilling machine
The initial weight of the work piece was precise weighed using an accuracy digital scale. The work piece was connected to the terminals of power supply and clamped on the machine table. The dielectric fluid was flushed at a Constant pressure in the gap between electrode and work piece. Holes of 10 mm depth were drilled in all the experiments. The time taken for machining each hole was recorded. At completion of each hole the Work piece was removed from the machine, washed, dried, and
weighted. The material removed rate and tool wear rate was calculated using the following formula (1) and (2)
(Weight of the Work piece before machining- Weight of the Work piece after machining)
MRR= --- mg/s Machining time --- (1)
(Weight of the Electrode before machining- Weight of the Electrode after machining)
TWR= --- mg/s Machining time --- (2)
An L27 orthogonal array has been employed as per Taguchi’s method based robust design philosophy to evaluate the main influencing factors that affect the material removal rate (MRR) and tool wear rate (TWR).three EDDM parameters pulse on-time, pulse off-time and water pressure are considered as the controlling factors for optimal analysis during drilling of material.
IV.DESIGN OF EXPERIMENTS
After you have identified the "vital few" by screening, you need to determine the "best" or optimal values for these experimental factors. Optimal factor values depend on the process objective. For example, you may want to maximize process yield or reduce product variability. The optimization methods available in Minitab include general full factorial designs (designs with more than two-levels), response surface designs, mixture designs, and Taguchi designs.
A.TAGUCHI DESIGN EXPERIMENTS IN MINITAB 14
Before you begin using Minitab, you need to complete all pre-experimental planning. For example, you need to choose control factors for the inner array and noise factors for the outer array. Control factors are factors you can control to optimize the process. Noise factors are factors that can influence the performance of a system Use Create Taguchi Design to generate a Taguchi design (orthogonal array). Or, use Define Custom Taguchi Design to create a design from data that you already have in the worksheet. Define Custom Taguchi Design allows you to specify which columns are your factors and signal factors. You can then easily analyze the design and generate plots.
After you create the design, you may use Modify Design to rename the factors, change the factor levels, add a signal factor to a static design, ignore an existing signal factor (treat the design as static), and add new levels to an existing signal factor. Perform the experiment and collect the response data. Then, enter the data in your Minitab worksheet. See Collecting and Entering Data. Use Analyze
74
ISSN: 2278 – 7798 All Rights Reserved © 2015 IJSETR
Taguchi Design to analyze the experimental data. See Analyzing Taguchi Designs. Use Predict Results to predict S/N ratios and response characteristics for selected new factor settings. See Predicting Results.
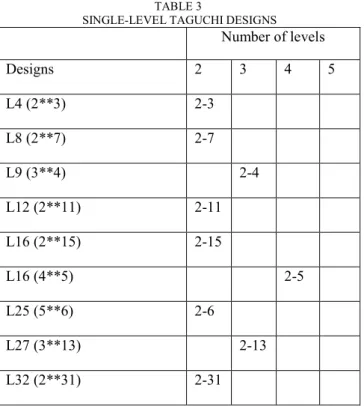
B. SINGLE-LEVEL DESIGNS
The table below summarizes the single-level Taguchi designs available. The number following the "L" indicates the number of runs in the design. In this investigation L27 Taguchi design is used with has 27 runs. The numbers in the table indicate the minimum and maximum number of available factors for each design.
TABLE 3
SINGLE-LEVEL TAGUCHI DESIGNS
Number of levels Designs 2 3 4 5 L4 (2**3) 2-3 L8 (2**7) 2-7 L9 (3**4) 2-4 L12 (2**11) 2-11 L16 (2**15) 2-15 L16 (4**5) 2-5 L25 (5**6) 2-6 L27 (3**13) 2-13 L32 (2**31) 2-31
V. RESULTS AND DISCUSSION
A. EXPERIMENTAL VALUES OF MRR AND TWR
From the experiment ,MRR and TWR are calculated and summaries as follows in the table 5.1,5.2 and 5.3 these tables represent the MRR and TWR for the various pulse on-time, pulse off-time and water pressure
The different sets of experiments are performed on EDDM. The work material, electrode and other machining conditions are as follows:
Electrode: brass
Work piece: Al-SiC composite On time :(25-75) µs
Off time:(10-20) µs
Water pressure:(25-35) Kg/cm2
Taguchi recommends analyzing the mean response for each run in the inner array, and he also suggests analyzing variation using an appropriately chosen signal-to-noise ratio (S/N).These S/N ratios are derived from the
quadratic loss function and among the three, the following is “Smaller the best” is considered to be standard and widely applicable: Where y is the average of observed data, n is the number of observations.
S/N= - 10 log (1/n ∑n i=1 1/y2)
The optimal setting is the parameter combination that has highest S/N ratio. The statistical analysis of the data is performed by analysis of variance (ANOVA) to study the contribution of the factor and interactions and to explore the effects of each process on the observed value.
TABLE 4 EXPERIMENTAL VALUES S.NO ON TIME (µs) OFF TIME (µs) FLUSHING PRESSURE (Kg/cm2) MRR gm/min TWR gm/min 1 25 10 25 0.032 0.07 2 25 10 30 0.034 0.068 3 25 10 35 0.036 0.067 4 25 15 25 0.025 0.064 5 25 15 30 0.022 0.062 6 25 15 35 0.026 0.061 7 25 20 25 0.021 0.06 8 25 20 30 0.023 0.059 9 25 20 35 0.024 0.057 10 50 10 25 0.04 0.08 11 50 10 30 0.043 0.078 12 50 10 35 0.044 0.077 13 50 15 25 0.042 0.076 14 50 15 30 0.044 0.074 15 50 15 35 0.045 0.073 16 50 20 25 0.041 0.07 17 50 20 30 0.042 0.069 18 50 20 35 0.044 0.067 19 75 10 25 0.054 0.092 20 75 10 30 0.055 0.09 21 75 10 35 0.058 0.089 22 75 15 25 0.05 0.088 23 75 15 30 0.052 0.086 24 75 15 35 0.053 0.085 25 75 20 25 0.05 0.084 26 75 20 30 0.052 0.082
75
ISSN: 2278 – 7798 All Rights Reserved © 2015 IJSETR
27 75 20 35 0.053 0.08
TABLE 5
EXPERIMENTAL VALUES and S/N ratios for MRR
S .No On Ti m e (µs ) Off T ime ( µs) F lu sh in g P re ss ure (Kg /cm 2 ) M RR gm /min TWR gm/min SNR1 Mea n1 1 25 10 25 0.032 0.07 -29.897 0.032 2 25 10 30 0.034 0.068 -29.3704 0.034 3 25 10 35 0.036 0.067 -28.8739 0.036 4 25 15 25 0.025 0.064 -32.0412 0.025 5 25 15 30 0.022 0.062 -33.1515 0.022 6 25 15 35 0.026 0.061 -31.7005 0.026 7 25 20 25 0.021 0.06 -33.5556 0.021 8 25 20 30 0.023 0.059 -32.7654 0.023 9 T W R 25 20 35 0.024 0.057 -32.3958 0.024 10 50 10 25 0.04 0.08 -27.9588 0.04 11 50 10 30 0.043 0.078 -27.3306 0.043 12 50 10 35 0.044 0.077 -27.1309 0.044 13 50 15 25 0.042 0.076 -27.535 0.042 14 50 15 30 0.044 0.074 -27.1309 0.044 15 50 15 35 0.045 0.073 -26.9357 0.045 16 50 20 25 0.041 0.07 -27.7443 0.041 17 50 20 30 0.042 0.069 -27.535 0.042 18 50 20 35 0.044 0.067 -27.1309 0.044 19 75 10 25 0.054 0.092 -25.3521 0.054 20 75 10 30 0.055 0.09 -25.1927 0.055 21 MR R 75 10 35 0.058 0.089 -24.7314 0.058 22 75 15 25 0.05 0.088 -26.0206 0.05 23 75 15 30 0.052 0.086 -25.6799 0.052 24 75 15 35 0.053 0.085 -25.5145 0.053 25 75 20 25 0.05 0.084 -26.0206 0.05 26 75 20 30 0.052 0.082 -25.6799 0.052 27 75 20 35 0.053 0.08 -25.5145 0.053
MODEL CALCULATION FOR S/N RATIO IN MRR
S/N=-10 log (1/0.0322) (larger the better)
=-29.897
TABLE 6
EXPERIMENTAL VALUES and S/N ratios for TWR
S .No On Ti m e (µs ) Off T ime ( µs) F lu sh in g pre ss ure (Kg /Cm 2 ) M RR gm /min TWR gm/min SNR2 Mea n2 1 25 10 25 0.032 0.07 23.098 0.07 2 25 10 30 0.034 0.068 23.3498 0.068 3 25 10 35 0.036 0.067 23.4785 0.067 4 25 15 25 0.025 0.064 23.8764 0.064 5 25 15 30 0.022 0.062 24.1522 0.062 6 25 15 35 0.026 0.061 24.2934 0.061 7 25 20 25 0.021 0.06 24.437 0.06 8 25 20 30 0.023 0.059 24.583 0.059 9T W R 25 20 35 0.024 0.057 24.8825 0.057 10 50 10 25 0.04 0.08 21.9382 0.08 11 50 10 30 0.043 0.078 22.1581 0.078 12 50 10 35 0.044 0.077 22.2702 0.077 13 50 15 25 0.042 0.076 22.3837 0.076 14 50 15 30 0.044 0.074 22.6154 0.074 15 50 15 35 0.045 0.073 22.7335 0.073 16 50 20 25 0.041 0.07 23.098 0.07 17 50 20 30 0.042 0.069 23.223 0.069 18 50 20 35 0.044 0.067 23.4785 0.067 19 75 10 25 0.054 0.092 20.7242 0.092 20 75 10 30 0.055 0.09 20.9151 0.09 21 M RR 75 10 35 0.058 0.089 21.0122 0.089 22 75 15 25 0.05 0.088 21.1103 0.088 23 75 15 30 0.052 0.086 21.31 0.086 24 75 15 35 0.053 0.085 21.4116 0.085 25 75 20 25 0.05 0.084 21.5144 0.084 26 75 20 30 0.052 0.082 21.7237 0.082 27 75 20 35 0.053 0.08 21.9382 0.08
76
ISSN: 2278 – 7798 All Rights Reserved © 2015 IJSETR
S/N=-10 log (0.072) (Smaller the better)
=23.098
TABLE 7
ANALYSIS OF VARIANCE FOR MRR, USING ADJUSTED SS FOR TESTS
Source DF Seq SS Adj SS Adj MS F P
On time 2 0.0001 022 0.0001 042 0.0000 521 217.14 0.000 Off time 2 0.0000041 0.0000041 0.0000020 8.44 0.002 Flushing pressure 2 0.0000 019 0.0000 019 0.0000 010 3.98 0.035 Error 20 0.0000 048 0.0000 048 0.0000 002 Total 26 0.0001 130 S = 0.000489831 R-Sq = 95.75% R-Sq (adj) =94.48% TABLE 8
ANALYSIS OF VARIANCE FOR TWR, USING ADJUSTED SS FOR TESTS
Source DF Seq SS Adj SS Adj MS F P On time 2 0.0001 765 0.0001 779 0.0000 889 3361.6 5 0.000 Off time 2 0.0000 279 0.0000 280 0.0000 140 528.32 0.002 Flushing pressure 2 0.0000 033 0.0000 033 0.0000 016 62.36 0.000 Error 20 0.0000 005 0.0000 005 0.0000 016 Total 26 0.0002 082 S = 0.000162652 R-Sq = 99.75% R-Sq (adj) = 99.67%
FIG.5 GRAPH MRR VS ON TIME, OFF TIME AND WATER PRESSURE
B. OPTIMUM CONDITION FOR MRR On Time =75 µS
Off Time=10 µS
Flushing Pressure=35 Kg/cm2
FIG.6 GRAPH TWR VS ON TIME, OFF TIME AND WATER PRESSURE
C. OPTIMUM CONDITION FOR TWR On Time =25 µS
Off Time=20 µS
Flushing Pressure=35 Kg/cm2
VI. CONCLUSION
The effects of various drilling parameters on the tool wear rate and material removal rate of Al-SiC plate were investigated. The following conclusion can be drawn on the basis of the present experimental investigation:
From the mathematical modeling, the regression co-efficient (R2) value for tool wear rate (TWR) is 99.6% and for material removal rate (MRR) is 94%. This enables the good prediction accuracy. The regression co-efficient (R2) value is the measure of the goodness of fit of the model, 99.6% of the total variation was explained by the model for TWR and 94% for MRR.
77
ISSN: 2278 – 7798 All Rights Reserved © 2015 IJSETR
From ANOVA results, pulse on time has the maximum (90.4%) influence on the material removal rate followed by pulse off time (3.6%) and flushing pressure of (1.7%) influence the MRR.
From ANOVA results, pulse on time has the maximum (84.7%) influence on the tool wear rate followed by pulse off time (13.4%) and flushing pressure of (1.5%) influence the TWR.
VII. REFERENCES